


Manjushree Technopack Limited
Packaging That PerformsInnovation in Every Pack
Unlisted Review Rating
Average
DRHP Not FiledShaping Sustainable Packaging Through Scale, Technology, and Innovation
Manjushree Technopack is a scaled, cash-generative and professionally managed rigid-packaging business with a strong manufacturing footprint and credible exposure to sustainability-led packaging demand.
PARAMETER
WEIGHT
SCORE
KEY FACTORS
Financial Performance
25.0%
4.0/5
The Company delivered strong FY25 revenue growth, although part of the expansion was acquisition-led. During FY25, the Company acquired Oricon Enterprises’ plastic closures and preforms business for consideration of INR 540.2 Cr.
Show more
Detailed Analysis
Revenue increased from INR 2,097.3 Cr in FY23 to INR 2,569.8 Cr in FY25, representing a 2-year CAGR of 10.7%. Revenue grew by 21.4% in FY25, from INR 2,117.0 Cr in FY24
EBITDA increased from INR 386.6 Cr in FY24 to INR 411.4 Cr in FY25, representing growth of 6.4%. However, EBITDA margin declined from 18.3% to 16.0%, indicating that operating profit growth was significantly slower than revenue growth
PAT increased from INR 140.8 Cr in FY24 to INR 247.6 Cr in FY25, representing growth of 75.9%. PAT margin improved from 6.7% to 9.6%
The reported debt-to-equity ratio improved from 0.8x in FY24 to 0.7x in FY25, despite borrowings increasing as the Company funded acquisitions and capacity expansion
ROE increased from 14.5% in FY24 to 20.5% in FY25, supported by the increase in reported PAT. The improvement should be interpreted cautiously because FY25 PAT included substantial exceptional income
Operating cash flow remained positive at INR 352.4 Cr in FY24 and INR 343.5 Cr in FY25, although it declined by 2.5% due to higher inventory, receivables and other working-capital deployment
Industry
25.0%
0.0/5
The industry has attractive demand drivers across food and beverages, pharmaceuticals, personal care and industrial products. However, the market remains fragmented and price-competitive, while resin-price volatility and environmental regulation can pressure margins
Show more
Detailed Analysis
India’s rigid plastic packaging market is estimated to grow at approximately 6.7% CAGR between 2026 and 2035, supported by processed-food penetration, pharmaceutical packaging, organised retail and cold-chain expansion
Rigid plastic packaging is a large and established industry, but continues to expand through sustainable materials, recycled-content packaging and consolidation
Category-I rigid plastic packaging is subject to EPR, recycling and reuse obligations. The minimum recycling target increases from 60.0% in FY26 to 70.0% in FY27 and 80.0% from FY28 onward. These rules create compliance and redesign requirements, but also support demand for the Company’s recycling capabilities
Manangement
25.0%
4.0/5
The Company benefits from experienced professional management and a reasonably structured board. Its governance profile is supported by independent representation and the absence of reported fraud
Show more
Detailed Analysis
The Company is professionally managed rather than conventionally founder-led. MD and CEO Thimmaiah NP had approximately 30.0 years of leadership experience across BEML, Cummins, Honeywell and Meritor before leading Manjushree Technopack
The board listed in the FY25 annual report comprised 7.0 directors, including 3.0 independent directors, representing independent participation of 42.9%
The Company reported a net disputed income-tax liability of INR 23.4 Cr, but reported no fraud and no court or regulatory order affecting its going-concern status
Valuation
25.0%
3.0/5
Manjushree Technopack does not appear inexpensive at the prevailing unlisted valuation
Show more
Detailed Analysis
The Company is valued at a P/E multiple of 26.2x, compared with the packaging-industry P/E of 24.6x, representing a premium of 6.6%
The Company is valued at 23.1x EV/EBITDA. The selected peer median is 10.3x, resulting in a premium of 124.5%
The unlisted share price declined from approximately INR 900.0 in early July 2026 to INR 870.0 during the middle of the month, before recovering to approximately INR 900.0 by July 28, 2026. The observed price range was approximately 3.3%, with an overall broadly flat monthly return
TOTAL
100%
2.8/5
Weighted Composite Score
Per Share Price
₹899.0
As of 14 Oct 2026
Lot Size
50.0 Shares
Minimum Investment
₹44,95,000.0 / 5,000 shares
Market Cap. (₹ Cr)
Revenue FY’25 (in Cr)
PAT FY’25 (in Cr)
P/E Multiple
Face Value
₹ 2.0Lot Size
50.0 sharesSale Type
PrimaryPAT FY’25 (in Cr)
₹ 247.6 CrPAT Margin (%)
9.6 %P/E Multiple
26.2xCAGR Growth 3Y
10.7 %ROE (FY’25)
20.5 %ROCE (FY’25)
10.7 %Price to Book Value ratio
5.5xDebt/Equity (FY’25)
0.7xMerchant banker appointed
❌ NoCompany Website
www.manjushreeindia.comDisclaimer: Unlisted shares are unregulated & illiquid. This is NOT investment advice. Please do your own due diligence before investing.
Minimum Investment
₹44,95,000.0 / 5,000 sharesShares Lot 50 X 100
Investment amount
₹44,95,000.0
Overview
Business
Business Model
Geographical Presence
Sales Channel
Financial Highlights
Income Statement
Revenue growth with EBITDA and PAT margins
| Financial Metric | FY 2023 | FY 2024 | FY 2025 |
|---|---|---|---|
| Revenue (₹ Cr) | 2,097.3 | 2,117.0 | 2,569.8 |
| Growth (%) | 42.9% | 0.9% | 21.4% |
| EBITDA (₹ Cr) | 305.7 | 386.6 | 411.4 |
| EBITDA Margin (%) | 14.6% | 18.3% | 16.0% |
| PAT (₹ Cr) | 59.2 | 140.8 | 247.6 |
| PAT Margin (%) | 2.8% | 6.7% | 9.6% |
OBSERVATIONS & INSIGHTS
Revenue from operations increased from ₹2,097.35 Cr in FY23 to ₹2,569.83 Cr in FY25, implying a 3-year CAGR of approximately 10.7%
FY25 revenue grew 21.4% year-on-year, supported by scale-up in domestic product revenue and other operating income
PAT increased from ₹59.23 Cr in FY23 to ₹247.63 Cr in FY25, with PAT margin improving from 2.8% to 9.6%
EBITDA increased from ₹305.71 Cr in FY23 to ₹411.40 Cr in FY25, though EBITDA margin moderated from 18.3% in FY24 to 16.0% in FY25.
Balance Sheet
| Financial Metric | FY 2023 | FY 2024 | FY 2025 |
|---|---|---|---|
| EQUITY & LIABILITIES | ₹ 2,297.7 Cr | ₹ 2,284.3 Cr | ₹ 3,205.4 Cr |
| Net Worth | ₹ 951.0 Cr | ₹ 1,008.1 Cr | ₹ 1,411.0 Cr |
| Share Capital | ₹ 13.7 Cr | ₹ 13.7 Cr | ₹ 17.3 Cr |
| Reserves & Surplus | ₹ 937.3 Cr | ₹ 994.4 Cr | ₹ 1,393.7 Cr |
| Total Liabilities | ₹ 1,346.7 Cr | ₹ 1,276.2 Cr | ₹ 1,794.4 Cr |
| Current Liabilities | ₹ 741.9 Cr | ₹ 708.5 Cr | ₹ 1,219.5 Cr |
| Borrowings | ₹ 371.2 Cr | ₹ 369.2 Cr | ₹ 608.6 Cr |
| Trade Payables | ₹ 267.8 Cr | ₹ 276.2 Cr | ₹ 407.7 Cr |
| Other Current Liabilities | ₹ 102.9 Cr | ₹ 63.1 Cr | ₹ 203.2 Cr |
| Non-Current Liabilities | ₹ 604.8 Cr | ₹ 567.7 Cr | ₹ 574.9 Cr |
| Borrowings | ₹ 433.9 Cr | ₹ 384.4 Cr | ₹ 382.4 Cr |
| Other Non-Current Liabilities | ₹ 170.9 Cr | ₹ 183.3 Cr | ₹ 192.5 Cr |
| ASSETS | ₹ 2,297.6 Cr | ₹ 2,284.4 Cr | ₹ 3,205.3 Cr |
| Current Assets | ₹ 844.5 Cr | ₹ 757.1 Cr | ₹ 1,200.6 Cr |
| Trade Receivables | ₹ 309.7 Cr | ₹ 301.1 Cr | ₹ 423.7 Cr |
| Inventory | ₹ 352.3 Cr | ₹ 353.6 Cr | ₹ 533.4 Cr |
| Cash & Cash Equivalents | ₹ 1.6 Cr | ₹ 24.4 Cr | ₹ 113.3 Cr |
| Other Current Assets | ₹ 180.9 Cr | ₹ 78.0 Cr | ₹ 130.2 Cr |
| Non-Current Assets | ₹ 1,453.1 Cr | ₹ 1,527.3 Cr | ₹ 2,004.7 Cr |
| Fixed Assets | ₹ 1,170.3 Cr | ₹ 1,198.9 Cr | ₹ 1,655.2 Cr |
| Other Non-Current Assets | ₹ 282.8 Cr | ₹ 328.4 Cr | ₹ 349.5 Cr |
OBSERVATIONS & INSIGHTS
Total assets increased from ₹2,297.72 Cr in FY23 to ₹3,205.34 Cr in FY25, driven by capacity expansion, acquisitions, inventories and receivables
Net worth increased from ₹951.00 Cr in FY23 to ₹1,411.07 Cr in FY25, supported by profit retention, CCD issuance/conversion and other equity movements
Current borrowings increased materially in FY25 to ₹608.58 Cr, reflecting higher working capital and funding requirements
Inventory and trade receivables increased sharply in FY25, which should be monitored for working capital efficiency
Fixed assets increased from ₹1,170.33 Cr in FY23 to ₹1,655.15 Cr in FY25, indicating significant manufacturing asset base expansion
Cash Flow
| Financial Metric | FY 2023 | FY 2024 | FY 2025 |
|---|---|---|---|
CFO (₹ Cr) Cash generated from core business operations. | +345.3 Cr | +352.4 Cr | +343.5 Cr |
CFI (₹ Cr) Cash used for investments and long-term assets. | -380.0 Cr | -149.3 Cr | -737 Cr |
CFF (₹ Cr) Cash flow related to funding and borrowings. | +35.2 Cr | -257.1 Cr | +483.3 Cr |
Working Capital
| Efficiency Metric | FY 2023 | FY 2024 | FY 2025 |
|---|---|---|---|
Debtor Days Average number of days taken to collect customer payments. | - | - | - |
Creditor Days Average time taken to pay suppliers and vendors. | - | - | - |
Inventory Days Average number of days inventory remains unsold. | - | - | - |
CCC (Cash Conversion Cycle) (Debtor Days + Inventory Days - Creditor Days) | - | - | - |
Financial Ratios
Measures the company’s leverage relative to shareholder equity.
OBSERVATIONS & INSIGHTS
ROE improved from 6.4% in FY23 to 20.5% in FY25 due to higher profitability on an expanded equity base
Debt/equity reduced from 0.85x in FY23 to 0.70x in FY25, indicating improved leverage despite higher absolute borrowings
ROCE reduced to 10.7% in FY25 when calculated before exceptional items, due to higher capital employed and operating profit moderation
Interest coverage moderated to 1.73x in FY25 due to higher finance costs and lower operating profit before exceptional items.
Industry Overview
Industry Drivers
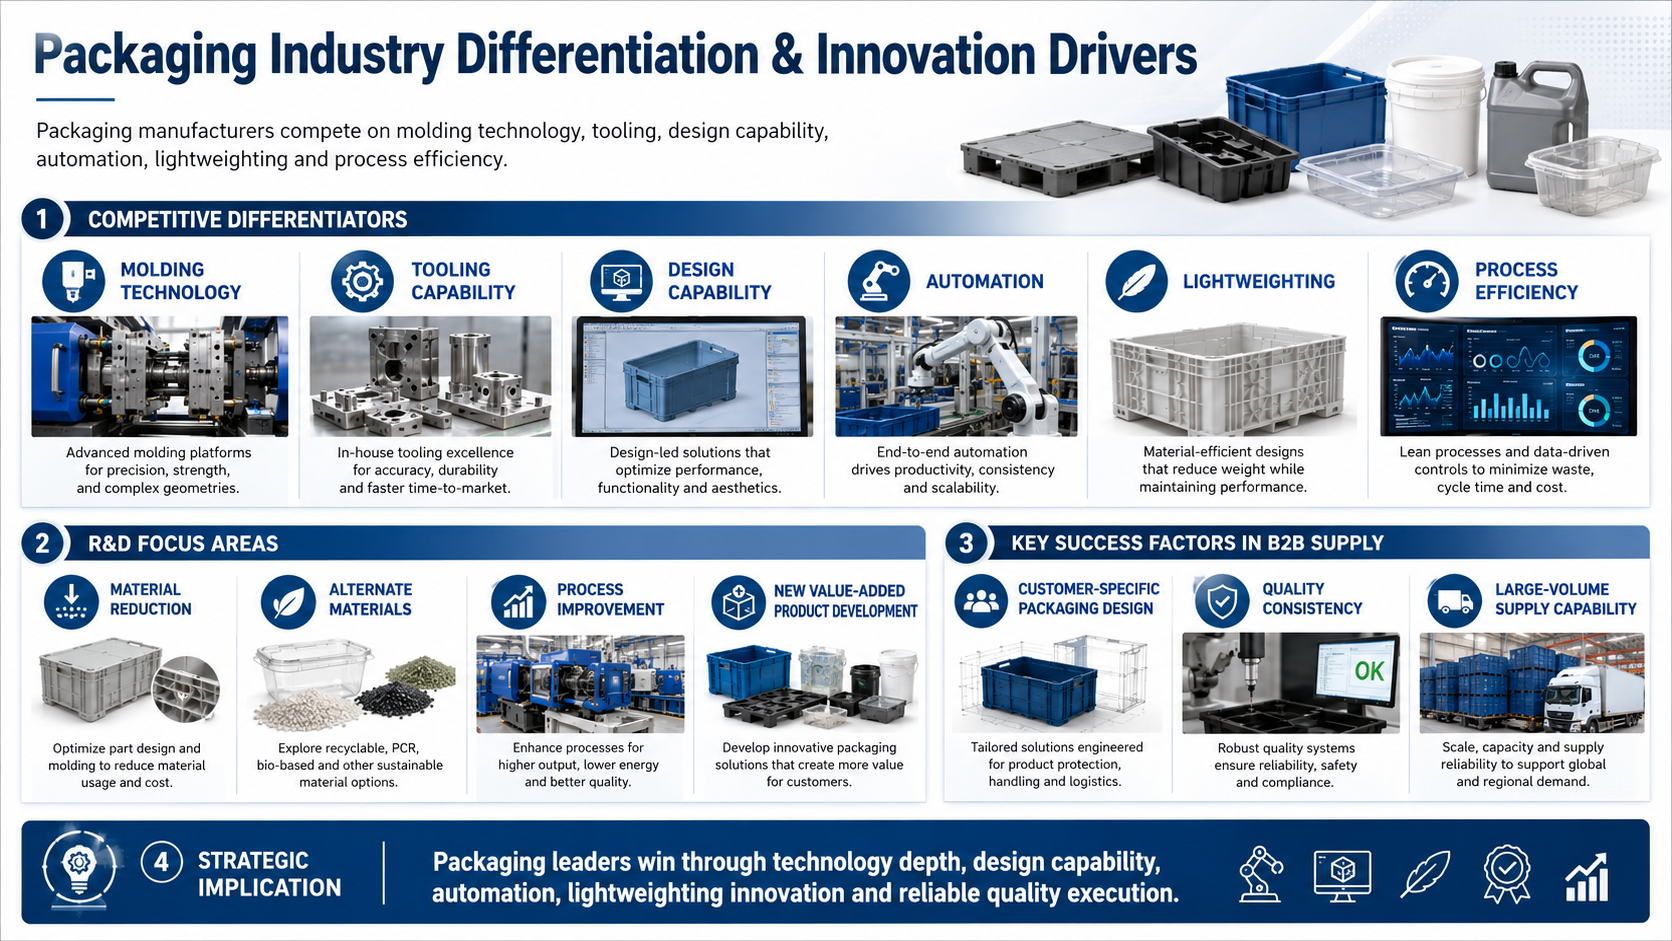
Expansion of Technological Capabilities
Packaging manufacturers compete on molding technology, tooling, design capability, automation, lightweighting and process efficiency
R&D is focused on material reduction, alternate materials, process improvement and new value-added product development
Customer-specific packaging design and quality consistency are key differentiators in large-volume B2B supply
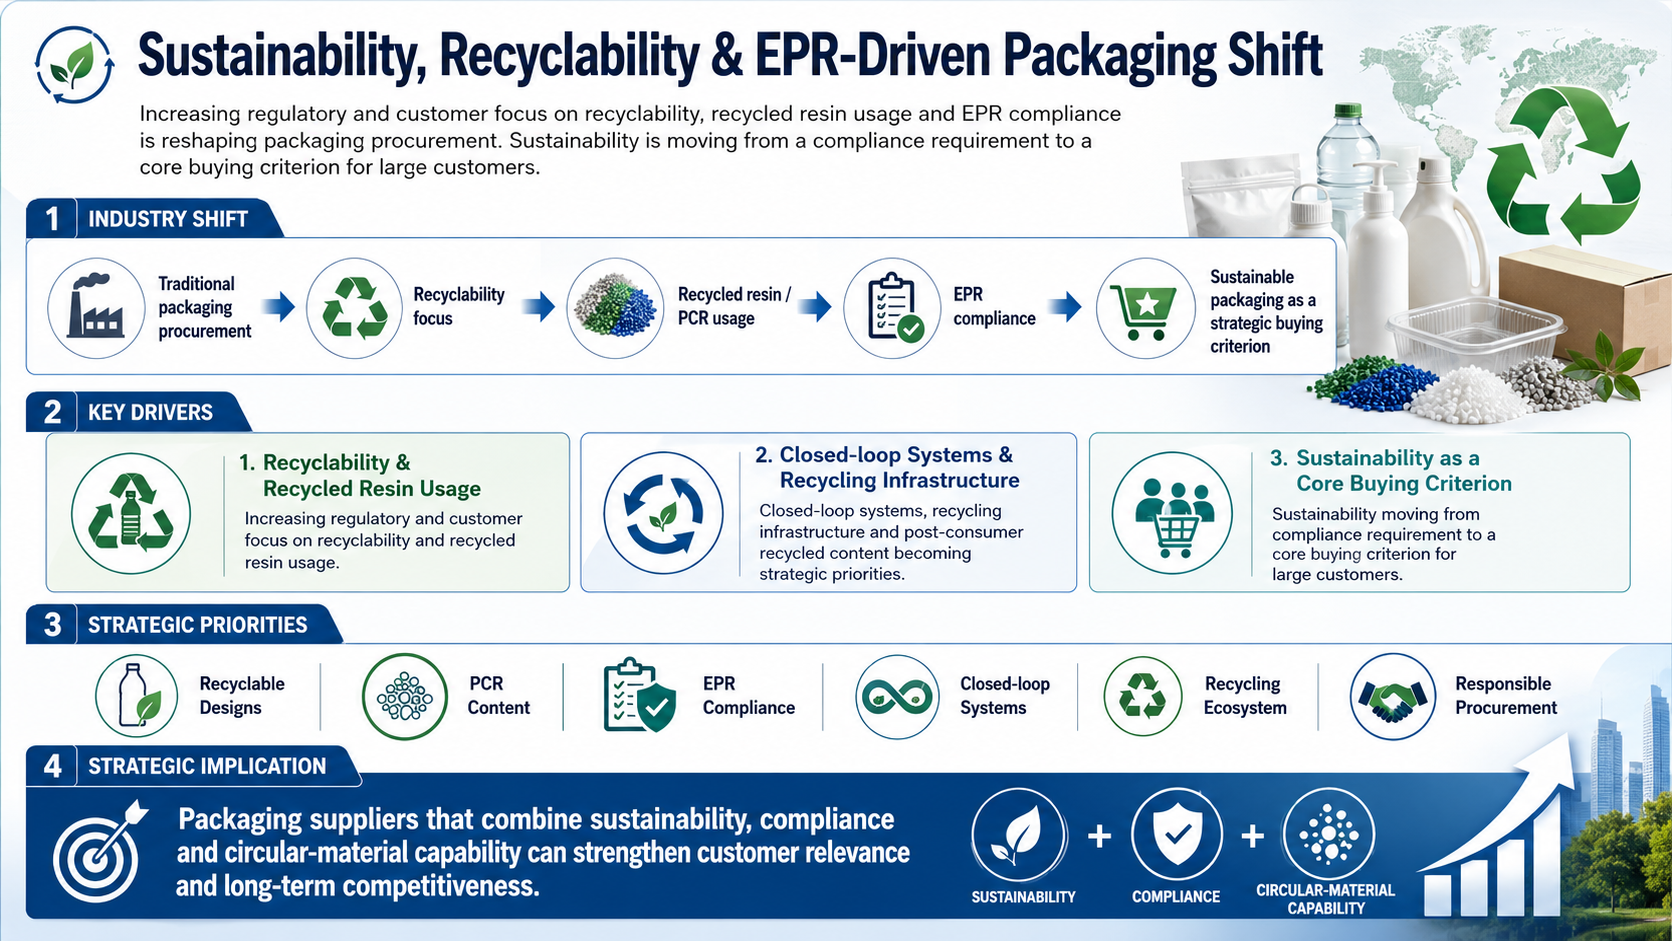
Sustainability and Circularity
Increasing regulatory and customer focus on recyclability, recycled resin usage and EPR compliance is reshaping packaging procurement
Closed-loop systems, recycling infrastructure and post-consumer recycled content are becoming strategic priorities
Sustainability is moving from a compliance requirement to a core buying criterion for large customers
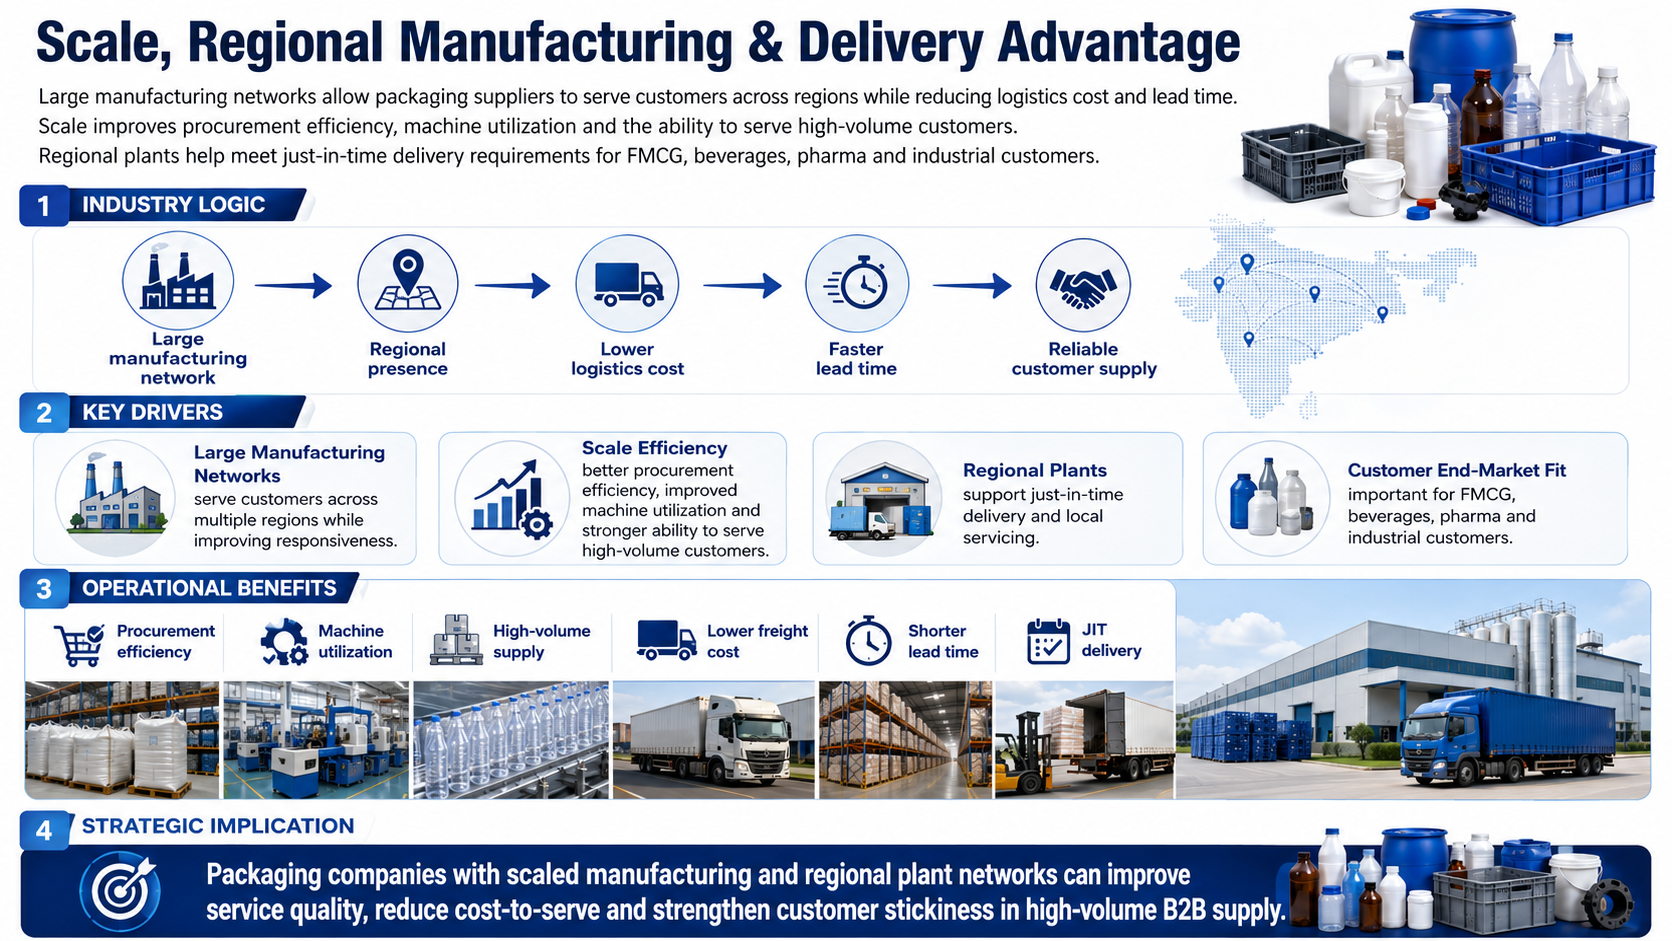
Manufacturing Scale and Customer Proximity
Large manufacturing networks allow packaging suppliers to serve customers across regions while reducing logistics cost and lead time
Scale improves procurement efficiency, machine utilization and ability to serve high-volume customers
Regional plants help meet just-in-time delivery requirements for FMCG, beverages, pharma and industrial customers
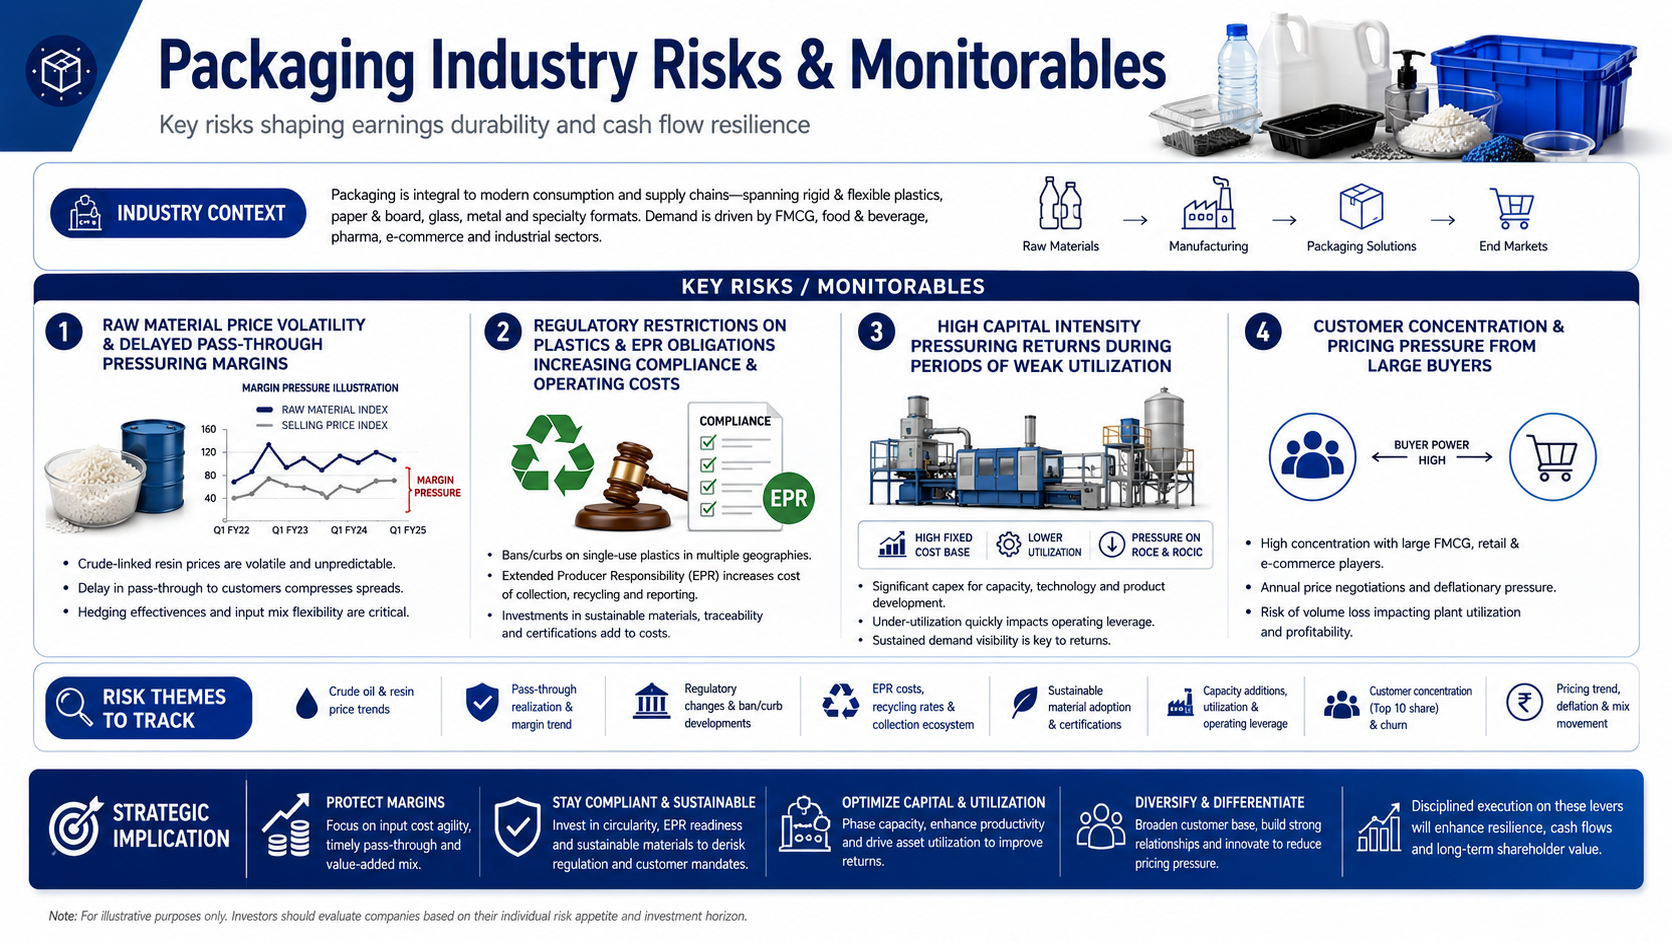
Risks in the Industry
Raw material price volatility can pressure margins if pass-through is delayed
Regulatory restrictions on plastics and EPR obligations may increase compliance and operating costs
High capital intensity can create pressure on returns during periods of weak utilization
Customer concentration and pricing pressure from large buyers are key monitorables
Government Policy Support
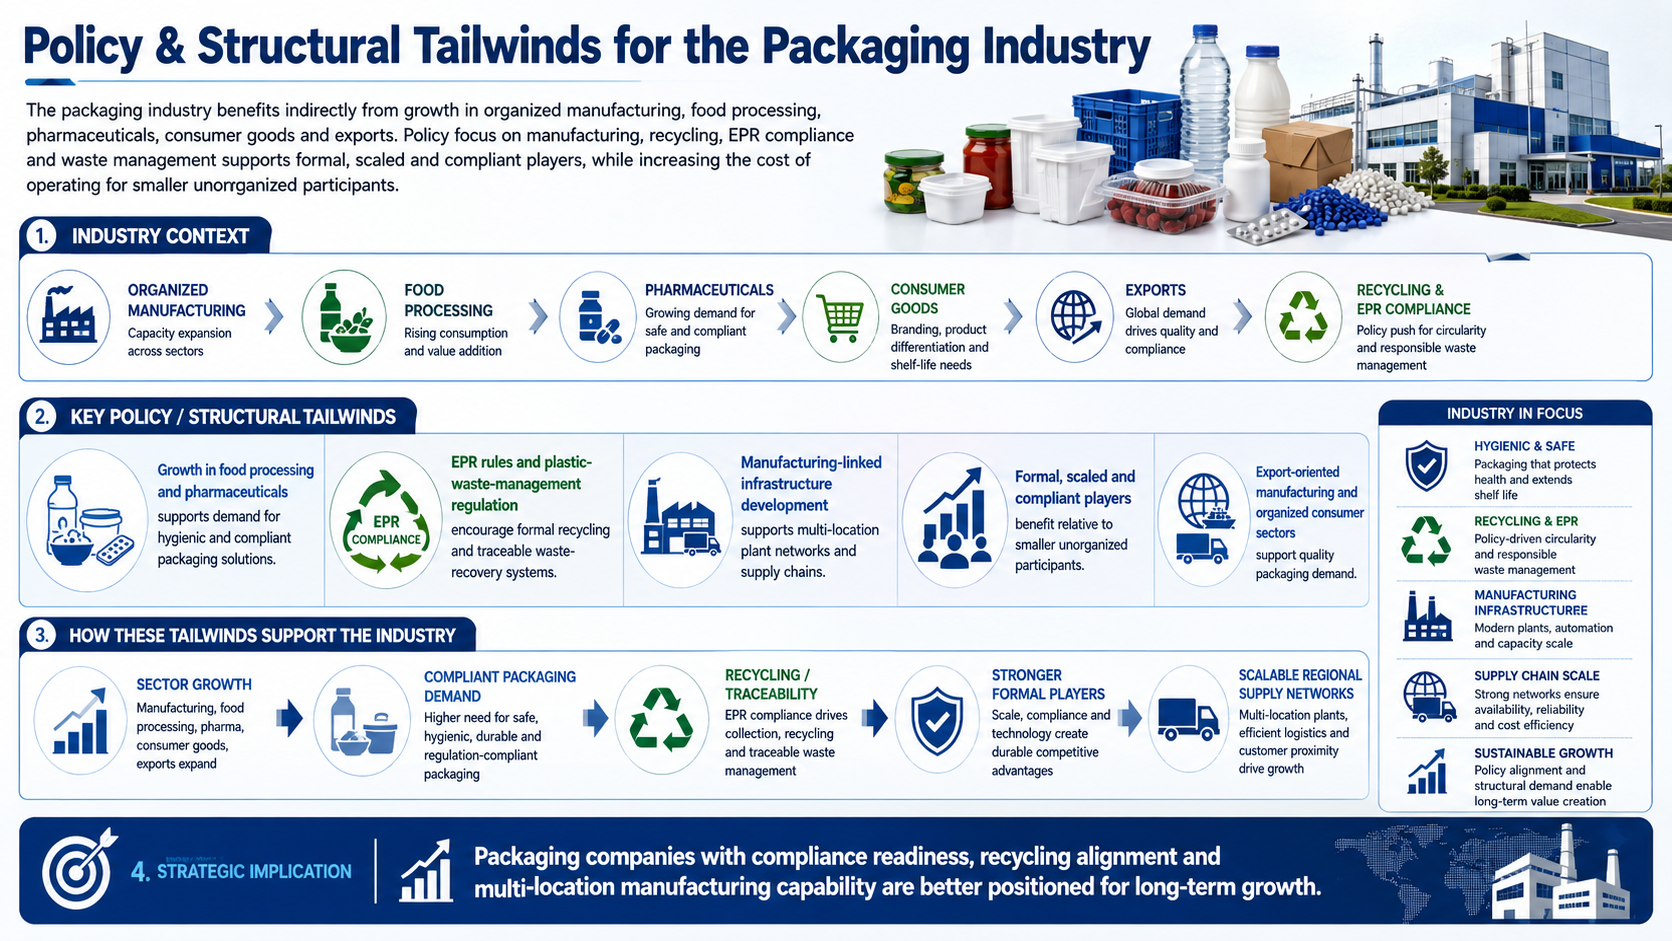
The packaging industry benefits indirectly from growth in organized manufacturing, food processing, pharmaceuticals, consumer goods and exports. Policy focus on manufacturing, recycling, EPR compliance and waste management can support formal, scaled and compliant players, while increasing the cost of operating for smaller unorganized participants.
Food processing and pharma sector growth support demand for hygienic and compliant packaging solutions
EPR rules and plastic waste management regulation encourage formal recycling and traceable waste recovery systems
Manufacturing-linked infrastructure development supports multi-location plant networks and supply chains
- Overview
- Business
- Financial Highlights
- Industry Overview
- Documentation
Get the Preqt App and keep in touch around the clock!
 Monitor your investments in real-time.
- Receive tailored deal suggestions.
- Get real-time updates and alerts.
