

Maverick Simulation Solutions
Simulating better healthcarePractice before patients
IPO Review and Rating
Conditional
Overall Recommendation
Maverick's headline FY25 financials are exceptionally strong: INR 136.3 Cr revenue, INR 64.2 Cr EBITDA, INR 47.8 Cr PAT, but FY24 was heavily restated during the transition to Ind AS. Previously reported PAT of roughly INR 19.9 Cr fell to only INR 0.9 Cr, principally because revenue had to be reversed under Ind AS 115. Moreover, cash conversion is poor, against INR 47.8 Cr PAT, FY25 CFO was negative INR 21.0 Cr. Trade receivables are already INR 105.4 Cr, with approximately INR 52.7 Cr due from related parties.
PARAMETER
WEIGHT
SCORE
KEY FACTORS
Financial Performance
25.0%
4.2/5
The key financial issue: Profit is not converting into cash
Show more
Detailed Analysis
Revenue increased from restated INR 14.2 Cr in FY24 to INR 136.3 Cr in FY25, implying 858.4% YoY growth
FY25 mechanical EBITDA was approximately INR 64.2 Cr, EBITDA margin was approximately 47.1%
FY25 PAT was INR 47.8 Cr, giving a very strong 35.1% PAT margin
FY25 reported analytical ROE is approximately 78.0%, versus approximately 7.0% in FY24
FY25 analytical D/E is 0.2x, versus 0.3x in FY24
Industry
25.0%
3.0/5
India's medical-simulation market is forecast to grow at 19.2% CAGR
Show more
Detailed Analysis
India's medical-simulation market was approximately USD 71.3 Mn in 2025 and is projected to reach USD 289.7 Mn by 2033, a 19.2% CAGR
India accounts for only about 3.7% of the global medical-simulation market, while adoption in medical education continues expanding
The market includes several established global players such as CAE, Laerdal, Simulab, Limbs & Things, Gaumard, Mentice and Surgical Science
Maverick generated just INR 0.03 Cr outside India in FY25 versus INR 136.3 Cr total revenue, meaning exports were effectively negligible
Management
25.0%
2.2/5
Total related-party sales were approximately 12.2% of FY25 revenue
Show more
Detailed Analysis
Founder & MD Anuj Chahal has 22 years of experience across product development, reverse engineering and sales
Co-founder Kanika Chahal has 20+ years of sales/marketing experience
The company has three directors: Anuj Chahal, Kanika Chahal and Sunil Tomar; none is identified as an Independent Director
No promoter-share pledge has been identified, but FY25 accounts contain ongoing GST matters and an income-tax matter highlighted by the auditor under Emphasis of Matter
Valuation Metrics
25.0%
3.2/5
The ordinary equity share capital is approximately INR 4.7 Cr, but the FY25 balance sheet additionally carries INR 0.2 Cr of instruments entirely equity in nature, i.e. CCPS
Show more
Detailed Analysis
P/E of 25.68x versus stated industry P/E of 35.00x implies a 26.6% discount
Estimated FY25 EV is approximately INR 1,242.6 Cr against EBITDA of INR 64.2 Cr, giving 19.4x EV/EBITDA
The Company trades at 12.7x P/B, which is extremely rich on the scoring framework
TOTAL
100%
3.1/5
Weighted Composite Score
Per Share Price
₹2600.0
As of 14 Oct 2026
Lot Size
50.0 Shares
Minimum Investment
₹1,30,000.0 / 50 shares
Market Cap. (₹ Cr)
Revenue FY’25
PAT FY’25
P/E Multiple
Face Value
₹ 10.0Lot Size
50.0 sharesPAT FY’25
₹ 47.8 CrPAT Margin (%)
35.1 %P/E Multiple
25.7xROE (FY’25)
78.0 %ROCE (FY’25)
59.4 %Price to Book Value ratio
12.7xDebt/Equity (FY’25)
0.2xMerchant banker appointed
❌ NoCompany Website
www.mavericksimulation.comDisclaimer: Unlisted shares are unregulated & illiquid. This is NOT investment advice. Please do your own due diligence before investing.
Minimum Investment
₹1,30,000.0 / 50 sharesShares Lot 50 X 1
Investment amount
₹1,30,000.0
Overview
Business
Products
Business Model
Geographical Presence
Sales Channel
Financial Highlights
Income Statement
Revenue growth with EBITDA and PAT margins
| Financial Metric | FY 2024 | FY 2025 |
|---|---|---|
| Revenue (₹ Cr) | 14.2 | 136.3 |
| Growth (%) | 0.0% | 858.4% |
| EBITDA (₹ Cr) | 1.4 | 64.2 |
| EBITDA Margin (%) | 10.1% | 47.1% |
| PAT (₹ Cr) | 0.9 | 47.8 |
| PAT Margin (%) | 6.6% | 35.1% |
OBSERVATIONS & INSIGHTS
Revenue increased from INR 14.2 Cr in FY24 to INR 136.3 Cr in FY25, an 858.4% increase. FY24 includes only a limited operating period after the December 2023 business transfer
FY25 EBITDA increased to approximately INR 64.2 Cr from INR 1.4 Cr in FY24, with margin expanding to 47.1%
PAT rose to INR 47.8 Cr in FY25, producing a 35.1% PAT margin. The FY25 profit conversion is strong at the P&L level, but this is not currently translating into positive operating cash flow
Balance Sheet
| Financial Metric | FY 2024 | FY 2025 |
|---|---|---|
| EQUITY & LIABILITIES | ₹ 87.1 Cr | ₹ 163.5 Cr |
| Net Worth | ₹ 25.6 Cr | ₹ 97.0 Cr |
| Share Capital | ₹ 4.8 Cr | ₹ 4.8 Cr |
| Reserves & Surplus | ₹ 20.8 Cr | ₹ 92.2 Cr |
| Total Liabilities | ₹ 61.5 Cr | ₹ 66.5 Cr |
| Current Liabilities | ₹ 61.5 Cr | ₹ 55.4 Cr |
| Borrowings | ₹ 7.8 Cr | ₹ 12.0 Cr |
| Trade Payables | ₹ 26.9 Cr | ₹ 17.8 Cr |
| Other Current Liabilities | ₹ 26.8 Cr | ₹ 25.6 Cr |
| Non-Current Liabilities | ₹ 0.0 Cr | ₹ 11.1 Cr |
| Borrowings | ₹ 0.0 Cr | ₹ 11.0 Cr |
| Other Non-Current Liabilities | ₹ 0.0 Cr | ₹ 0.1 Cr |
| ASSETS | ₹ 87.2 Cr | ₹ 163.4 Cr |
| Current Assets | ₹ 78.3 Cr | ₹ 155.9 Cr |
| Trade Receivables | ₹ 5.1 Cr | ₹ 105.4 Cr |
| Inventory | ₹ 38.2 Cr | ₹ 14.4 Cr |
| Cash & Cash Equivalents | ₹ 4.6 Cr | ₹ 8.4 Cr |
| Other Current Assets | ₹ 30.4 Cr | ₹ 27.7 Cr |
| Non-Current Assets | ₹ 8.9 Cr | ₹ 7.5 Cr |
| Fixed Assets | ₹ 0.5 Cr | ₹ 5.5 Cr |
| Other Non-Current Assets | ₹ 8.4 Cr | ₹ 2.0 Cr |
OBSERVATIONS & INSIGHTS
Total assets almost doubled from INR 87.2 Cr in FY24 to INR 163.4 Cr in FY25, driven mainly by the increase in trade receivables
Net worth increased from INR 25.6 Cr to INR 97.0 Cr through FY25 profits and equity-linked capital / securities premium, materially strengthening the reported solvency position
Total borrowings increased from INR 7.8 Cr to approximately INR 23.0 Cr. FY25 includes INR 11.0 Cr of non-current borrowings and INR 12.0 Cr of current borrowings
Property, plant and equipment increased from INR 0.5 Cr to INR 5.5 Cr, indicating investment in the physical operating base, but the balance sheet remains predominantly working-capital-led rather than fixed-asset-heavy
Trade receivables of INR 105.4 Cr represent approximately 64% of total assets at FY25 year-end. Asset quality is therefore heavily dependent on receivable recoverability and customer / related-party collection cycles
Contingent liabilities include GST matters linked to the predecessor business under the Business Transfer Agreement, which remain an important legal and cash-flow monitorable
Cash Flow
| Financial Metric | FY 2024 | FY 2025 |
|---|---|---|
CFO (₹ Cr) Cash generated from core business operations. | -20.4 Cr | -21.0 Cr |
CFI (₹ Cr) Cash used for investments and long-term assets. | -8.3 Cr | -11.3 Cr |
CFF (₹ Cr) Cash flow related to funding and borrowings. | +32.3 Cr | +36 Cr |
Working Capital
| Efficiency Metric | FY 2023 | FY 2024 | FY 2025 |
|---|---|---|---|
Debtor Days Average number of days taken to collect customer payments. | - | - | - |
Creditor Days Average time taken to pay suppliers and vendors. | - | - | - |
Inventory Days Average number of days inventory remains unsold. | - | - | - |
CCC (Cash Conversion Cycle) (Debtor Days + Inventory Days - Creditor Days) | - | - | - |
Financial Ratios
Measures the company’s leverage relative to shareholder equity.
OBSERVATIONS & INSIGHTS
FY25 ROE of 78.0% and ROA of 38.2% are exceptionally high, but both are amplified by the rapid scale-up from a low FY24 equity and asset base
Debt/equity improved from 0.3x in FY24 to 0.2x in FY25 even though absolute borrowings increased, because equity expanded materially through retained earnings and CCPS / securities-premium funding
Interest coverage improved to 22.6x in FY25, indicating that P&L-level debt service is comfortable at current profitability
The current ratio increased to 2.8x, but liquidity quality is weaker than the headline ratio suggests because a very large share of current assets is tied up in trade receivable
Industry Overview
Industry Drivers
Expansion of Technological Capabilities
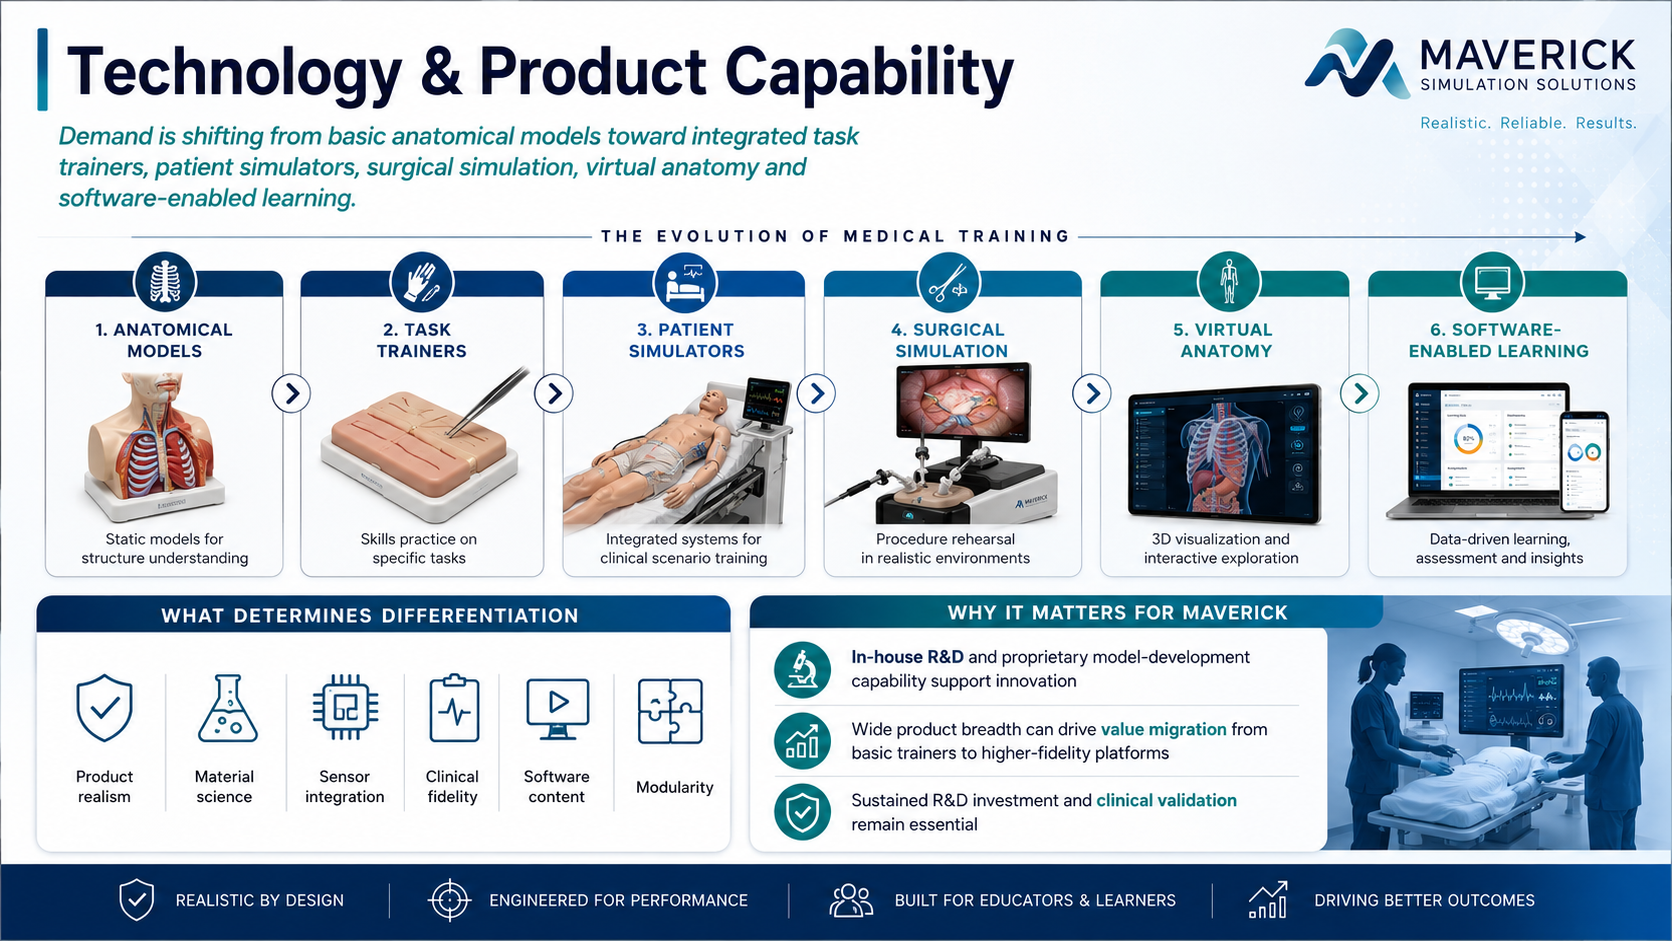
Demand is moving from basic anatomical models toward integrated task trainers, patient simulators, surgical simulation, virtual anatomy and software-enabled learning
Product realism, material science, sensor integration, clinical fidelity, software content and modularity increasingly determine differentiation
Maverick's in-house R&D, proprietary model-development capability and product breadth can support value migration from basic trainers to higher-fidelity platforms, but sustained R&D investment and clinical validation remain essential
Manufacturing Scale and Execution
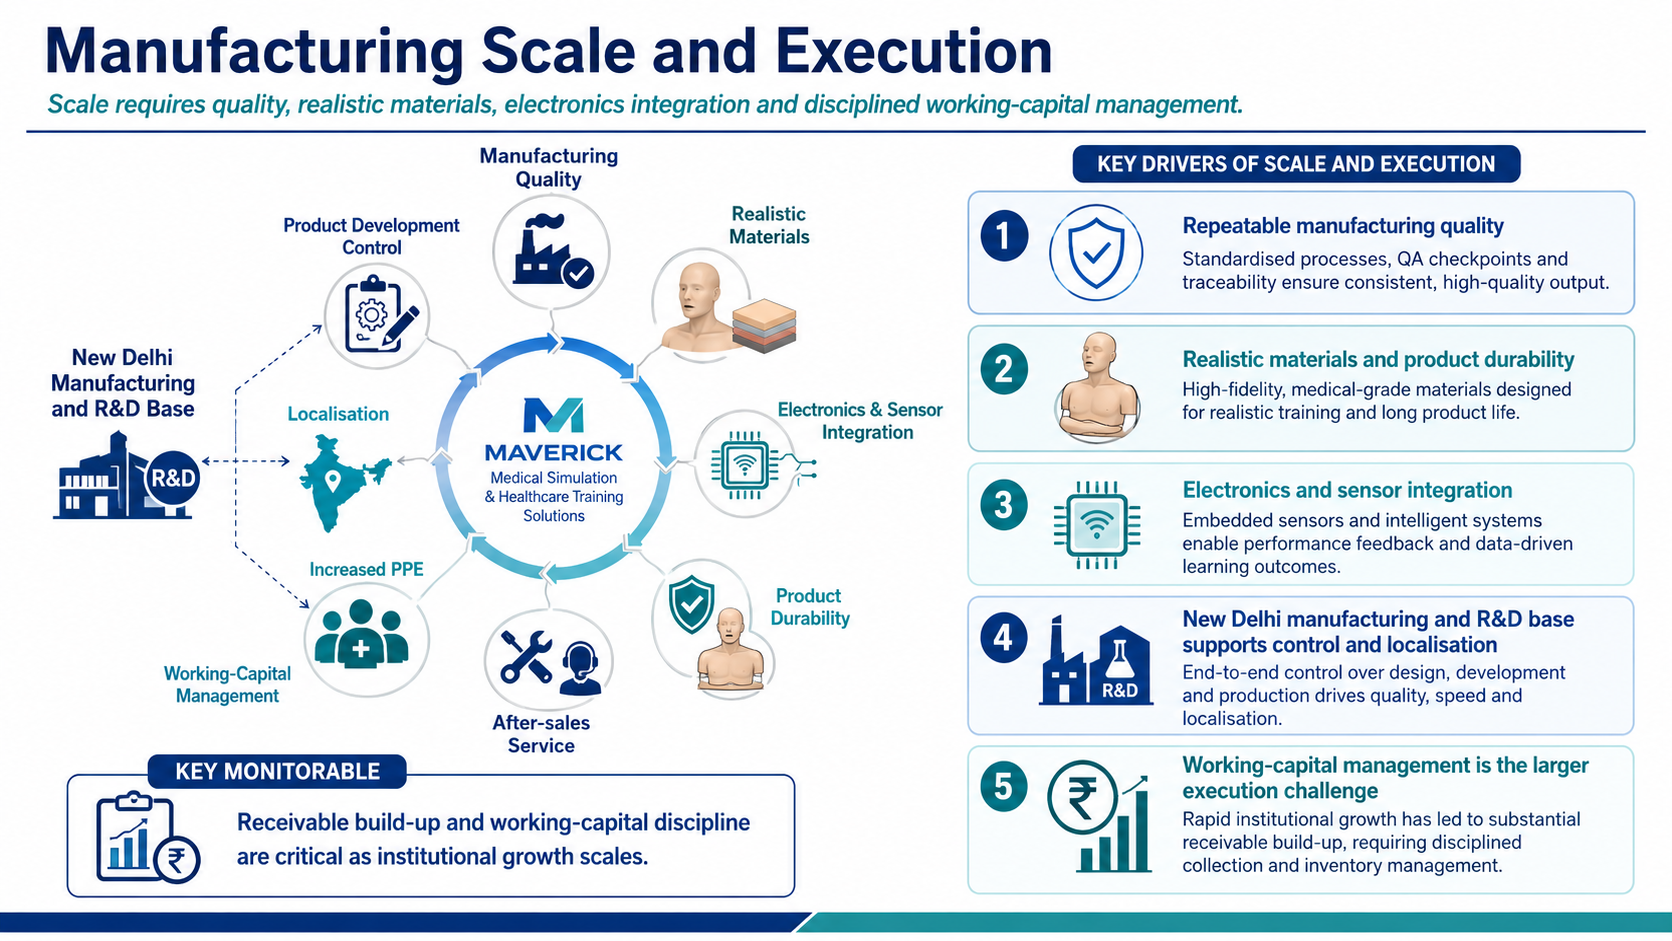
The sector requires repeatable manufacturing quality, realistic materials, electronics / sensor integration, product durability and reliable after-sales service
Maverick's New Delhi manufacturing and R&D base provides control over product development and localisation
The FY25 balance sheet shows increased PPE, but the larger execution challenge is working-capital management because rapid institutional growth has resulted in a substantial receivable build-up
Global Market Penetration
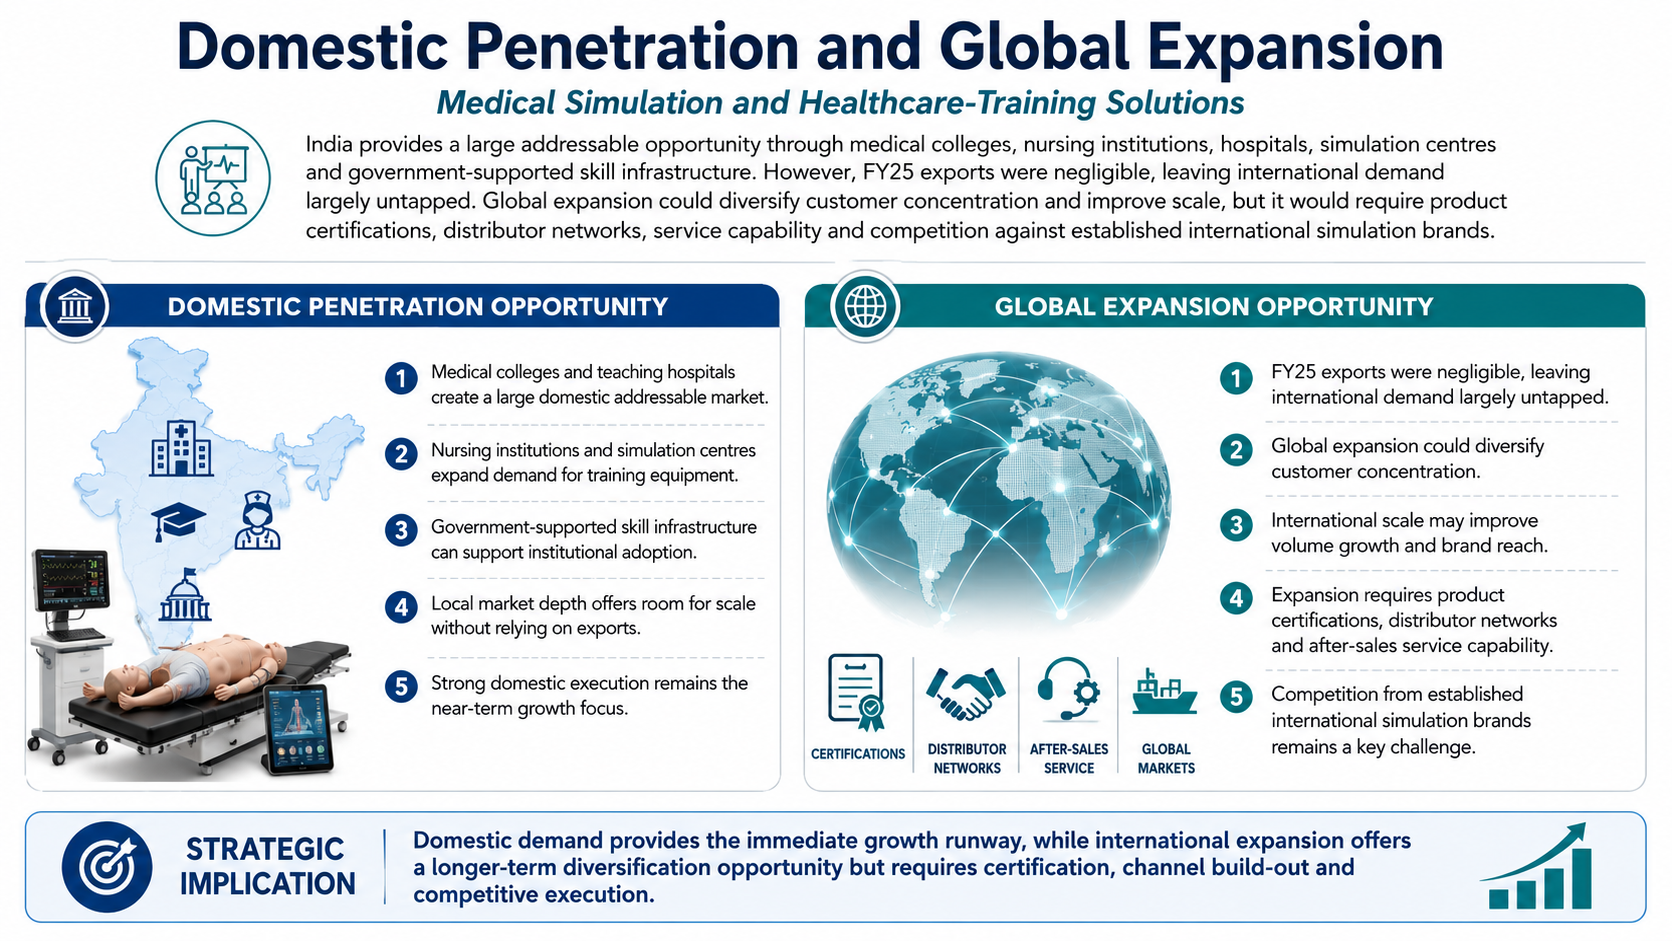
India provides a large addressable opportunity through medical colleges, nursing institutions, hospitals, simulation centres and government-supported skill infrastructure
However, FY25 exports were negligible, leaving international demand largely untapped
Global expansion could diversify customer concentration and improve scale, but it would require product certifications, distributor networks, service capability and competition against established international simulation brands
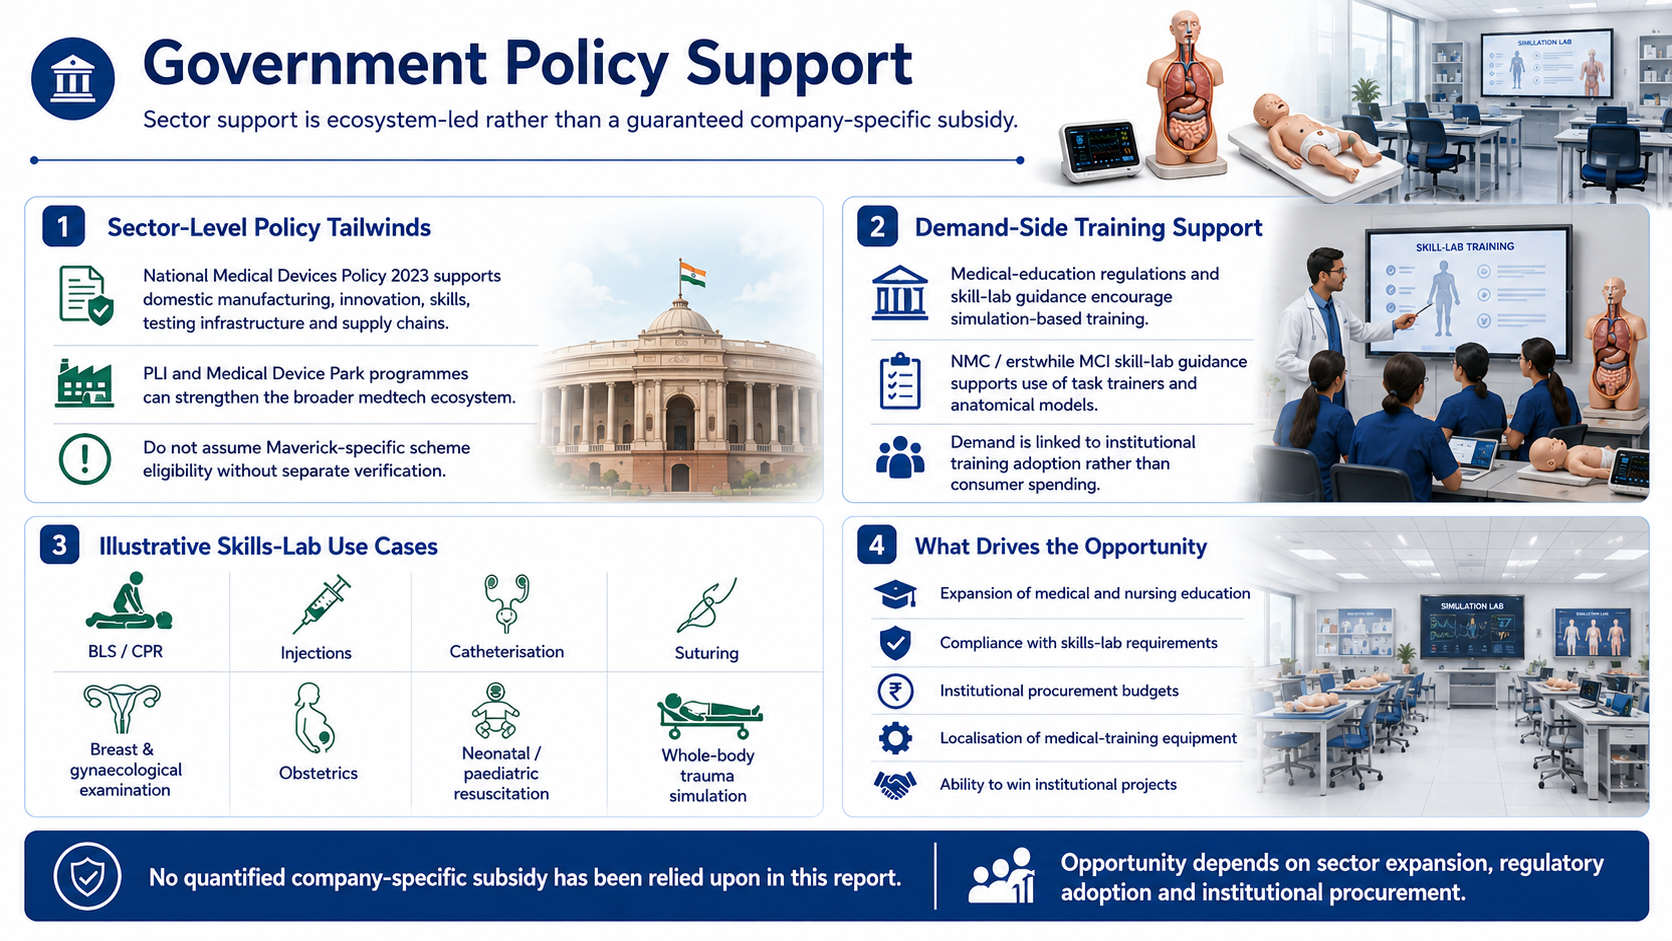
Government Policy Support
India's National Medical Devices Policy 2023 and related medical-device ecosystem schemes are intended to strengthen domestic manufacturing, innovation, skills, testing infrastructure and supply chains
PLI and Medical Device Park programmes can support the broader medtech ecosystem, although Maverick's specific product eligibility under individual schemes should not be assumed without separate verification
More directly relevant to demand, medical-education regulations and skill-lab guidance encourage simulation-based training
NMC / erstwhile MCI skill-lab guidance specifies task trainers and models for BLS / CPR, injections, catheterisation, suturing, breast and gynaecological examination, obstetrics, neonatal / paediatric resuscitation and whole-body trauma simulation. This creates a structural institutional use case for the type of products manufactured by the company
- Overview
- Business
- Financial Highlights
- Industry Overview
- Documentation
Get the Preqt App and keep in touch around the clock!
 Monitor your investments in real-time.
- Receive tailored deal suggestions.
- Get real-time updates and alerts.
