


Mohan Meakin
Legacy in Every PourCrafting Timeless Spirits
IPO Review and Rating
Considerable
Overall Recommendation
At approximately INR 2,400 per share, Mohan Meakin offers a compelling 13.0x P/E and 8.8x EV/EBITDA, supported by strong ROE, negligible debt, improving operating cash flow and established brands such as Old Monk. However, revenue growth remains moderate, the operating margin is below 10%, state-level regulation is severe, and related-party purchases approaching half of revenue represent the principal governance concern
PARAMETER
WEIGHT
SCORE
KEY FACTORS
Financial Performance
25.0%
3.5/5
Strong profitability, debt-free balance sheet and robust cash generation offset moderate revenue growth and an operating margin below 10%
Show more
Detailed Analysis
Revenue increased from INR 1,929.9 crore in FY24 to INR 2,302.4 crore in FY26-a moderate 9.2% CAGR
Operating EBITDA was approximately INR 187.6 crore, producing an 8.1% margin after excluding other income and exceptional items
FY26 PAT of INR 156.7 crore represented a healthy 6.8% margin on reported revenue
Borrowings were only INR 4.3 crore against INR 626.1 crore equity, resulting in negligible 0.01x leverage
PAT on average FY25-FY26 equity produced an excellent ROE of approximately 28.6%
Industry
25.0%
2.2/5
Premiumisation and demographics support growth, but state regulation, intense competition and modest export dependence limit overall attractiveness
Show more
Detailed Analysis
Alcobev manufacturers delivered approximately 13% three-year revenue CAGR, although FY26 growth moderated toward 8-10%
Premiumisation, urbanisation, higher incomes and favourable demographics place branded alcoholic beverages in the growth stage
State-specific excise duties, licensing, distribution restrictions, price controls and advertising limitations create substantial regulatory exposure
The Company exports to 14 countries, but FY25 foreign-exchange earnings represented only approximately 4.0% of revenue
Management
25.0%
3.0/5
Long promoter experience and adequate board independence are offset by substantial related-party procurement and ordinary-course legal exposures
Show more
Detailed Analysis
The business traces its history to 1855 and has several decades of operating and brand-building experience
Three of eight directors were independent, representing 37.5%
No promoter pledge was identified, but a INR 5.6 crore of excise, few tax, employee and supplier claims
FY25 purchases from Mohan Rocky Springwater Breweries were INR 1,069.5 crore-approximately 49.7% of revenue
Valuation Metrics
25.0%
3.9/5
Low earnings and enterprise multiples provide substantial peer discounts, while moderate book valuation and unlisted liquidity remain considerations
Show more
Detailed Analysis
The 13.02x P/E represents a 56.6% discount to the supplied industry multiple of 30x
Adjusted for liquid investments and cash, implied EV/EBITDA is approximately 8.8x-substantially below listed peers
The company is valued at a P/B multiple of 3.3
TOTAL
100%
3.1/5
Weighted Composite Score
Per Share Price
₹2200.0
As of 14 Oct 2026
Lot Size
10.0 Shares
Minimum Investment
₹22,000.0 / 10 shares
Market Cap. (₹ Cr)
Revenue FY’26
PAT FY’26
P/E Multiple
Face Value
₹ 5.0Lot Size
10.0 sharesPAT FY’26
₹ 156.7 CrPAT Margin (%)
6.8 %P/E Multiple
13.0xCAGR Growth 3Y
9.2 %ROE (FY’26)
28.6 %ROCE (FY’26)
38.0 %Price to Book Value ratio
3.3xDebt/Equity (FY’26)
0.0xMerchant banker appointed
❌ NoCompany Website
mohanmeakin.comDisclaimer: Unlisted shares are unregulated & illiquid. This is NOT investment advice. Please do your own due diligence before investing.
Minimum Investment
₹22,000.0 / 10 sharesShares Lot 10 X 1
Investment amount
₹22,000.0
Overview
Business
Products
Business Model
Geographical Presence
Sales Channel
Financial Highlights
Income Statement
Revenue growth with EBITDA and PAT margins
| Financial Metric | FY 2024 | FY 2025 | FY 2026 |
|---|---|---|---|
| Revenue (₹ Cr) | 1,929.9 | 2,151.3 | 2,302.4 |
| Growth (%) | 9.0% | 11.5% | 7.0% |
| EBITDA (₹ Cr) | 111.3 | 133.6 | 189.3 |
| EBITDA Margin (%) | 5.8% | 6.2% | 8.2% |
| PAT (₹ Cr) | 84.7 | 102.6 | 156.8 |
| PAT Margin (%) | 0.0% | - | - |
OBSERVATIONS & INSIGHTS
Revenue increased at a 9.2% CAGR from FY24 to FY26, although annual growth moderated to 7.0% in FY26
EBITDA grew 41.7% and margin expanded by 2.0 percentage points in FY26, supported by improved segment profitability and operating scale
PAT rose 52.7% to ₹156.8 Cr and PAT margin increased to 6.8%, while EPS advanced proportionately to ₹184.2
Alcoholic products generated 99.3% of FY26 segment revenue, leaving the Company highly exposed to alcohol regulation and category demand
Balance Sheet
| Financial Metric | FY 2024 | FY 2025 | FY 2026 |
|---|---|---|---|
| EQUITY & LIABILITIES | ₹ 534.8 Cr | ₹ 652.1 Cr | ₹ 814.0 Cr |
| Net Worth | ₹ 366.4 Cr | ₹ 470.2 Cr | ₹ 626.2 Cr |
| Share Capital | ₹ 4.3 Cr | ₹ 4.3 Cr | ₹ 4.3 Cr |
| Reserves & Surplus | ₹ 362.1 Cr | ₹ 465.9 Cr | ₹ 621.9 Cr |
| Total Liabilities | ₹ 168.4 Cr | ₹ 181.9 Cr | ₹ 187.8 Cr |
| Current Liabilities | ₹ 152.6 Cr | ₹ 166.7 Cr | ₹ 174.0 Cr |
| Borrowings | ₹ 4.3 Cr | ₹ 4.3 Cr | ₹ 4.3 Cr |
| Trade Payables | ₹ 96.3 Cr | ₹ 105.6 Cr | ₹ 116.7 Cr |
| Other Current Liabilities | ₹ 52.0 Cr | ₹ 56.8 Cr | ₹ 53.0 Cr |
| Non-Current Liabilities | ₹ 15.8 Cr | ₹ 15.2 Cr | ₹ 13.8 Cr |
| Borrowings | ₹ 0.0 Cr | ₹ 0.0 Cr | ₹ 0.0 Cr |
| Other Non-Current Liabilities | ₹ 15.8 Cr | ₹ 15.2 Cr | ₹ 13.8 Cr |
| ASSETS | ₹ 534.8 Cr | ₹ 651.8 Cr | ₹ 814.0 Cr |
| Current Assets | ₹ 333.3 Cr | ₹ 512.2 Cr | ₹ 670.0 Cr |
| Trade Receivables | ₹ 114.2 Cr | ₹ 112.1 Cr | ₹ 82.3 Cr |
| Inventory | ₹ 132.4 Cr | ₹ 150.5 Cr | ₹ 161.3 Cr |
| Cash & Cash Equivalents | ₹ 17.5 Cr | ₹ 23.7 Cr | ₹ 19.9 Cr |
| Other Current Assets | ₹ 69.2 Cr | ₹ 225.9 Cr | ₹ 406.5 Cr |
| Non-Current Assets | ₹ 201.5 Cr | ₹ 139.6 Cr | ₹ 144.0 Cr |
| Fixed Assets | ₹ 96.8 Cr | ₹ 103.4 Cr | ₹ 110.4 Cr |
| Other Non-Current Assets | ₹ 104.7 Cr | ₹ 36.2 Cr | ₹ 33.6 Cr |
OBSERVATIONS & INSIGHTS
Shareholders' wealth increased by ₹259.8 Cr from FY24 to FY26, supported mainly by retained profits and other comprehensive income
Current borrowings stayed at ₹4.3 Cr and no non-current borrowing was reported, leaving the balance sheet effectively debt-free
Other current assets increased to ₹406.5 Cr because of bank deposits, current investments and other financial assets, while receivables declined
Fixed assets increased by ₹13.6 Cr over two years, indicating that earnings growth did not require a proportionate expansion in owned production assets
Cash Flow
| Financial Metric | FY 2024 | FY 2025 | FY 2026 |
|---|---|---|---|
CFO (₹ Cr) Cash generated from core business operations. | +66.7 Cr | +96.5 Cr | +167.8 Cr |
CFI (₹ Cr) Cash used for investments and long-term assets. | -70.9 Cr | -89.5 Cr | -170.2 Cr |
CFF (₹ Cr) Cash flow related to funding and borrowings. | -0.8 Cr | -0.8 Cr | -1.3 Cr |
Financial Ratios
Measures the company’s leverage relative to shareholder equity.
OBSERVATIONS & INSIGHTS
FY26 ROE reached 28.6%, ROA reached 21.4% and analytical ROCE reached 38.0% after the sharp rise in operating profit
Debt / equity rounds to 0.0x and interest coverage increased to 268.3x, indicating that financial leverage is not a material earnings constraint
The current ratio rose from 2.2x to 3.8x as cash, bank deposits and liquid investments accumulated
The ratio profile is strong, but earnings remain exposed to excise policies, price approvals, channel controls and raw-material inflation
Industry Overview
Industry Drivers
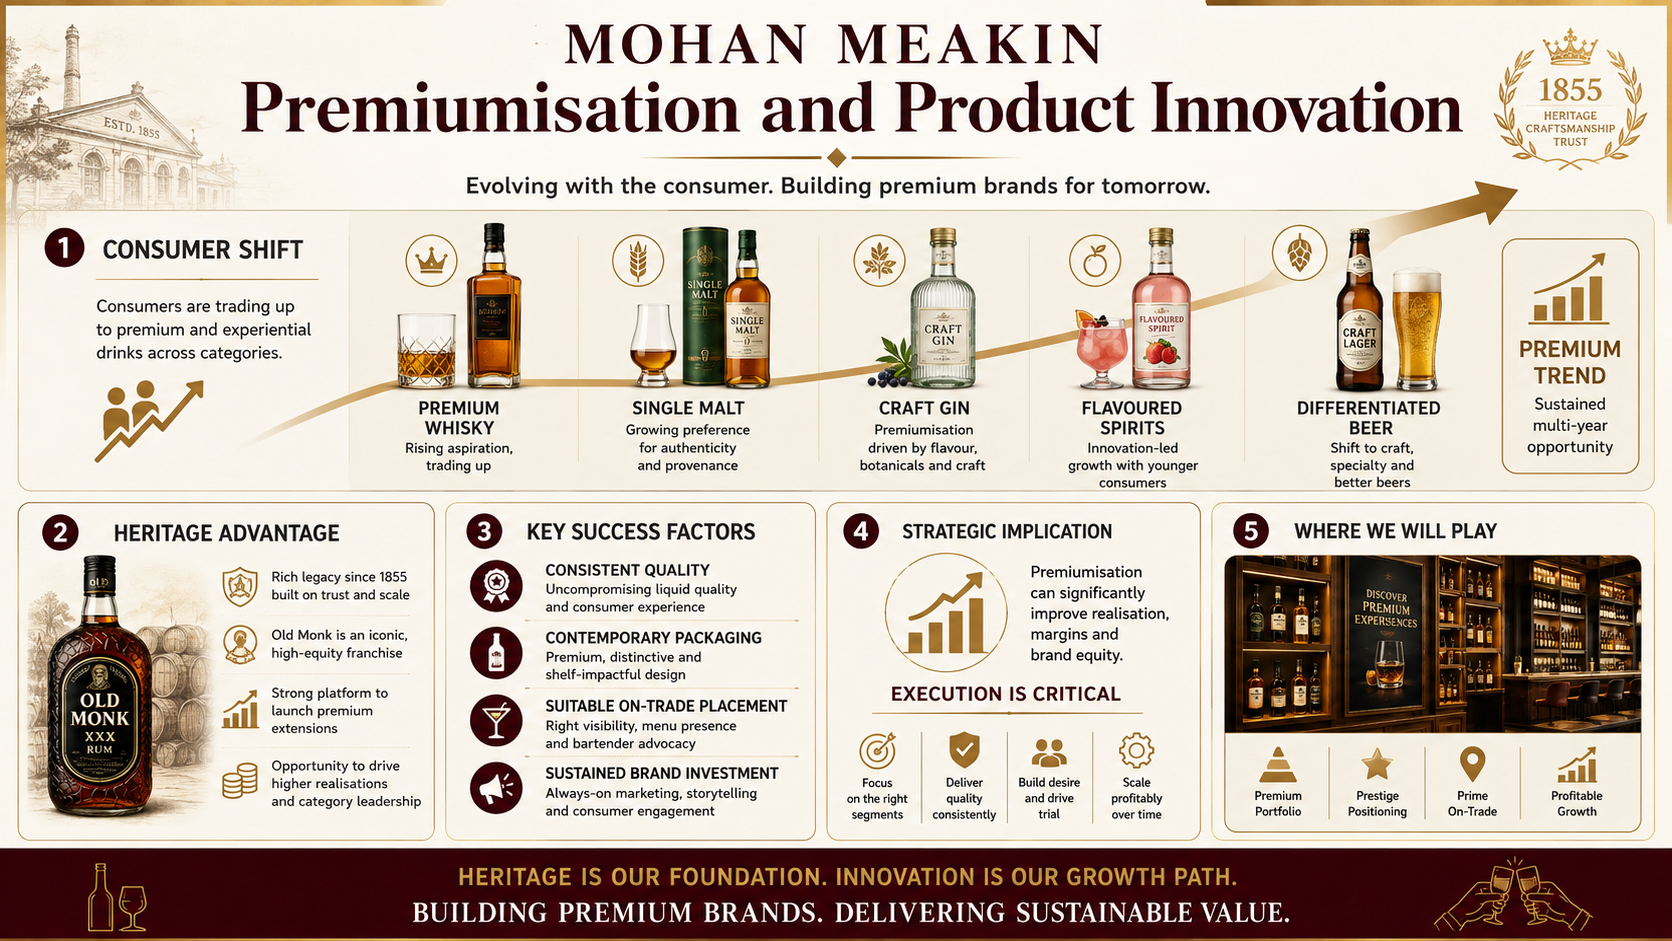
Premiumisation and Product Innovation
Consumers are gradually shifting toward premium whisky, single malt, craft gin, flavoured spirits and differentiated beer
Mohan Meakin can use its heritage and Old Monk franchise to launch higher-realisation products, but premium success requires consistent quality, contemporary packaging, suitable on-trade placement and sustained brand investment
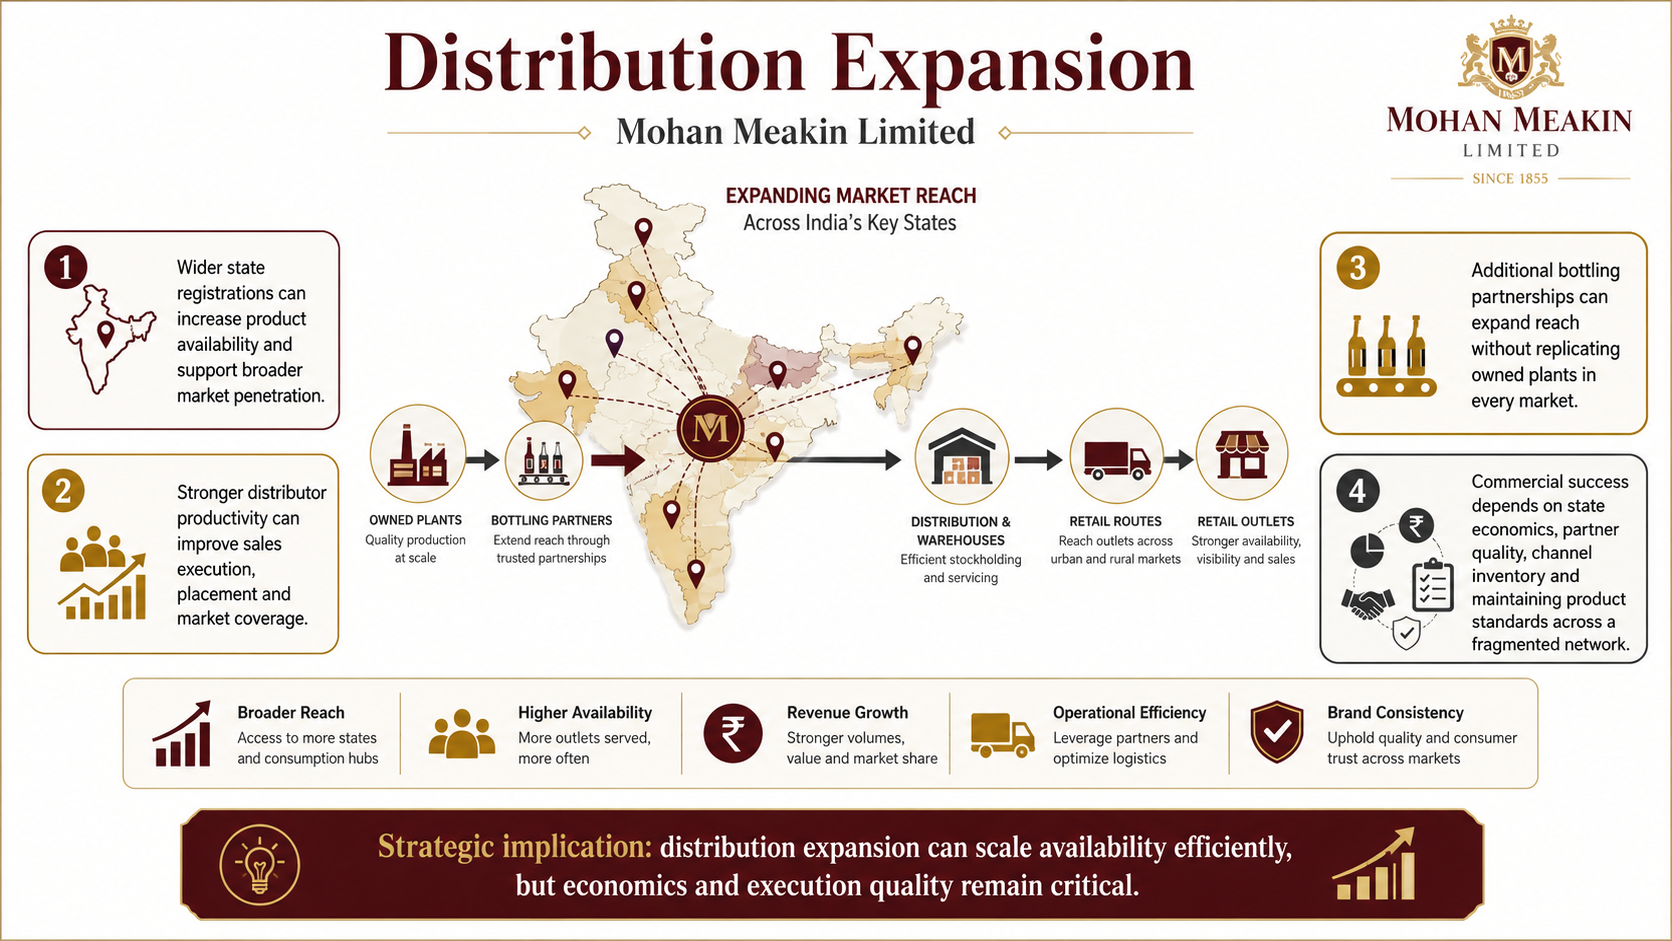
Distribution Expansion
Wider state registrations, stronger distributor productivity and additional bottling partnerships can increase availability without replicating owned plants in every market
The commercial benefit depends on state economics, partner quality, channel inventory and the company's ability to maintain product standards across a fragmented network
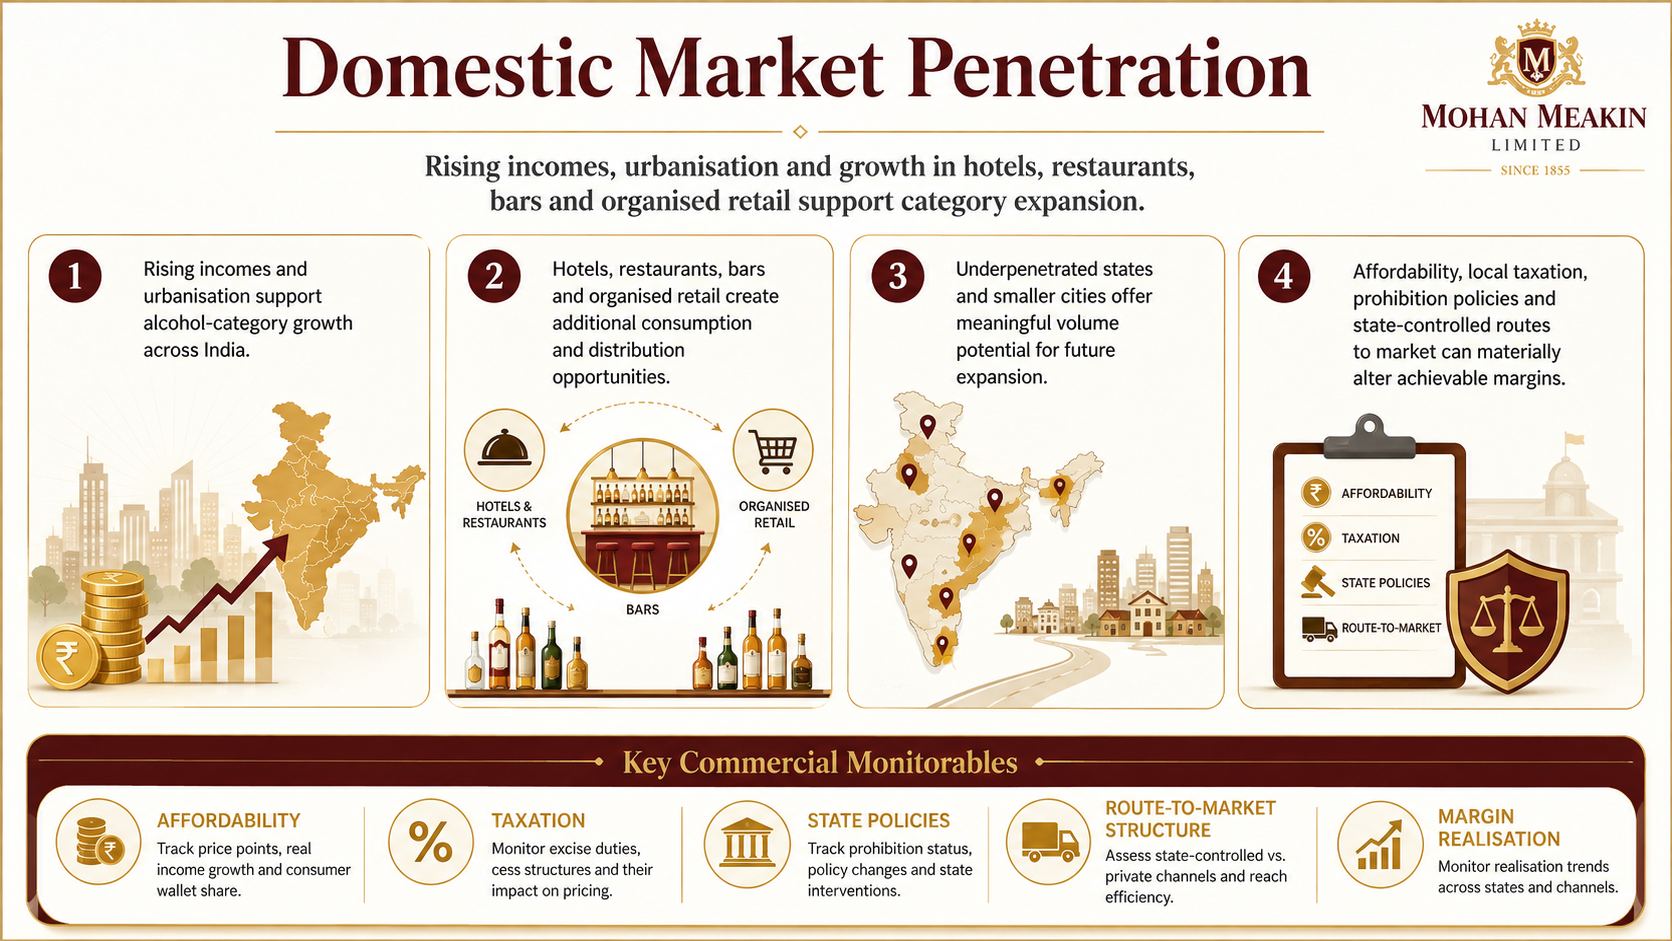
Domestic Market Penetration
Rising incomes, urbanisation and growth in hotels, restaurants, bars and organised retail support category expansion
Underpenetrated states and smaller cities offer volume potential, although affordability, local taxation, prohibition policies and state-controlled routes to market can materially alter achievable margins
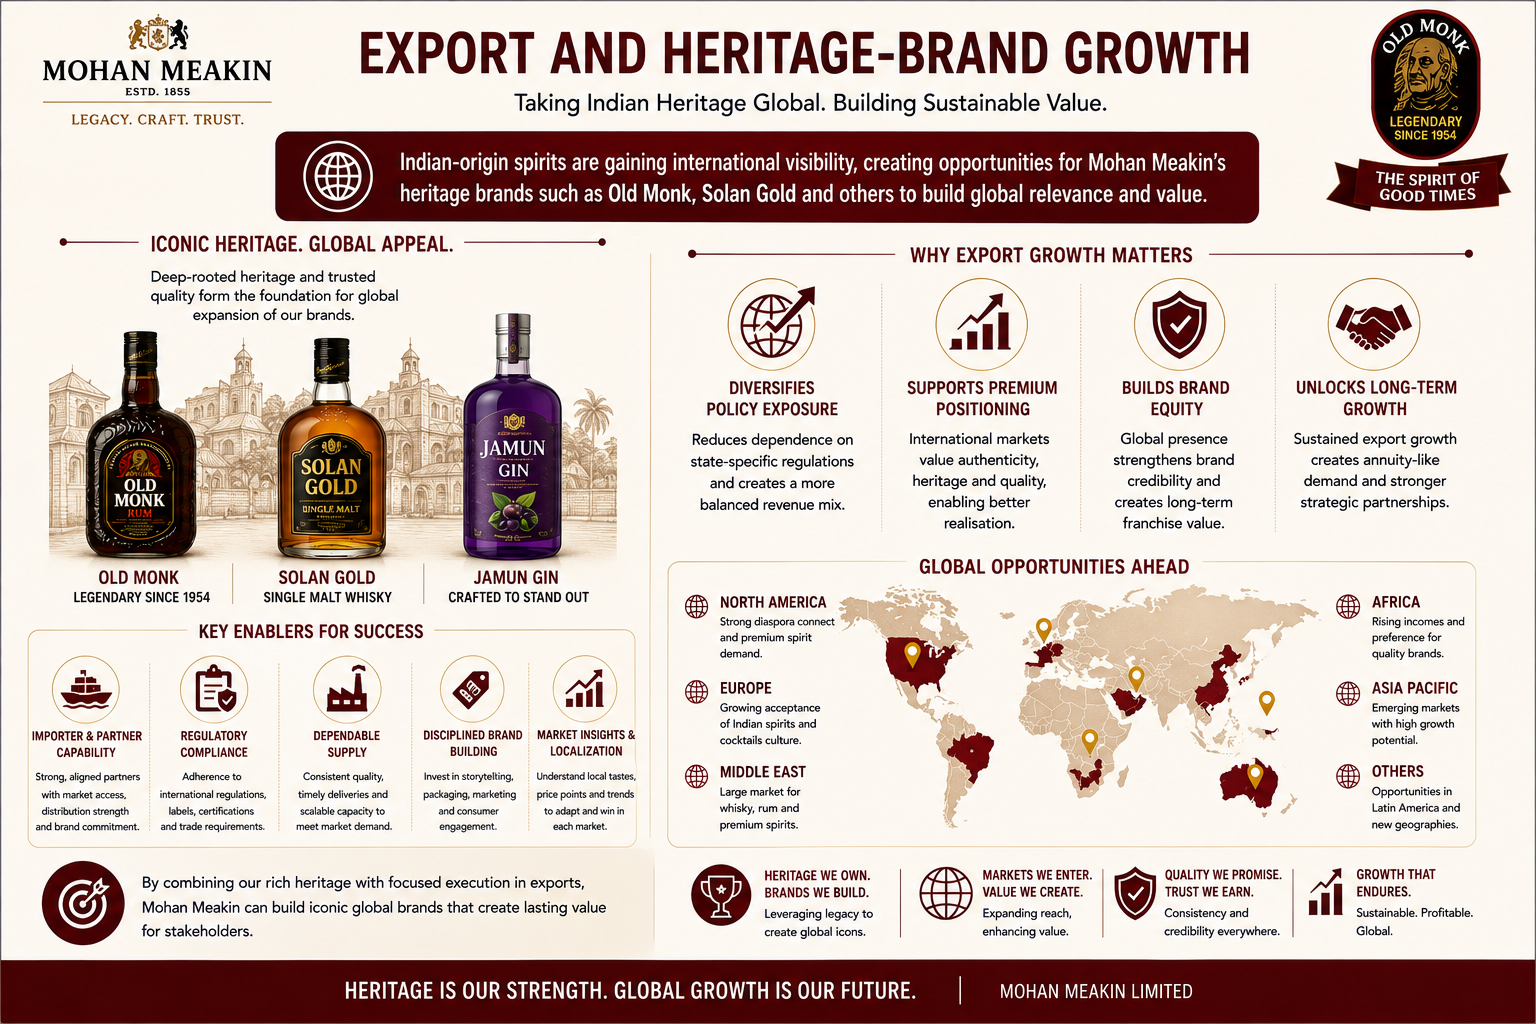
Export and Heritage-Brand Growth
Indian-origin spirits are gaining international visibility, creating opportunities for Old Monk, Solan Gold and other heritage brands
Export growth can diversify state-policy exposure and support premium positioning, but it requires importer capability, regulatory compliance, dependable supply and disciplined brand building in each destination
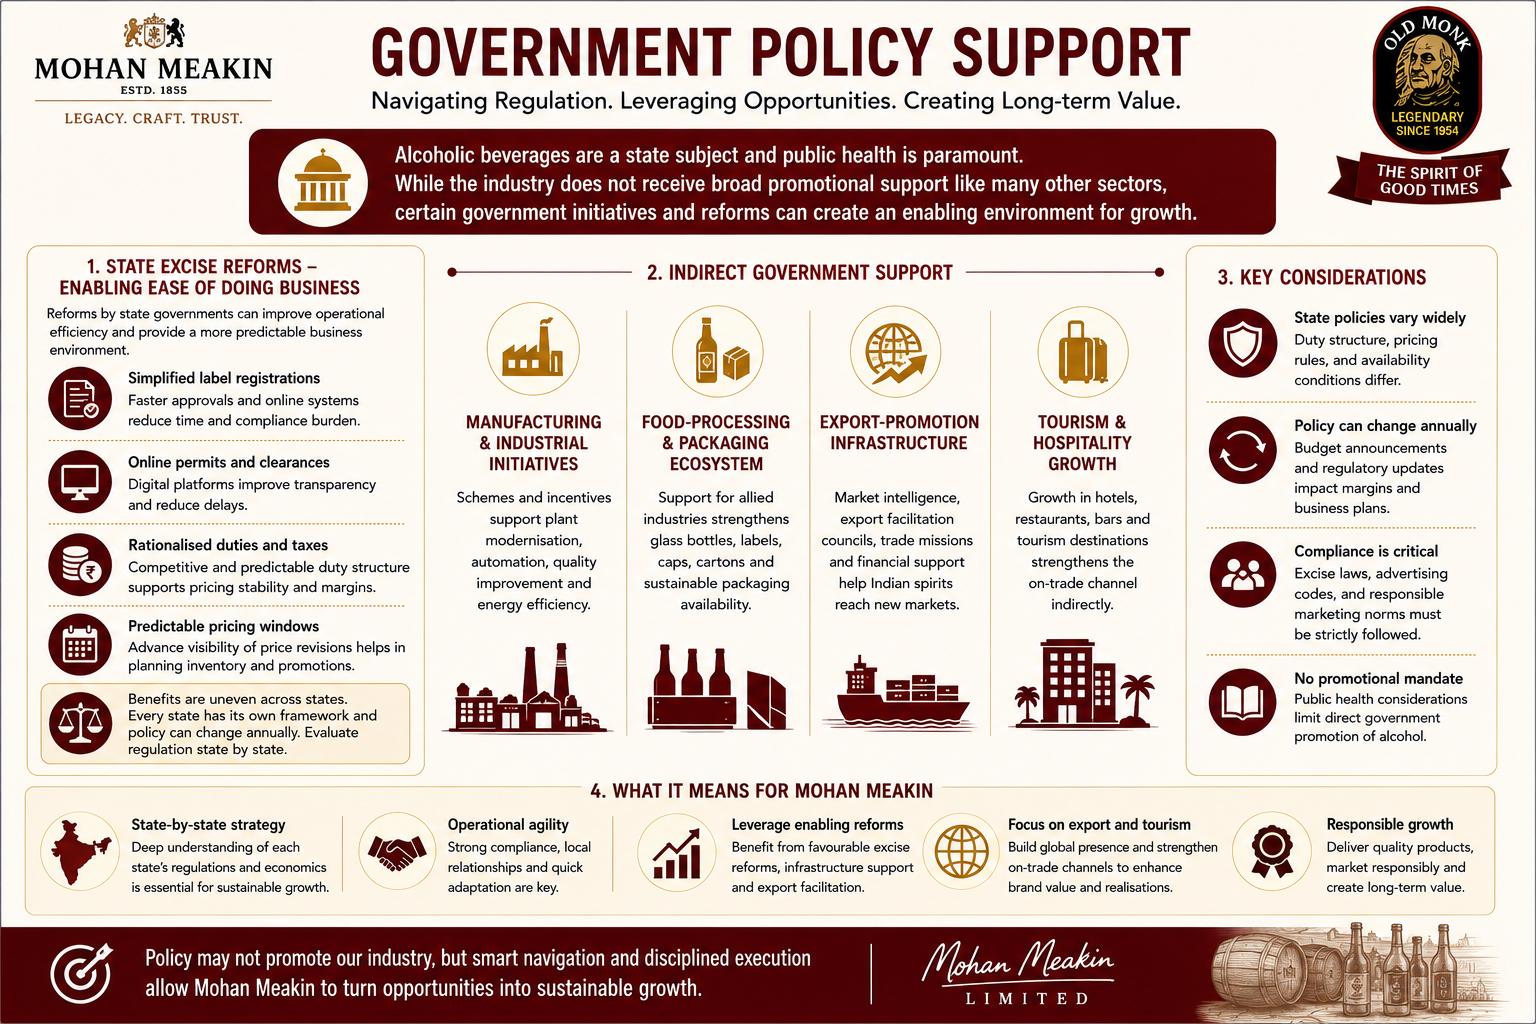
Government Policy Support
The alcoholic-beverage industry does not receive the broad promotional support available to many manufacturing sectors because alcohol is a state subject and public-health considerations shape policy
Nevertheless, general manufacturing, food-processing, export and logistics initiatives can support plant modernisation, packaging ecosystems, energy efficiency and overseas market development
State excise reforms can improve ease of doing business when they simplify label registration, enable online permits, rationalise duties or provide predictable pricing windows
The benefit is uneven because every state has its own framework and policy can change annually
Investors should therefore evaluate regulation state by state rather than assume a uniform national market
Export-promotion infrastructure and trade facilitation can help Indian spirits reach new markets, while tourism and hospitality growth can strengthen the on-trade channel
These are indirect benefits and do not remove import-country taxes, distributor requirements, product standards or responsible marketing obligations
- Overview
- Business
- Financial Highlights
- Industry Overview
- Documentation
Get the Preqt App and keep in touch around the clock!
 Monitor your investments in real-time.
- Receive tailored deal suggestions.
- Get real-time updates and alerts.
