


Moneyview
Credit Made SimpleEmpowering Financial Access
IPO Summary (PreQT)
Moneyview Limited is a consumer-focused, digital-only financial-services platform serving India’s “Middle India” segment. The platform connects consumers with banks, NBFCs, insurers and other regulated financial institutions through a mobile-first interface, while its material subsidiary Whizdm Finance Private Limited (“WFPL”) also originates loans on its own balance sheet. The product suite spans personal loans, credit cards, home loans, loans against property, earned wage access, insurance, digital gold, fixed deposits, UPI and bill payments.
As of June 30, 2026, Moneyview had approximately 140.3 million registered users, 11.9 million monetised users and 48 Financial Partners, while its platform covered approximately 99.0% of Indian PIN codes. Around 79.5% of monetised users were located in Tier-2 and beyond cities. Personal loans remain the principal monetisation engine, supported by an LSP model, default loss guarantee (“DLG”) arrangements and increasing on-balance-sheet lending through WFPL.
The IPO comprises a fresh issue aggregating to INR 750.0 Cr and an OFS of 100,494,200 shares. The fresh-issue share count varies with the final Offer Price: approximately 234,375,000 shares at INR 32.0 and 220,588,235 shares at INR 34.0. Accordingly, total offer size is approximately INR 1,071.6 Cr-INR 1,091.7 Cr. The marketed share counts in the IPO snapshot are shown on the cap-price basis. Net fresh proceeds are intended principally for DLG-supported disbursal growth, capital augmentation of WFPL and general corporate purposes.
IPO Review Rating
Average
MainboardHelping Consumers Borrow Smarter Through Fast and Transparent Finance
The core positive is the combination of very high business growth and a valuation that is not obviously stretched. Revenue from operations has compounded at roughly 58.0% from FY24 to FY26, Managed AUM exceeded INR 21,000 Cr in FY26, the platform has more than 140 million registered users, and its addressable digital-personal-loan market is projected to grow around 27–29% CAGR through FY30. At 24.7x post-Issue P/E, Moneyview is priced below the median of the RHP's selected peer group.
The biggest issues are not valuation—they are credit quality, capital consumption and governance/operational risk. Gross Stage-3 loans have risen from 0.9% to 2.74%, impairment costs have risen sharply, D/E has climbed to 2.3x, DLG exposure is sizeable, and the Company experienced a material cybersecurity incident. The INR 160.0 Cr CEO incentive immediately before the IPO also warrants attention despite being non-recurring.
So at this stage, I would characterize the score as strong growth + reasonable valuation, offset by meaningful lending/credit-risk and governance monitoring requirements.
PARAMETER
WEIGHT
SCORE
KEY FACTORS
Financial Performance
40.0%
3.0/5
Moneyview combines exceptional revenue growth with improving profitability and returns, supported by strong scale expansion. However, rising leverage, negative operating cash flow, increasing credit costs and deterioration in Stage-3 assets remain important financial risks requiring close monitoring after listing closely
Show more
Detailed Analysis
Revenue from operations rose from INR 1,342.4 Cr in FY24 to INR 3,351.2 Cr in FY26, a 58.0% 2-year CAGR
FY26 EBITDA was approximately INR 968.9 Cr, giving a framework EBITDA margin of 28.9%
FY26 PAT was INR 242.7 Cr, implying a comparatively modest 7.2% PAT margin
Borrowings increased to INR 5,157.0 Cr and D/E reached 2.3x in FY26 versus 1.0x in FY24
RHP-disclosed FY26 ROE is 17.9%, ahead of FY25's 12.5%
OCF was negative INR 950.9 Cr in FY26, although it improved from negative INR 1,420.7 Cr in FY25 and turned positive in Q1 FY27
Industry
15.0%
4.0/5
Moneyview operates in a structurally attractive digital-lending market supported by rising retail credit penetration, formalisation and online distribution. Growth prospects are strong, particularly in digital personal loans, but regulatory intervention, credit-cycle volatility, intense competition and data-security requirements remain meaningful risks
Show more
Detailed Analysis
India's retail-loan sanctions are projected to grow 14–16% CAGR, unsecured loans 19–21%, and digital personal loans 27–29% during FY25–FY30
Digital lending is still expanding rapidly, but customer acquisition itself is becoming more mature and competitive
Lending, DLG arrangements, NBFC capital requirements, data privacy and digital-lending regulations create relatively high regulatory exposure
Moneyview operates digitally across India and had 140.3 million registered users and 48 financial partners by June 2026
Management
15.0%
3.0/5
Management brings substantial technology, lending and financial-services experience, while independent directors represent half the Board. Governance positives include established committees and meaningful promoter ownership; however, the large one-time CEO incentive, cybersecurity incident and certain regulatory or tax proceedings warrant monitoring
Show more
Detailed Analysis
Puneet Agarwal has 23+ years across Capital One, Google, McKinsey and fintech; Sanjay Aggarwal has 19+ years in technology/fintech
3 of 6 Directors are Independent which comes to 50.0%
DRHP shareholding disclosures showed no promoter shares pledged/encumbered; two tax and one regulatory/statutory proceeding involving Directors totalled about INR 3.6 Cr
RPTs were disclosed as arm's length, but the INR 160.0 Cr one-time CEO incentive in the IPO year is unusually large
Valuation
20.0%
4.0/5
At roughly 24.7x post-Issue FY26 earnings and approximately 2.0x post-Issue book value, Moneyview's pricing appears moderate relative to most of the RHP-selected peer group. The main qualification is that FY26 PAT includes significant one-offs, so an investor should avoid mechanically treating 24.7x as directly comparable with steady-state earnings multiples
Show more
Detailed Analysis
24.7x versus peer median 33.7x; only OnEMI is cheaper on P/E
FY26 NAV is INR 14.6/share, implying 2.3x pre-Issue P/B. Approximate post-fresh-issue P/B is around 2.0x before final issue-cost adjustments
FY26 RHP-disclosed ROE of 17.9% compares favourably with most disclosed peers
Merchant Banker Track Record
10.0%
5.0/5
Moneyview has a well-established BRLM consortium with substantial mainboard execution experience, healthy historical positive-listing rates and strong recent subscription levels. The combination of Axis, BofA, IIFL and Kotak provides credible institutional distribution and book-building capability
Show more
Detailed Analysis
All four BRLMs have positive average listing gains across their 2026 mainboard mandates, ranging from 5.5% to 15.9%
Their 2026 mandates have averaged approximately 23.3x–38.9x subscription, indicating substantial institutional distribution experience
Historically, approximately 82.0%–89.0% of their tracked mainboard IPOs have listed above their offer prices
TOTAL
100%
3.5/5
Weighted Composite Score
Issue Price
₹32.0 to ₹34.0
As of 22 Sep 2026
GMP
₹10.0
As of 22 Sep 2026
Estimated Gain / Loss
+29.4%
Lot Size
441.0 Shares
Grey Market Premium (GMPs) are shared for knowledge purpose only. PrEqt doesn’t promote or execute the trades.
| Issue size | |
|---|---|
| Overall | ₹1,092.0 Cr |
| Fresh Issue | ₹750.0 Cr |
| Offer for Sale | ₹342.0 Cr |
Minimum Investment
₹14,994.0 / 1,94,481 shares

Merchant Banker
Axis Capital Ltd. BofA Securities India, IIFL Capital Services, Kotak Mahindra Capital
Axis Capital Ltd. BofA Securities India
IIFL Capital Services
Kotak Mahindra Capital
IPO Document
Offer Start Date
Offer End Date
Valuation
Revenue from Operations (FY'26)
PAT (FY'26)
Issue Size
Face Value
₹ 1.0Offer Price
₹ 34.0Lot Size
441.0 sharesSale Type
Fresh capital cum OFSPAT (FY'26)
₹ 242.7 CrPAT Margin (FY'26)
7.2 %P/E Multiple
24.7xCAGR Growth 2Y
58.0 %ROE (FY'26)
17.9 %Price to Book Value
2.0xDebt/Equity
2.3xCompany Website
moneyview.inExplore new deals
Overview
Fund Allocation
Total: ₹0 CrSource:Company DRHP
Timeline
IPO Open Date
To Be Announced
IPO Close Date
To Be Announced
Tentative Allotment
To Be Announced
Initiation of Refunds
To Be Announced
Credit of Shares to Demat
To Be Announced
Tentative Listing Date
To Be Announced
Business
Business Model
Geographical Presence
Sales Channel
Key Risk Factor
Financial Highlights
Income Statement
Revenue growth with EBITDA and PAT margins
| Financial Metric | FY 2024 | FY 2025 | FY 2026 |
|---|---|---|---|
| Revenue (₹ Cr) | 1,342.4 | 2,339.2 | 3,351.2 |
| Growth (%) | - | 74.3% | 43.3% |
| EBITDA (₹ Cr) | - | - | - |
| EBITDA Margin (%) | - | - | - |
| PAT (₹ Cr) | 171.2 | 240.3 | 242.7 |
| PAT Margin (%) | 12.7% | 10.3% | 7.2% |
OBSERVATIONS & INSIGHTS
Revenue from operations increased from INR 1,342.4 Cr in FY24 to INR 2,339.2 Cr in FY25 and INR 3,351.2 Cr in FY26, representing growth of 74.3% and 43.3%, respectively, as loan disbursals and the lending portfolio scaled
PAT increased 40.4% to INR 240.3 Cr in FY25 but grew only 1.0% to INR 242.7 Cr in FY26. The FY26 slowdown in profit growth occurred despite strong revenue growth, reflecting higher credit costs, funding costs and non-recurring expenses. PAT margin declined from 12.8% in FY24 to 10.3% in FY25 and 7.2% in FY26, indicating that incremental growth has become more credit- and capital-intensive as the Group’s own-book lending and risk-sharing exposure increased
EBITDA and EBITDA margin are presented as N.A. because generic industrial EBITDA is not an appropriate primary profitability measure for a lending-led financial-services group where finance cost is a core operating input rather than merely a capital-structure item
Balance Sheet
| Financial Metric | FY 2024 | FY 2025 | FY 2026 |
|---|---|---|---|
| Net Worth | ₹ 1,606.6 Cr | ₹ 1,918.7 Cr | ₹ 2,225.4 Cr |
| Total Assets | ₹ 3,519.5 Cr | ₹ 5,632.4 Cr | ₹ 8,104.9 Cr |
| Total Borrowing | ₹ 1,708.9 Cr | ₹ 3,413.4 Cr | ₹ 5,157.0 Cr |
| Reserves & Surplus | ₹ 1,569.2 Cr | ₹ 1,878.1 Cr | ₹ 2,185.1 Cr |
OBSERVATIONS & INSIGHTS
Total assets increased from INR 3,519.5 Cr in FY24 to INR 8,104.9 Cr in FY26, led primarily by expansion in loans / lending assets as the Group scaled WFPL and overall credit origination
Total borrowings increased more than threefold over FY24-FY26 to INR 5,157.0 Cr, materially faster than equity growth, explaining the increase in debt/equity to approximately 2.3x
Cash and bank balances increased to INR 1,042.6 Cr in FY26 from INR 479.5 Cr in FY24, providing a larger absolute liquidity buffer alongside the expanded borrowing and loan book
Cash Flow
| Financial Metric | FY 2024 | FY 2025 | FY 2026 |
|---|---|---|---|
CFI in Cr Cash used in / generated from investing activities. | +452.2 Cr | -135.3 Cr | -230.8 Cr |
CFF in Cr Cash from / used in financing activities. | +1,517.8 Cr | +1,659.6 Cr | +1,647.8 Cr |
CFO in Cr Cash generated from core business operations. | -1,632.7 Cr | -1,420.7 Cr | -950.9 Cr |
Financial Ratios
Measures the company’s leverage relative to shareholder equity.
OBSERVATIONS & INSIGHTS
RHP-reported return on equity improved from 10.7% in FY24 to 12.5% in FY25 and 17.9% in FY26, reflecting higher earnings relative to average net worth despite the capital required to support lending growth
Leverage increased materially from approximately 1.1x in FY24 to 1.8x in FY25 and 2.3x in FY26 as WFPL expanded its funded loan book. The increase makes funding access, asset quality and capital adequacy increasingly important
ROA declined from 4.9% in FY24 to 4.3% in FY25 and 3.0% in FY26 because total assets grew substantially faster than PAT as lending assets and funding scaled
Interest Coverage is presented as N.A. because finance cost is a core operating cost of the lending business and a conventional industrial interest-coverage ratio would not provide a comparable view of debt-servicing capacity
Current Ratio / ROCE are presented as N.A. because the consolidated financial-services balance sheet is driven by loans, borrowings and financial assets rather than a conventional industrial operating cycle; standard current-ratio and ROCE calculations would be economically misleading
Industry Overview
Industry Drivers
Expansion of Middle India and Formal Credit Penetration
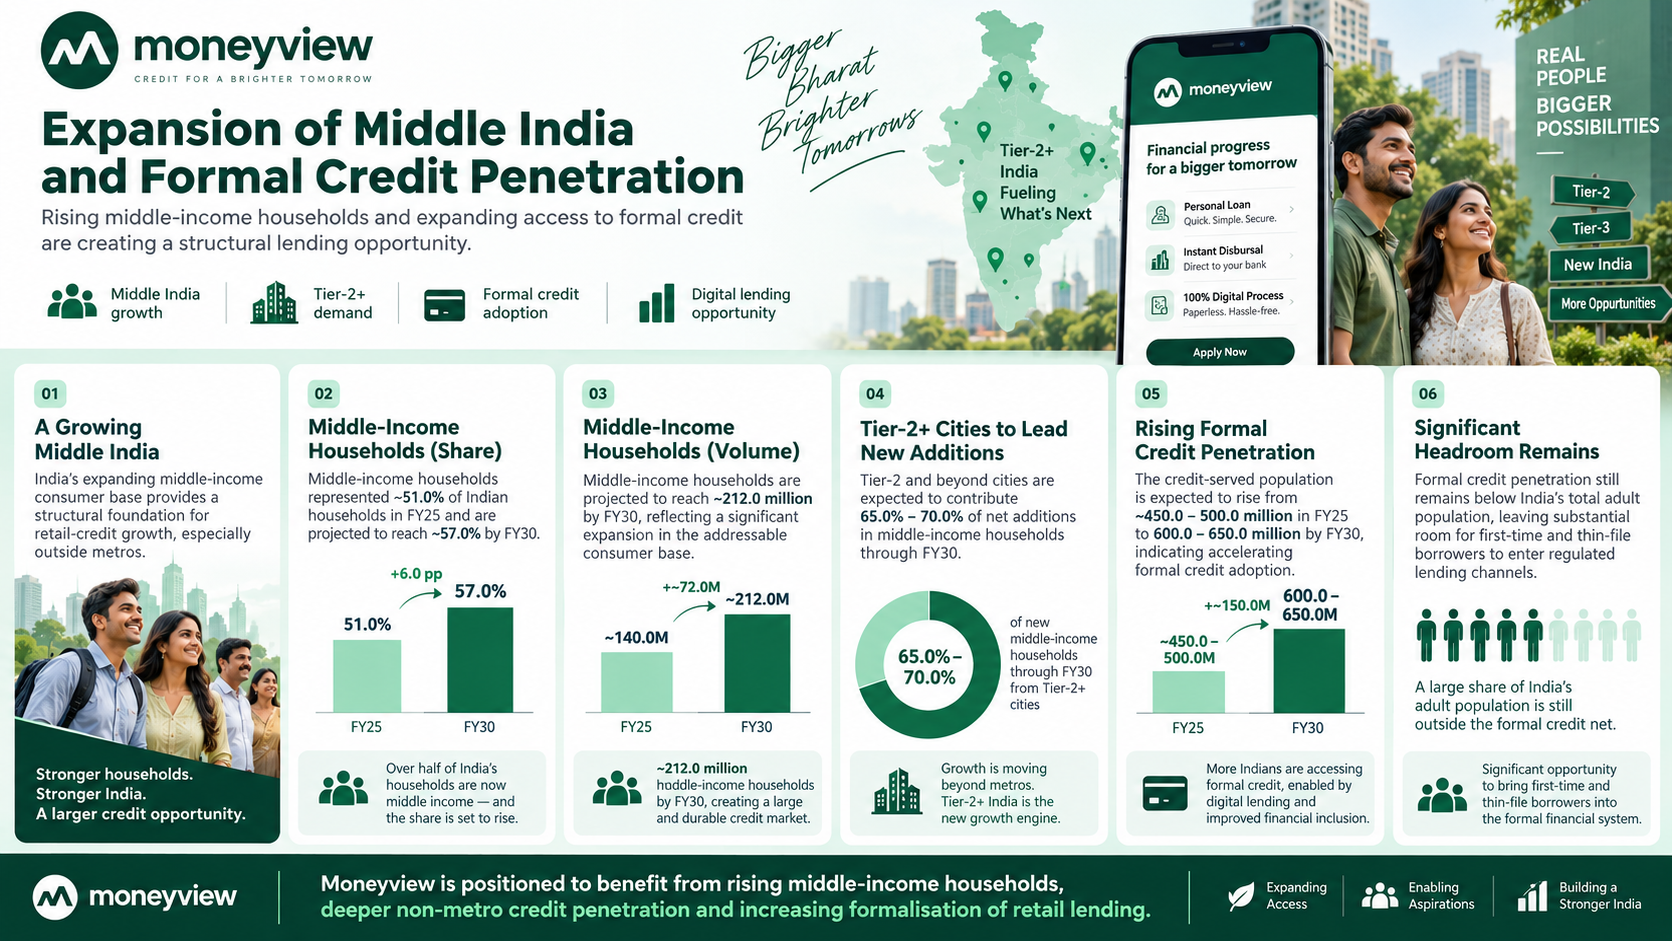
India’s expanding middle-income consumer base provides a structural foundation for retail-credit growth. Middle-income households represented approximately 51.0% of Indian households in FY25 and are projected to reach approximately 57.0% by FY30, with Tier-2 and beyond cities expected to contribute 65.0%-70.0% of net additions. At the same time, the credit-served population is expected to rise from roughly 450.0-500.0 million in FY25 to 600.0-650.0 million by FY30, widening the addressable borrower pool for formal lenders and digital platforms.
The key points are:
Middle-income households are projected to reach approximately 212.0 million by FY30, increasing discretionary consumption and demand for formal credit
Tier-2+ cities are expected to account for approximately 65.0%-70.0% of new middle-income households through FY30, broadening lending opportunities beyond metros
Formal credit penetration remains below the full adult population, leaving substantial headroom for first-time and thin-file borrowers to enter regulated lending channels
Digital Infrastructure, Smartphones and Data-Led Underwriting
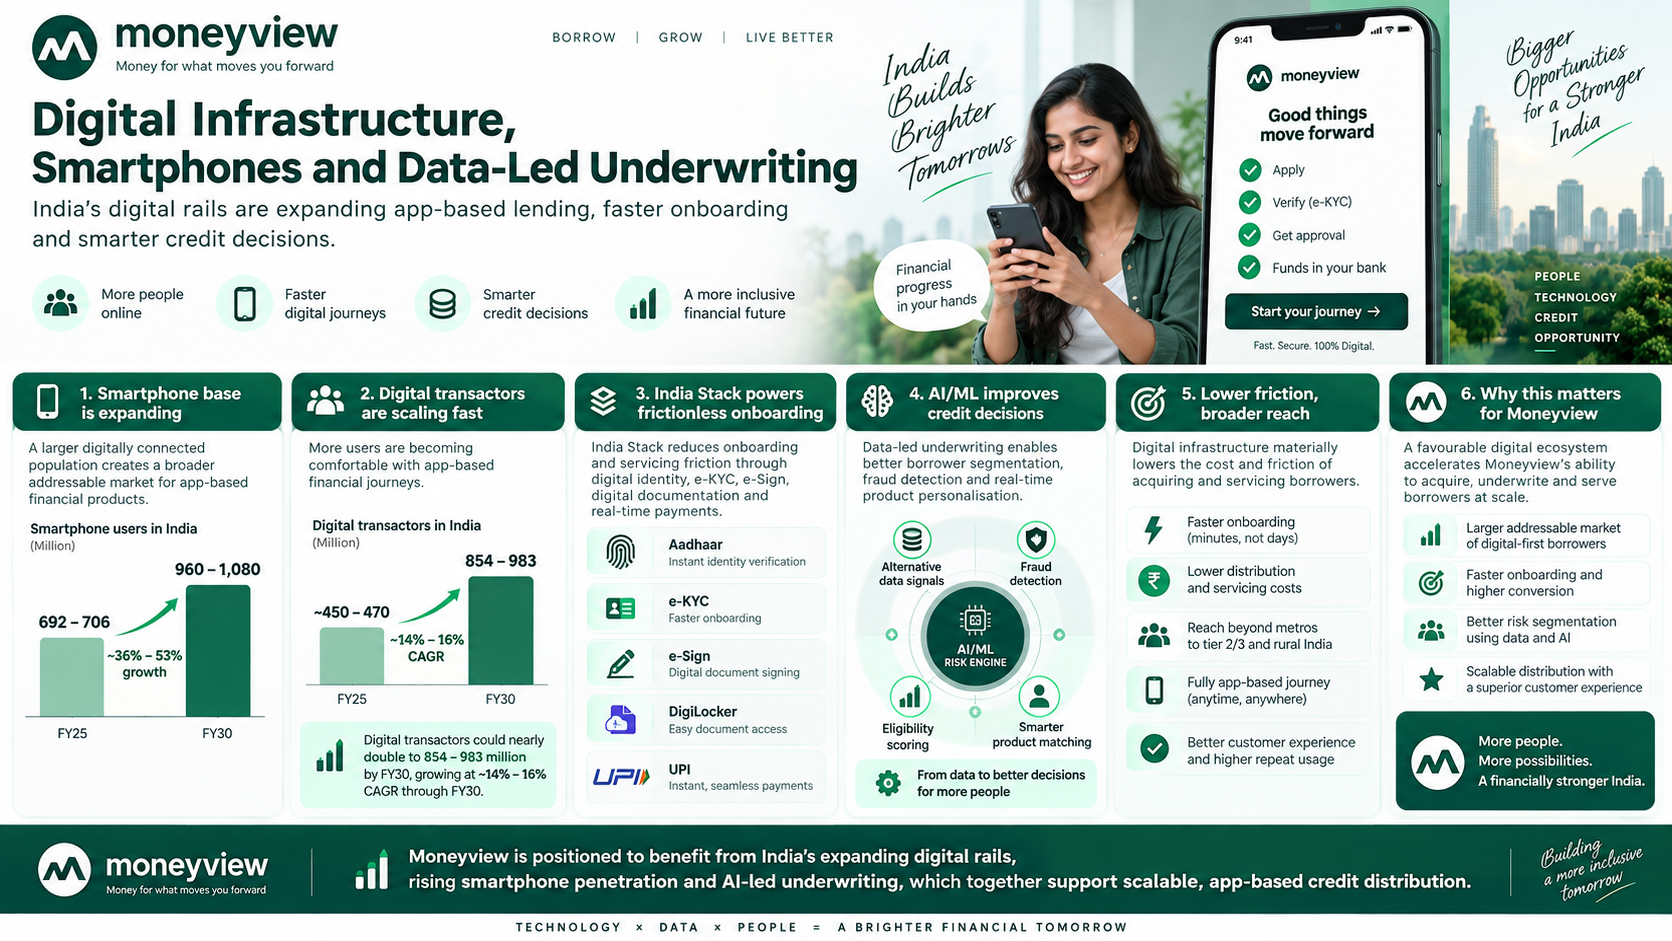
Digital infrastructure is materially lowering the cost and friction of acquiring and servicing borrowers. Smartphone users are projected to increase from approximately 692.0-706.0 million in FY25 to 960.0-1,080.0 million by FY30, while digital transactors could nearly double to 854.0-983.0 million. Aadhaar, e-KYC, UPI, DigiLocker and other India Stack rails enable remote onboarding and payments, while AI/ML and alternative data can improve risk segmentation for consumers with limited traditional credit histories, supporting faster and more personalised credit journeys.
The key points are:
Digital transactors are projected to grow at approximately 14.0%-16.0% CAGR through FY30, increasing the population comfortable with app-based financial products
India Stack reduces onboarding and servicing friction through Aadhaar, e-KYC, e-Sign, DigiLocker and UPI, supporting branch-light financial distribution
AI/ML-based underwriting and alternative-data models can improve borrower segmentation, fraud detection and real-time product personalisation
Rapid Growth of Unsecured and Digital Personal Lending
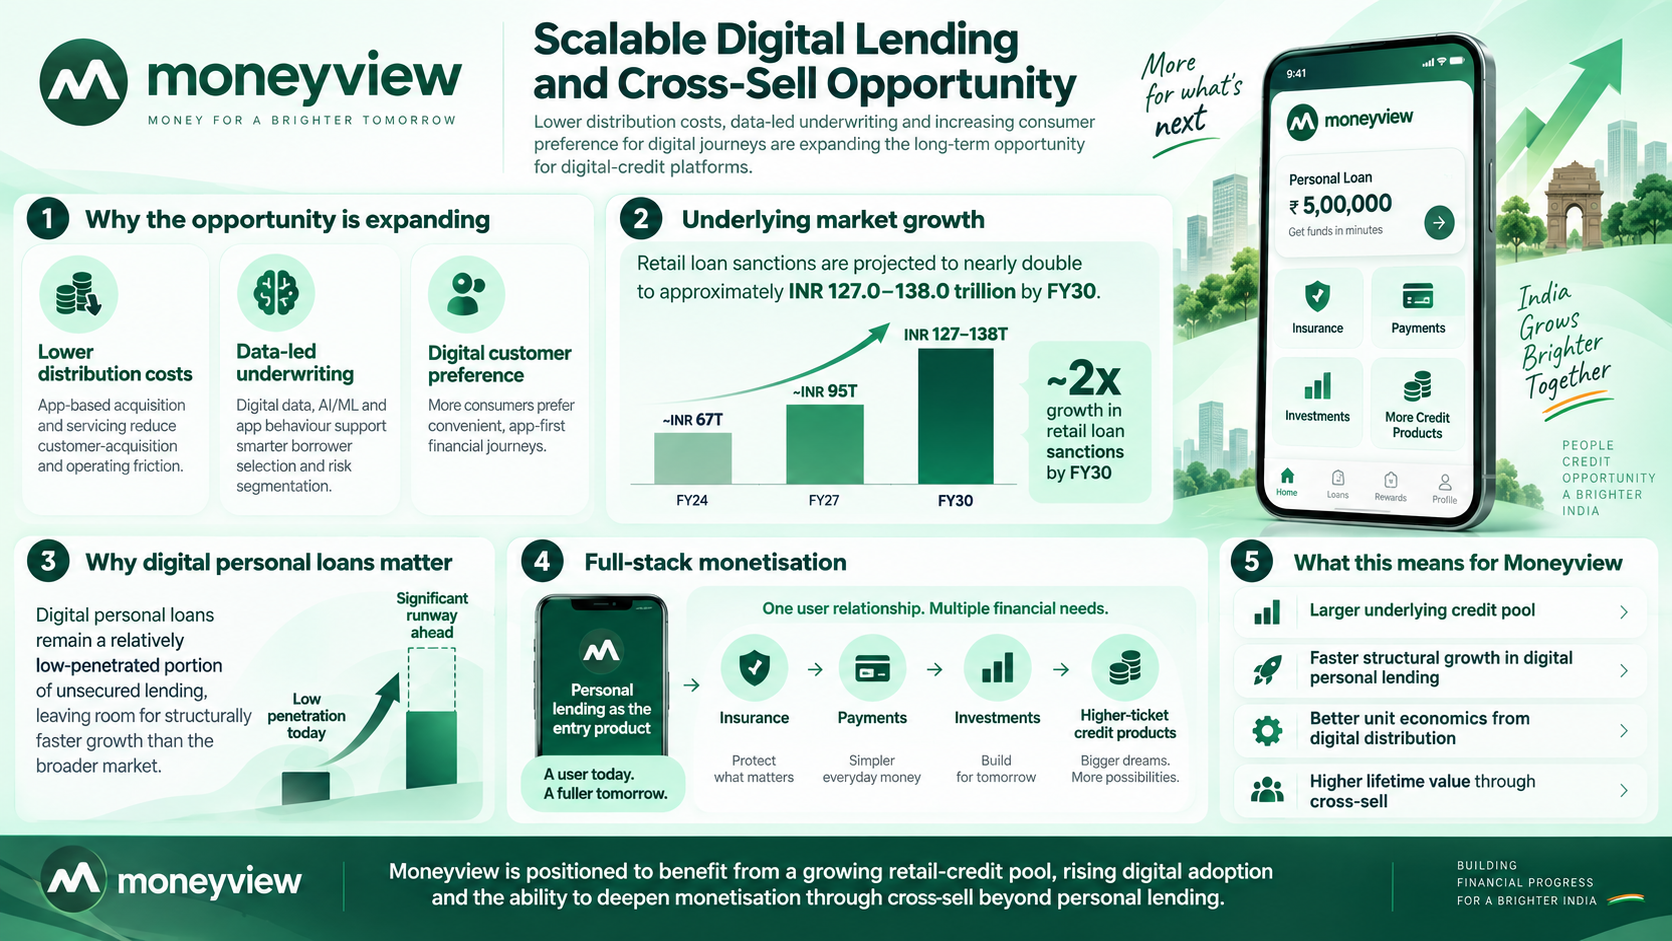
Unsecured consumer credit is expected to remain one of the faster-growing components of India’s retail-lending market. Personal loans grew at approximately 25.0% CAGR during FY20-FY25 and are projected to reach INR 28.0-INR 31.0 trillion by FY30, expanding at 19.0%-21.0% CAGR. Digital personal loans represented only about 13.0% of unsecured personal-loan sanctions in FY25 but are projected to grow at 27.0%-29.0% CAGR, supported by faster approval, lower distribution costs, data-led underwriting and increasing consumer preference for digital journeys.
The key points are:
Retail loan sanctions are projected to nearly double to approximately INR 127.0-INR 138.0 trillion by FY30, providing a larger underlying credit pool
Digital personal loans remain a relatively low-penetrated portion of unsecured lending, leaving room for structurally faster growth than the broader market
Full-stack platforms can use personal lending as an entry product and subsequently cross-sell insurance, payments, investments and higher-ticket credit products
Risks in the Industry
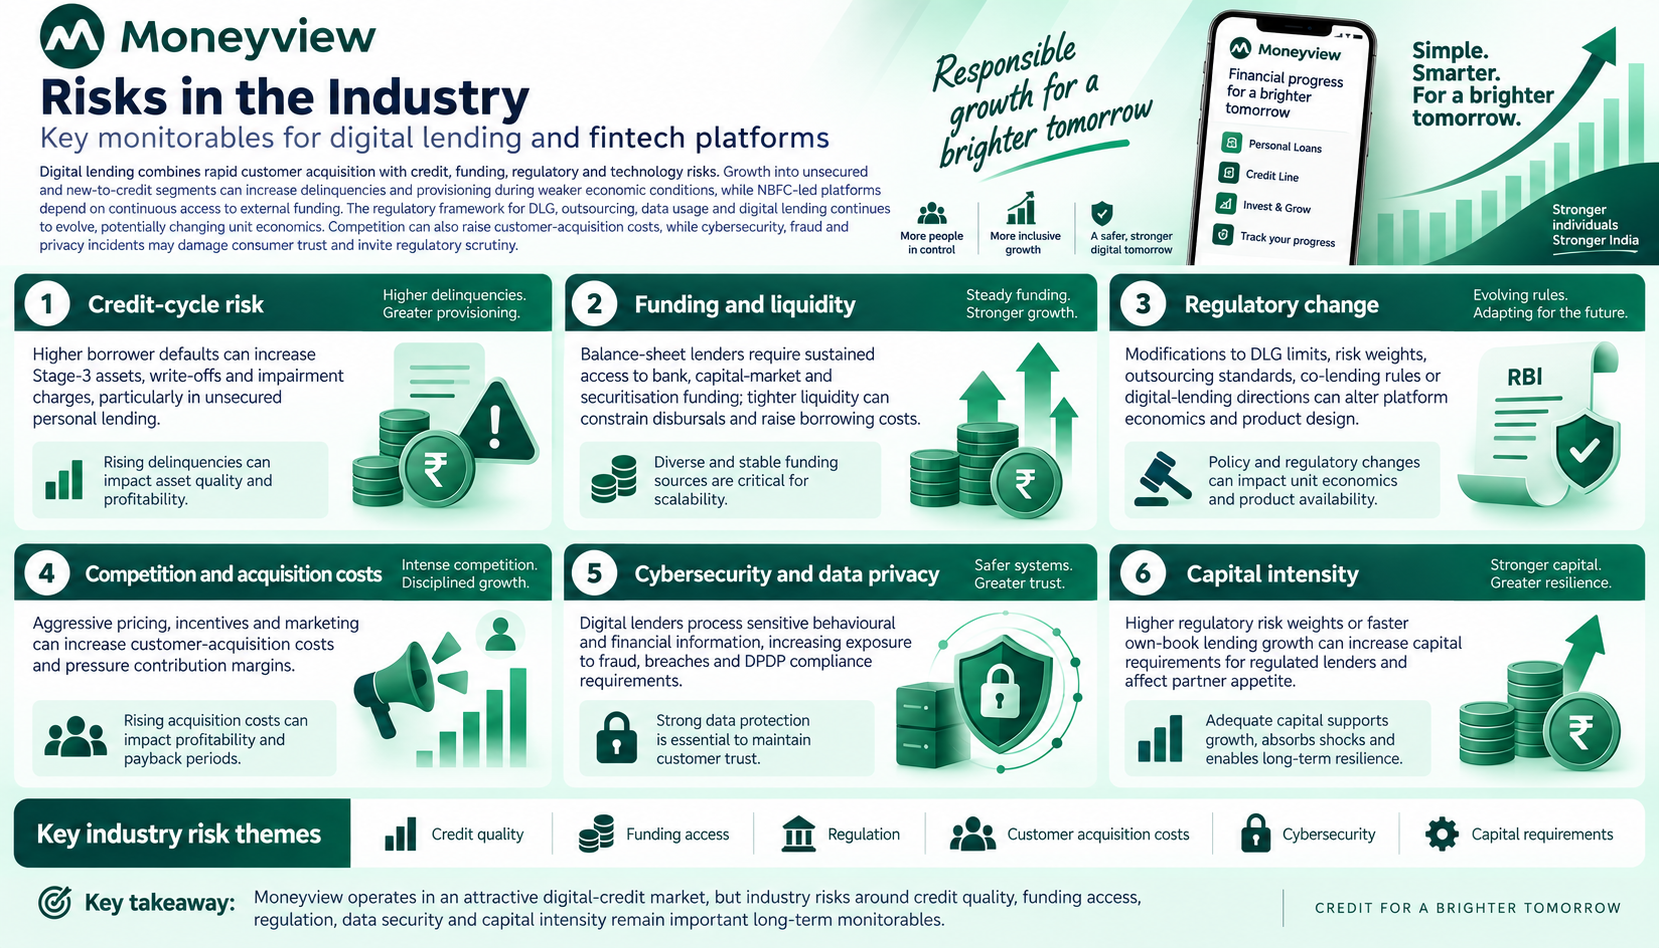
Digital lending combines rapid customer acquisition with credit, funding, regulatory and technology risks. Growth into unsecured and new-to-credit segments can increase delinquencies and provisioning during weaker economic conditions, while NBFC-led platforms depend on continuous access to external funding. The regulatory framework for DLG, outsourcing, data usage and digital lending continues to evolve, potentially changing unit economics. Competition can also raise customer-acquisition costs, while cybersecurity, fraud and privacy incidents may damage consumer trust and invite regulatory scrutiny.
The key risks are:
Credit-cycle risk: Higher borrower defaults can increase Stage-3 assets, write-offs and impairment charges, particularly in unsecured personal lending
Funding and liquidity: Balance-sheet lenders require sustained access to bank, capital-market and securitisation funding; tighter liquidity can constrain disbursals and raise borrowing costs
Regulatory change: Modifications to DLG limits, risk weights, outsourcing standards, co-lending rules or digital-lending directions can alter platform economics and product design
Competition and acquisition costs: Aggressive pricing, incentives and marketing can increase customer-acquisition costs and pressure contribution margins
Cybersecurity and data privacy: Digital lenders process sensitive behavioural and financial information, increasing exposure to fraud, breaches and DPDP compliance requirements
Capital intensity: Higher regulatory risk weights or faster own-book lending growth can increase capital requirements for regulated lenders and affect partner appetite
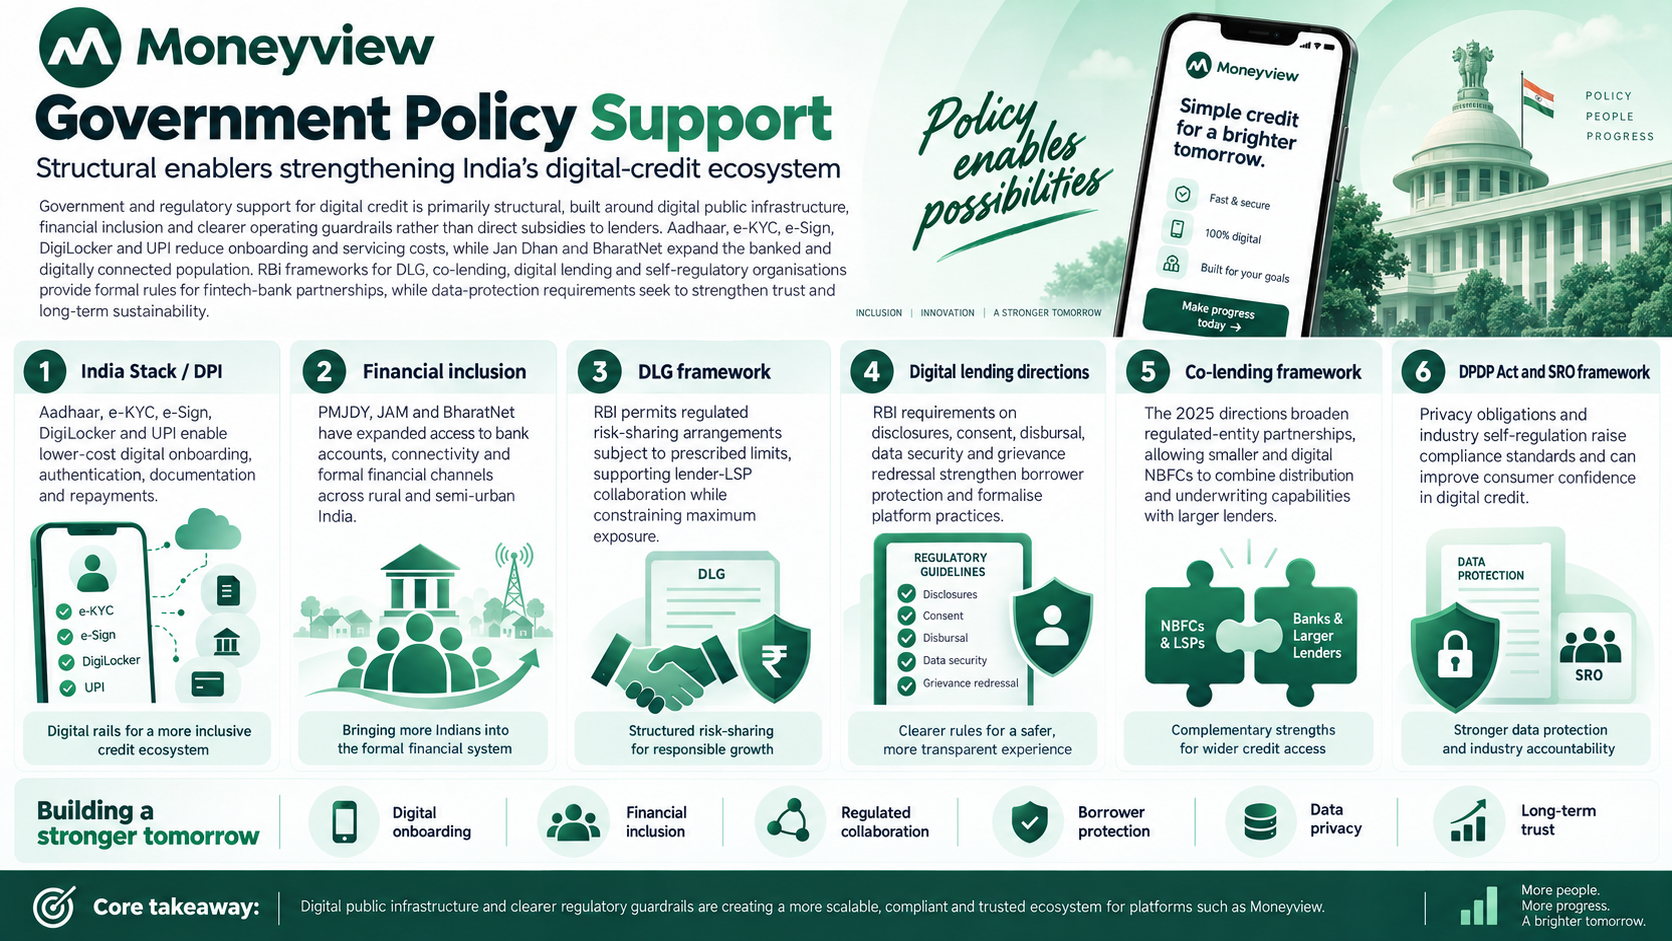
Government Policy Support
Government and regulatory support for digital credit is primarily structural, built around digital public infrastructure, financial inclusion and clearer operating guardrails rather than direct subsidies to lenders. Aadhaar, e-KYC, e-Sign, DigiLocker and UPI reduce onboarding and servicing costs, while Jan Dhan and BharatNet expand the banked and digitally connected population. RBI frameworks for DLG, co-lending, digital lending and self-regulatory organisations provide formal rules for fintech-bank partnerships, while data-protection requirements seek to strengthen trust and long-term sustainability.
The key policies are:
India Stack / DPI: Aadhaar, e-KYC, e-Sign, DigiLocker and UPI enable lower-cost digital onboarding, authentication, documentation and repayments
Financial inclusion: PMJDY, JAM and BharatNet have expanded access to bank accounts, connectivity and formal financial channels across rural and semi-urban India
DLG framework: RBI permits regulated risk-sharing arrangements subject to prescribed limits, supporting lender-LSP collaboration while constraining maximum exposure
Digital lending directions: RBI requirements on disclosures, consent, disbursal, data security and grievance redressal strengthen borrower protection and formalise platform practices
Co-lending framework: The 2025 directions broaden regulated-entity partnerships, allowing smaller and digital NBFCs to combine distribution and underwriting capabilities with larger lenders
DPDP Act and SRO framework: Privacy obligations and industry self-regulation raise compliance standards and can improve consumer confidence in digital credit
Fundraise/Future Plans
Shareholding
Pre-issue shareholding
Promoter Holding 0.0%
Post-Issue Shareholding
Promoter Holding 0.0%
Category
Pre-Issue%Post-Issue%
Promoters
Puneet Agarwal
8.7%6.8%
Sanjay Aggarwal
10.3%8.3%
Sushma Abburi
0.6%0.5%
Promoter Group
4.4%3.8%
Total Promoter Holding
24.0%19.4%
Additional Shareholders
Other Shareholders
80.4%84.4%
Total Additional Holding
80.4%84.4%
Total Shareholding
104.4%103.8%
- Overview
- Business
- Financial Highlights
- Industry Overview
- Fundraise/Future Plans
- Documentation
Get the Preqt App and keep in touch around the clock!
 Monitor your investments in real-time.
- Receive tailored deal suggestions.
- Get real-time updates and alerts.
