

Motilal Oswal Home Finance Limited
Empowering Home OwnershipCustomer-Focused Housing Finance
Unlisted Review and Rating
Speculative
DRHP Not FiledOverall Recommendation
The analysis of MOHFL supports a Speculative view. The Company has strong operating momentum, healthy asset quality, a 7.0% NIM, substantial capital adequacy and experienced management. However, the attached valuation of 46.2x earnings and 4.6x book is materially above listed affordable-housing peers despite unlisted liquidity risk. High intragroup advances, moderate ROE and exposure to interest-rate, funding and credit cycles are additional monitorables. The business appears fundamentally sound, but the current valuation provides limited margin of safety and would become more attractive at a meaningful discount to the attached INR 12 price.
PARAMETER
WEIGHT
SCORE
KEY FACTORS
Financial Performance
25.0%
3.0/5
Strong revenue and profit growth, healthy margins and asset quality are offset by high leverage and negative operating cash flow from loan-book expansion
Show more
Detailed Analysis
Revenue increased from INR 578.0 Cr in FY24 to INR 800.2 Cr in FY26, representing 17.7% two-year CAGR. FY26 growth was 27.0%
Mechanical EBITDA was approximately INR 541.2 Cr, giving a 67.6% margin. Lender-relevant PPOP was approximately INR 225 Cr
FY26 PAT was INR 158.8 Cr, giving a 19.8% PAT margin and 21.9% YoY growth
Reported net D/E was 2.9x, exceeding the rubric’s 2.5x threshold. CRAR, however, remained strong at 37.5
FY26 ROE was approximately 10.6%
OCF was negative at INR 947.5 Cr in FY26 and INR 555.5 Cr in FY25, primarily because of loan-book expansion
Industry
25.0%
3.0/5
The industry offers a strong structural growth runway, supported by low mortgage penetration and affordable-housing demand. However, competition, regulation and the absence of geographic diversification constrain the score.
Show more
Detailed Analysis
India’s individual housing-loan portfolio is projected to grow at approximately 15%-16% CAGR through FY30
HFCs are extensively regulated by RBI through capital, liquidity, provisioning, KYC and governance requirements
MOHFL operates entirely in India and reported no foreign-exchange earnings
Management
25.0%
4.0/5
Management quality is supported by experienced promoters, a seasoned lending team and 50% Board independence. The principal governance monitorable is the substantial volume of intragroup advances, even though these were repaid during the year.
Show more
Detailed Analysis
The Motilal Oswal Group has operated since 1987, while MD and CEO Sukesh Bhowal has more than 28 years of mortgage and retail-lending experience
The Board had 3 independent directors out of 6, representing 50% independence
Approximately INR 2,246 Cr of cumulative advances were provided to group entities and repaid during FY26, This exceeded 15% of revenue despite minimal year-end exposure
Valuation Metrics
25.0%
2.0/5
At INR 12, MOHFL trades at 46.15x earnings and 4.55x book, materially above listed peers despite unlisted liquidity and price volatility
Show more
Detailed Analysis
MOHFL trades at approximately 109.8% premium to the industry P/E of 22.0x
P/B is 4.6x
The INR 12 price is approximately 32.5% below the INR 17.77 cited 52-week high, with meaningful OTC price dispersion
TOTAL
100%
3.0/5
Weighted Composite Score
Per Share Price
₹10.8
As of 14 Oct 2026
Lot Size
2,000.0 Shares
Minimum Investment
₹21,600.0 / 2,000 shares
Market Cap. (₹ Cr)
Revenue FY’26
PAT FY’26
P/E Multiple
Face Value
₹ 1.0Lot Size
2,000.0 sharesSale Type
Secondary SalePAT FY’26
₹ 158.8 CrPAT Margin (%)
19.8 %P/E Multiple
46.1xCAGR Growth 3Y
15.0 %ROE (FY’26)
10.6 %ROCE (FY’26)
9.4 %Price to Book Value ratio
4.5xDebt/Equity (FY’26)
2.8xMerchant banker appointed
❌ NoCompany Website
www.motilaloswal.com/our-businesses/home-financeDisclaimer: Unlisted shares are unregulated & illiquid. This is NOT investment advice. Please do your own due diligence before investing.
Minimum Investment
₹21,600.0 / 2,000 sharesShares Lot 2000 X 1
Investment amount
₹21,600.0
Overview
Business
Business Model
Geographical Presence
Sales Channel
Key Risk Factor
Financial Highlights
Income Statement
Revenue growth with EBITDA and PAT margins
| Financial Metric | FY 2024 | FY 2025 | FY 2026 |
|---|---|---|---|
| Revenue (₹ Cr) | 578.0 | 630.0 | 800.2 |
| Growth (%) | 0.0% | 9.0% | 27.0% |
| EBITDA (₹ Cr) | 427.0 | 439.5 | 541.2 |
| EBITDA Margin (%) | 73.9% | 69.8% | 67.6% |
| PAT (₹ Cr) | 132.5 | 130.3 | 158.8 |
| PAT Margin (%) | 22.9% | 20.7% | 19.8% |
OBSERVATIONS & INSIGHTS
• Revenue from operations increased from INR 577.99 Cr in FY24 to INR 629.95 Cr in FY25 and INR 800.21 Cr in FY26, implying a two-year CAGR of approximately 17.7%
• PAT was broadly flat in FY25 at INR 130.26 Cr versus INR 132.52 Cr in FY24, but improved to INR 158.84 Cr in FY26, supported by loan-book growth, direct-assignment gains and operational efficiency
• The EBITDA / IBDIT proxy margin moderated from 73.9% in FY24 to 67.6% in FY26 as finance-cost, employee and impairment costs rose with scale. This is normal for a scaling lender but should be monitored
• Reported EPS improved from INR 0.22 in FY24-FY25 to INR 0.26 in FY26
Balance Sheet
| Financial Metric | FY 2024 | FY 2025 | FY 2026 |
|---|---|---|---|
| EQUITY & LIABILITIES | ₹ 4,560.8 Cr | ₹ 5,529.8 Cr | ₹ 6,318.5 Cr |
| Net Worth | ₹ 1,287.2 Cr | ₹ 1,428.7 Cr | ₹ 1,607.8 Cr |
| Share Capital | ₹ 603.8 Cr | ₹ 605.4 Cr | ₹ 607.8 Cr |
| Reserves & Surplus | ₹ 683.4 Cr | ₹ 823.3 Cr | ₹ 1,000.0 Cr |
| Total Liabilities | ₹ 3,273.6 Cr | ₹ 4,101.1 Cr | ₹ 4,710.7 Cr |
| Current Liabilities | ₹ 957.6 Cr | ₹ 921.1 Cr | ₹ 1,435.7 Cr |
| Borrowings | ₹ 692.4 Cr | ₹ 535.3 Cr | ₹ 1,354.0 Cr |
| Trade Payables | ₹ 11.4 Cr | ₹ 17.4 Cr | ₹ 6.7 Cr |
| Other Current Liabilities | ₹ 253.8 Cr | ₹ 368.4 Cr | ₹ 75.0 Cr |
| Non-Current Liabilities | ₹ 2,316.0 Cr | ₹ 3,180.0 Cr | ₹ 3,275.0 Cr |
| Borrowings | ₹ 2,316.0 Cr | ₹ 3,167.6 Cr | ₹ 3,263.1 Cr |
| Other Non-Current Liabilities | ₹ 0.0 Cr | ₹ 12.4 Cr | ₹ 11.9 Cr |
| ASSETS | ₹ 4,552.0 Cr | ₹ 5,529.9 Cr | ₹ 6,318.7 Cr |
| Current Assets | ₹ 1,137.2 Cr | ₹ 1,594.0 Cr | ₹ 2,088.2 Cr |
| Trade Receivables | ₹ 0.0 Cr | ₹ 0.0 Cr | ₹ 6.5 Cr |
| Inventory | ₹ 0.0 Cr | ₹ 0.0 Cr | ₹ 0.0 Cr |
| Cash & Cash Equivalents | ₹ 443.3 Cr | ₹ 611.5 Cr | ₹ 511.8 Cr |
| Other Current Assets | ₹ 693.9 Cr | ₹ 982.5 Cr | ₹ 1,569.9 Cr |
| Non-Current Assets | ₹ 3,414.8 Cr | ₹ 3,935.9 Cr | ₹ 4,230.5 Cr |
| Fixed Assets | ₹ 13.9 Cr | ₹ 16.2 Cr | ₹ 15.3 Cr |
| Other Non-Current Assets | ₹ 3,400.9 Cr | ₹ 3,919.7 Cr | ₹ 4,215.2 Cr |
OBSERVATIONS & INSIGHTS
Total assets increased from INR 4,552.09 Cr in FY24 to INR 6,318.65 Cr in FY26, driven mainly by growth in the loan book
Loans increased from INR 4,031.77 Cr in FY24 to INR 5,579.75 Cr in FY26, showing that incremental capital is being deployed into the core housing-finance business
Total equity strengthened from INR 1,287.14 Cr in FY24 to INR 1,607.86 Cr in FY26, supporting growth and the reported capital adequacy of 37.5%
Gross debt increased as the business scaled, with debt securities and borrowings together rising to approximately INR 4,617.20 Cr in FY26. Funding diversification and borrowing cost control remain important
Cash and near-cash balances remained meaningful, although FY26 operating cash flow was negative due to loan-book expansion
Cash Flow
| Financial Metric | FY 2024 | FY 2025 | FY 2026 |
|---|---|---|---|
CFF (₹ Cr) Cash flow related to funding and borrowings. | +107.6 Cr | +415.9 Cr | +1,206.4 Cr |
CFO (₹ Cr) Cash generated from core business operations. | +39.3 Cr | -569.0 Cr | -947.5 Cr |
CFI (₹ Cr) Cash used for investments and long-term assets. | +21.4 Cr | +1.9 Cr | +71.8 Cr |
Financial Ratios
Measures the company’s leverage relative to shareholder equity.
OBSERVATIONS & INSIGHTS
ROA moderated from 3.2% in FY24 to 2.8% in FY25-FY26, while ROE declined from 10.9% to 9.6% before recovering to 10.5% in FY26, indicating improving capital productivity after the FY25 dip
Debt/Equity rose from 2.3x in FY24 to 2.6x in FY25 and 2.9x in FY26, reflecting greater reliance on borrowings to fund loan-book growth. While normal for an HFC, continued leverage expansion makes funding costs and asset quality increasingly important
Interest coverage stayed around 1.6–1.7x across the three years, suggesting adequate but not excessive earnings cushion over finance costs. For MOHFL, this ratio should be interpreted cautiously because interest expense is a core operating cost of the lending business
Current ratio improved from 1.2x in FY24 to 1.7x in FY25, before normalising to 1.5x in FY26. ROCE also remained relatively steady at 10.1%, 9.2% and 9.4%, indicating that the Company has maintained reasonably consistent returns despite a growing and increasingly leveraged balance sheet
Industry Overview
Industry Drivers
Industry Overview
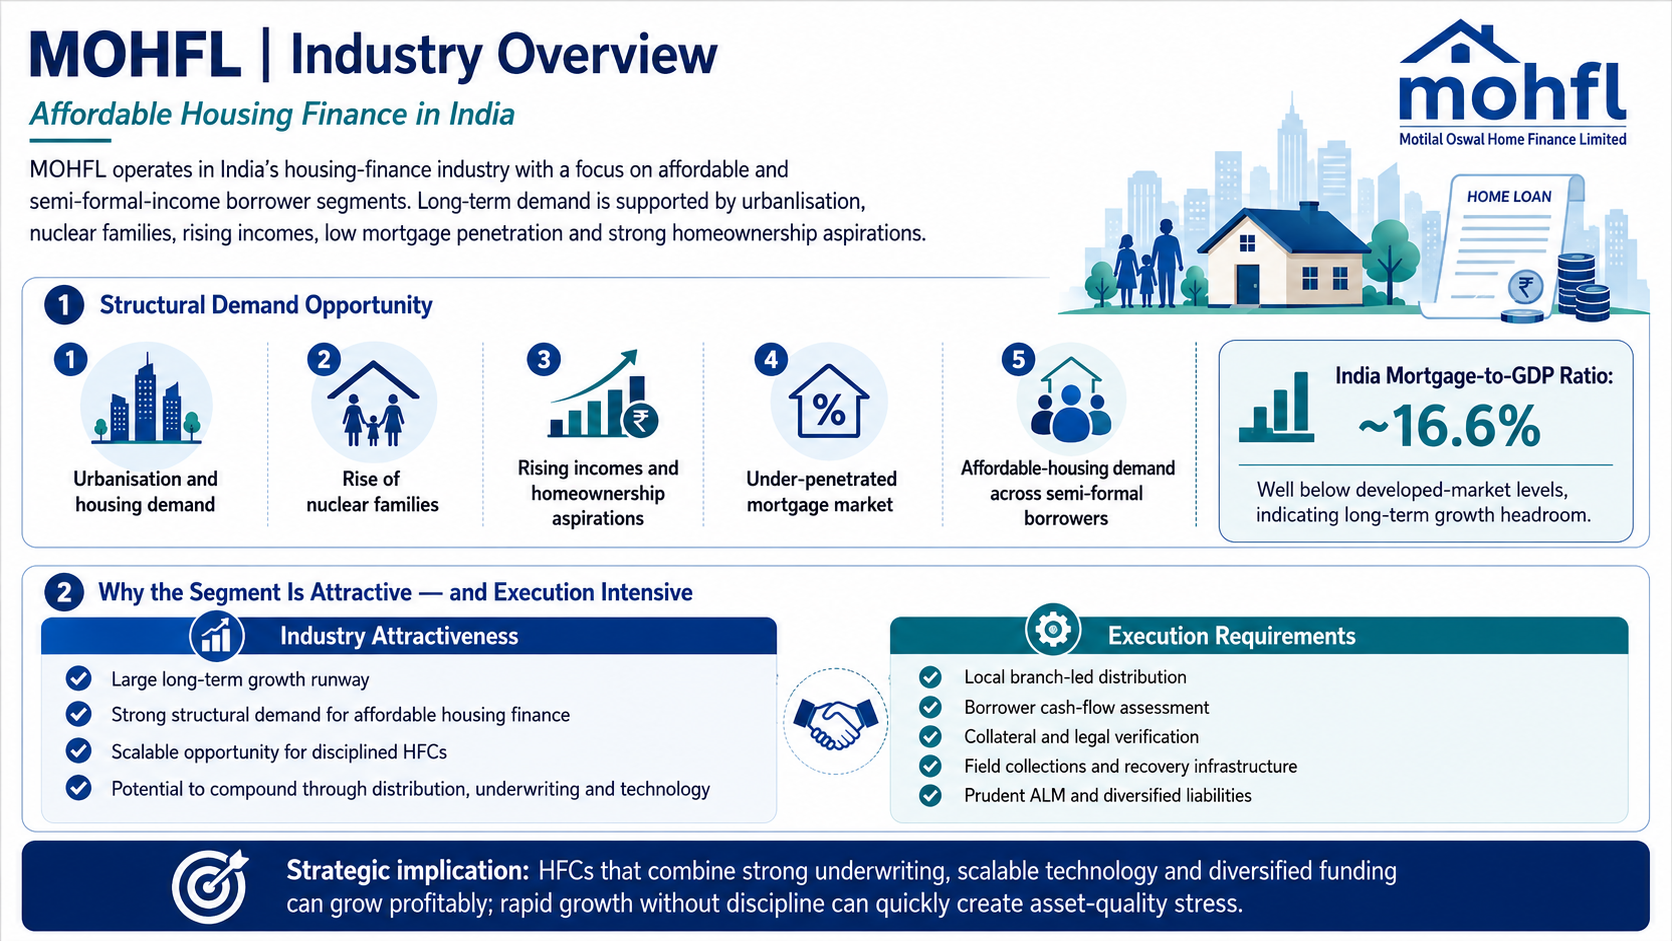
MOHFL operates in India’s housing finance industry, with a specific focus on affordable and semi-formal-income borrower segments. Demand is supported by urbanisation, nuclear families, rising incomes, under-penetration of mortgage credit and homeownership aspirations
The FY26 annual report highlights India’s mortgage-to-GDP ratio at approximately 16.6%, well below developed-market levels, implying long-term growth headroom
Affordable housing finance is structurally attractive but operationally intensive. Success requires local distribution, borrower cash-flow assessment, collateral verification, field collections, legal recovery infrastructure and prudent ALM. HFCs that combine strong underwriting with scalable technology and diversified liabilities can compound profitably, but rapid growth without discipline can quickly create asset-quality problems
Industry Drivers
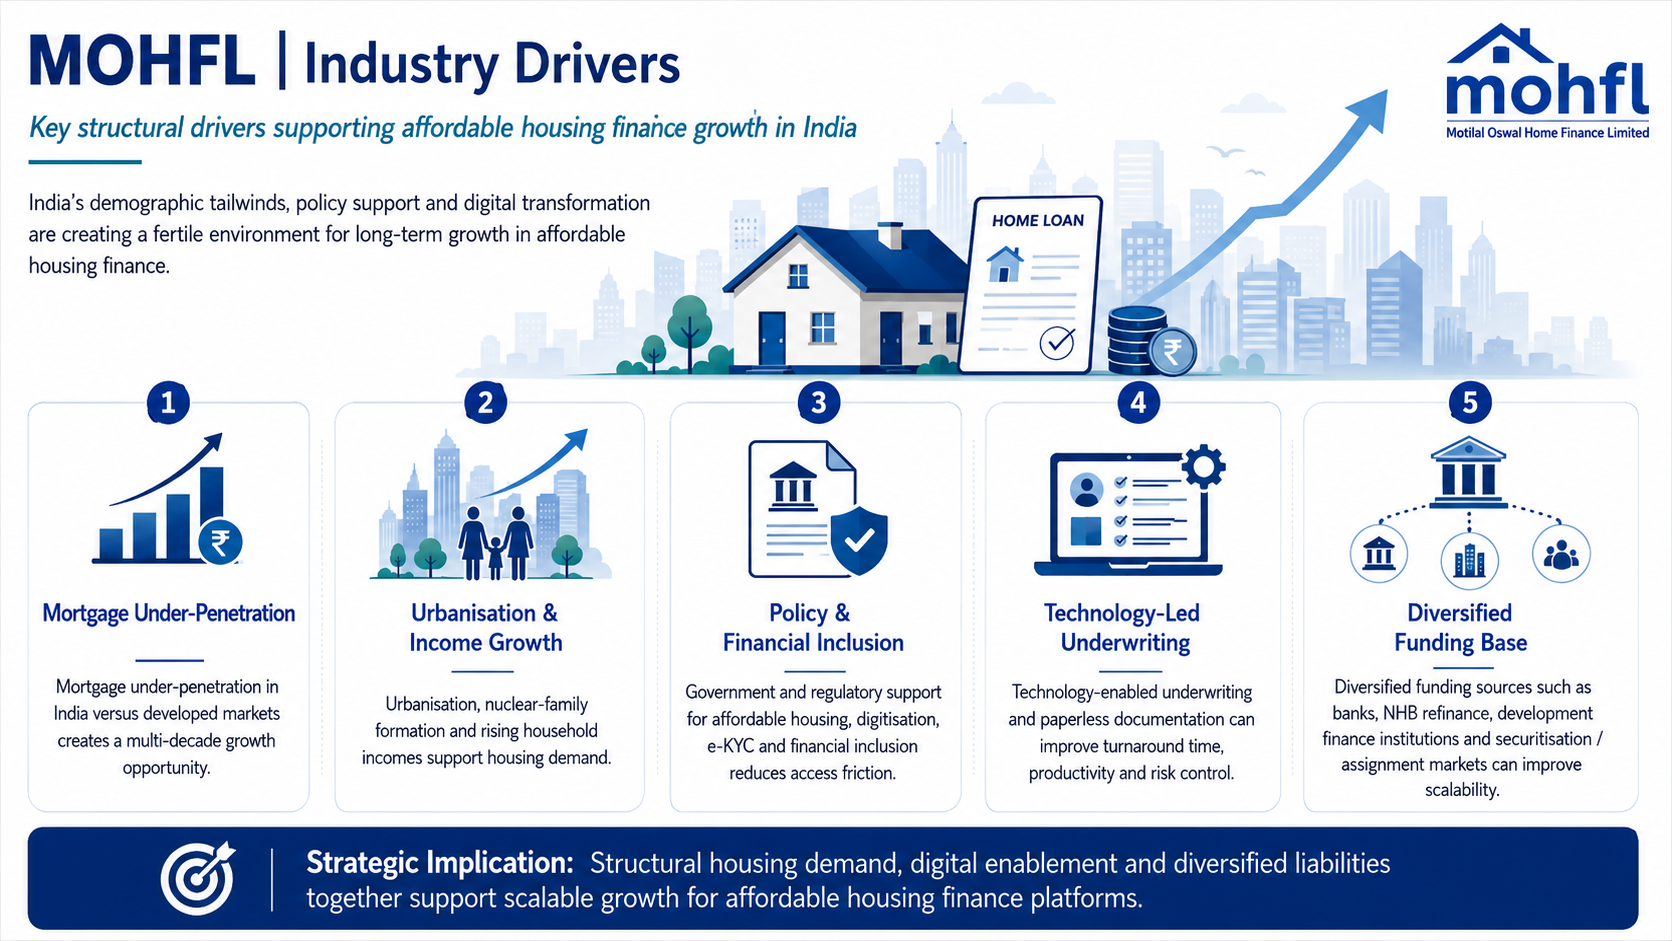
• Mortgage under-penetration in India versus developed markets creates a multi-decade growth opportunity
• Urbanisation, nuclear-family formation and rising household incomes support housing demand
• Government and regulatory support for affordable housing, digitisation, e-KYC and financial inclusion reduces access friction
• Technology-enabled underwriting and paperless documentation can improve turnaround time, productivity and risk control
• Diversified funding sources such as banks, NHB refinance, development finance institutions and securitisation / assignment markets can improve scalability
Industry Risks
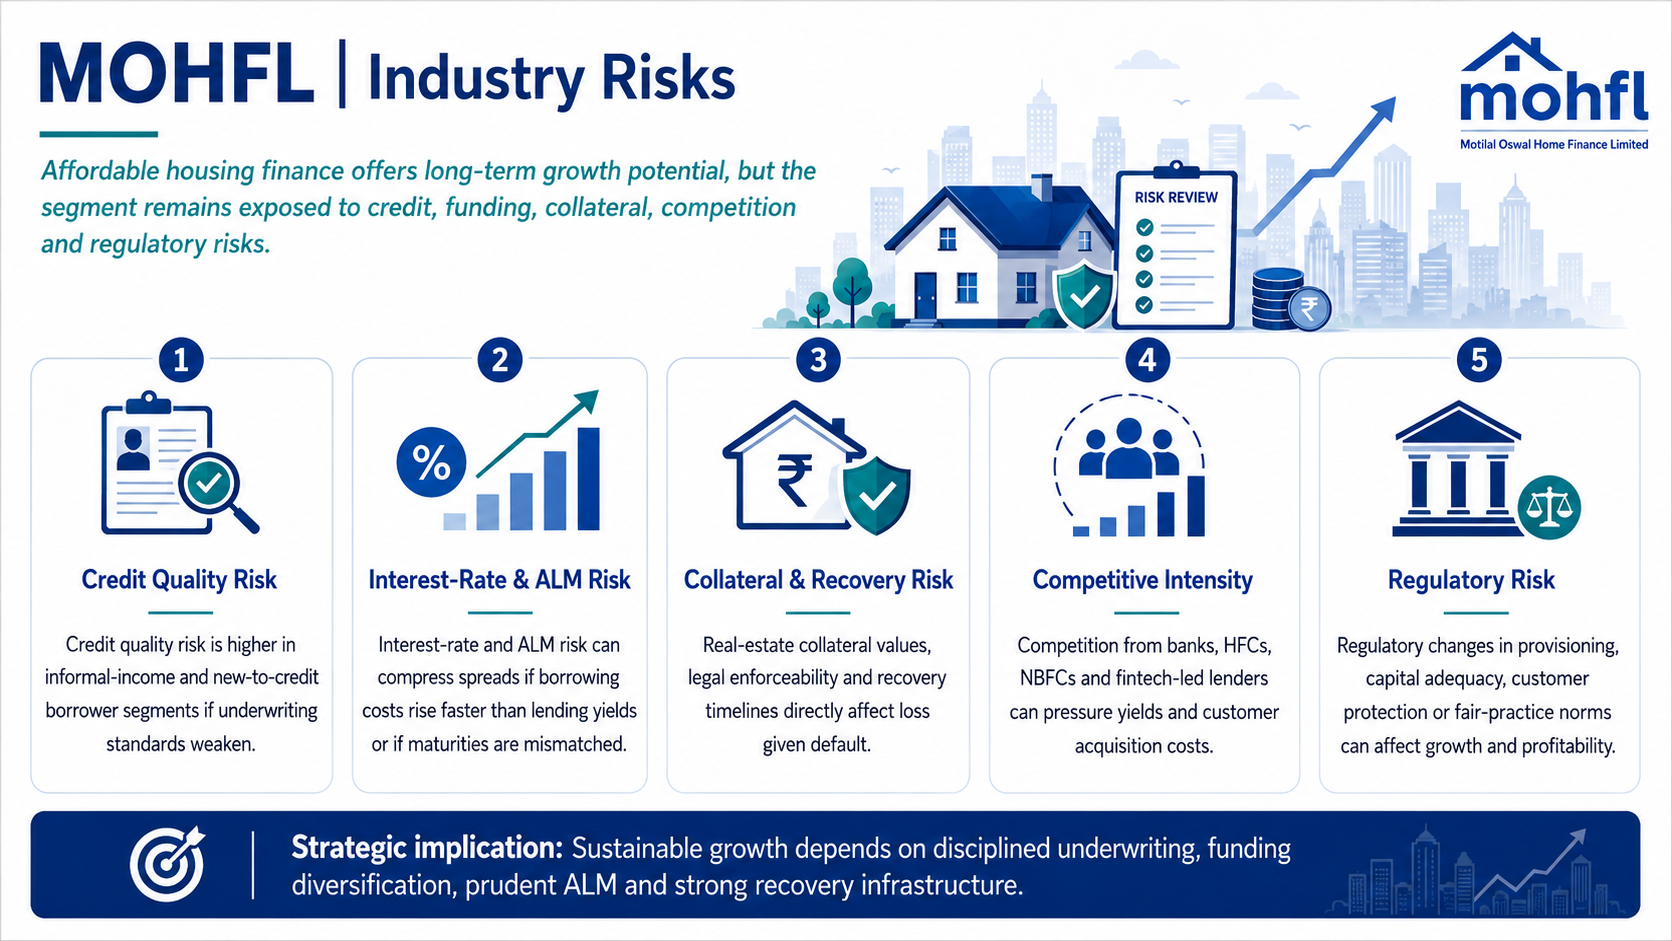
• Credit quality risk is higher in informal-income and new-to-credit borrower segments if underwriting standards weaken
• Interest-rate and ALM risk can compress spreads if borrowing costs rise faster than lending yields or if maturities are mismatched
• Real-estate collateral values, legal enforceability and recovery timelines directly affect loss given default
• Competition from banks, HFCs, NBFCs and fintech-led lenders can pressure yields and customer acquisition costs
• Regulatory changes in provisioning, capital adequacy, customer protection or fair-practice norms can affect growth and profitability
Government Policy Support
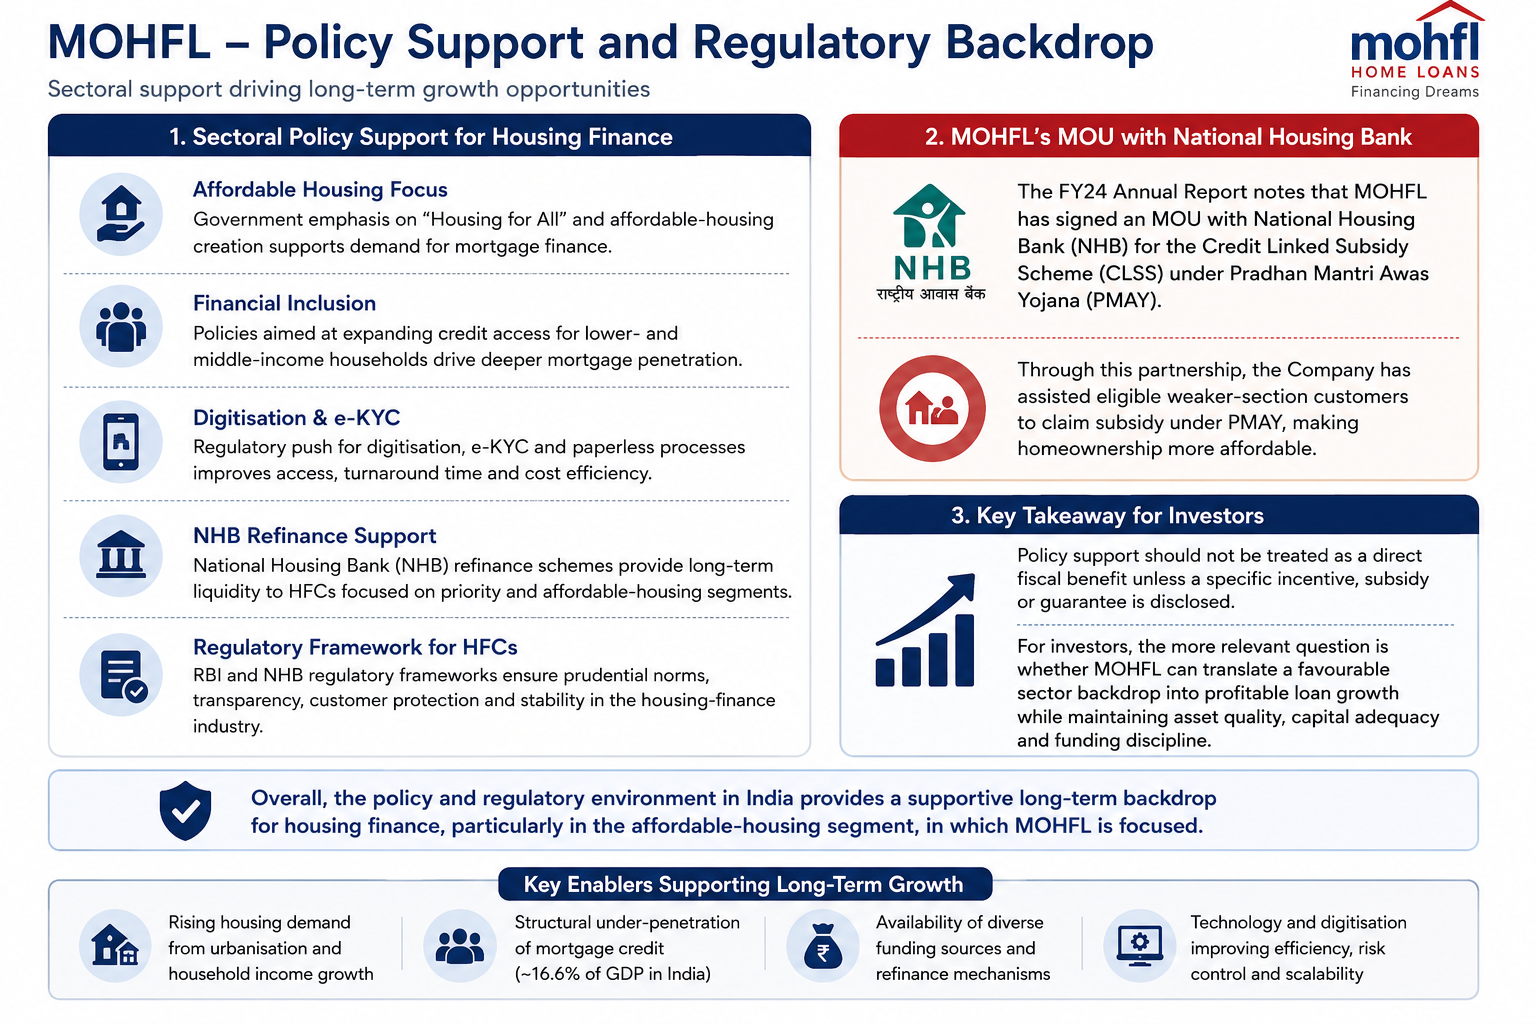
Policy support for MOHFL is sectoral rather than company-specific. Affordable housing, financial inclusion, digitisation, credit access for lower- and middle-income households, NHB refinance mechanisms and regulatory frameworks for HFCs collectively support long-term growth
The FY24 annual report also notes MOHFL’s MOU with National Housing Bank for the Credit Linked Subsidy Scheme under PMAY, through which the Company has assisted eligible weaker-section customers to claim subsidy
Policy support should not be treated as a direct fiscal benefit unless a specific incentive, subsidy or guarantee is disclosed. For investors, the more relevant question is whether MOHFL can translate a favourable sector backdrop into profitable loan growth while maintaining asset quality, capital adequacy and funding discipline
- Overview
- Business
- Financial Highlights
- Industry Overview
- Documentation
Get the Preqt App and keep in touch around the clock!
 Monitor your investments in real-time.
- Receive tailored deal suggestions.
- Get real-time updates and alerts.
