


MSEI
Access. Trade. Grow.Building Market Confidence
IPO Review and Rating
Speculative
Overall Recommendation
The historic financial profile remains weak: operating revenue declined at a (31.6)% FY23-FY25 CAGR to INR 4.3 Cr, FY25 EBITDA was INR (29.5) Cr, PAT was INR (34.2) Cr, ROE was (8.6)% and operating cash flow was INR (68.4) Cr. The balance sheet is effectively debt-free, and the INR 238.0 Cr FY25 plus INR 1,000.0 Cr FY26 equity raises materially improve financial capacity. For MSEI, the single most important metric over the next 12-24 months is not PAT growth. It is average daily turnover and sustainable market share in equity cash and derivatives.
PARAMETER
WEIGHT
SCORE
KEY FACTORS
Financial Performance
25.0%
1.4/5
MSEI is not currently an operating-profitability story
Show more
Detailed Analysis
Operating revenue declined from INR 9.21 Cr in FY23 to INR 7.4 Cr in FY24 and INR 4.3 Cr in FY25, representing a (31.6)% FY23-FY25 2-year CAGR
FY25 mechanical EBITDA was approximately INR (29.5) Cr, versus operating revenue of INR 4.3 Cr, implying an operating-revenue EBITDA margin of approximately (684.2)%
FY25 PAT stood at INR (34.2) Cr, resulting in a net margin of approximately (793.9)% on operating revenue; the Annual Report itself reports a net-profit ratio of approximately (791)%
FY25 lease liabilities were approximately INR 8.24 Cr against consolidated net assets/equity of approximately INR 443.85 Cr, implying adjusted D/E of only ~0.02x
FY25 ROE remained negative at (8.6)%, although it improved from (25.3)% in FY24 as losses reduced and the equity base expanded
Industry
25.0%
3.0/5
Currency turnover fell 78.2% and equity cash turnover was only INR 26.2 Cr for the full year
Show more
Detailed Analysis
India's equity-market capitalisation increased from approximately USD 2.0 Tn in 2018 to USD 5.3 Tn in 2025, representing approximately 14.9% CAGR
Indian capital-market penetration was cited at only 9.5%, while market capitalisation increased 165%+ over seven years
MSEI is a SEBI-recognised national stock exchange authorised across Equity, Equity Derivatives, Debt and Currency Derivatives
FY25 achieved 100.0% system uptime; MSEI offers 2,138 equity securities, derivatives on 209 stocks, currency products and interest-rate futures, while raising INR 238.0 Cr in FY25 + INR 1,000.0 Cr in FY26
Management
25.0%
3.2/5
Leadership experience stands at 25+ years
Show more
Detailed Analysis
MD & CEO Latika Kundu has 25+ years of global financial-market experience, including exchanges, clearing corporations and depositories across multiple asset classes
FY25 Board comprised 5 Directors, including 3 Public Interest/Independent Directors, resulting in 60.0% independent representation
MSEI has no promoter/promoter group, however, an unresolved IFIN litigation includes a monetary claim of INR 84.2 Cr plus interest, equivalent to approximately 21.2% of FY25 standalone net worth
FY25 recurring KMP/director remuneration and sitting fees were approximately INR 3.9 Cr, equivalent to approximately 91.6% of operating revenue or 22.7% of total income
Valuation Metrics
25.0%
1.2/5
FY25 PAT is INR (34.22) Cr
Show more
Detailed Analysis
FY25 EBITDA is approximately INR (29.5) Cr, so EV/EBITDA has no economic value
P/B of 17.8x is based largely on pre-FY26-raise book value. Adding the subsequently disclosed INR 1,000.0 Cr FY26 equity raise to FY25 net worth gives an approximate pro-forma P/B of ~5.0x
A 52-week range of INR 2.6-INR 8.3, representing approximately 68.4% peak-to-trough variation relative to the high
TOTAL
100%
2.2/5
Weighted Composite Score
Per Share Price
₹6.9
As of 14 Oct 2026
Lot Size
10,000.0 Shares
Minimum Investment
₹69,000.0 / 10,000 shares
Market Cap. (₹ Cr)
Revenue FY’25
PAT FY’25
Face Value
₹ 1.0Lot Size
10,000.0 sharesPAT FY’25
₹ -34.2 CrPAT Margin (%)
-793.9 %CAGR Growth 2Y
-31.6 %ROE (FY’25)
-8.6 %ROCE (FY’265
-8.8 %Price to Book Value ratio
5.0xDebt/Equity (FY’25)
0.0xMerchant banker appointed
❌ NoCompany Website
mseindia.comDisclaimer: Unlisted shares are unregulated & illiquid. This is NOT investment advice. Please do your own due diligence before investing.
Minimum Investment
₹69,000.0 / 10,000 sharesShares Lot 10000 X 1
Investment amount
₹69,000.0
Overview
Business
Services
Business Model
Geographical Presence
Sales Channel
Financial Highlights
Income Statement
Revenue growth with EBITDA and PAT margins
| Financial Metric | FY 2023 | FY 2024 | FY 2025 |
|---|---|---|---|
| Revenue (₹ Cr) | 9.2 | 7.4 | 4.3 |
| Growth (%) | -8.4% | -20.1% | -41.4% |
| EBITDA (₹ Cr) | -3.7 | -40.5 | -29.5 |
| EBITDA Margin (%) | -40.0% | -551.0% | -684.0% |
| PAT (₹ Cr) | -18.7 | -48.7 | -34.2 |
| PAT Margin (%) | -202.0% | -662.0% | -794.0% |
OBSERVATIONS & INSIGHTS
Revenue from Operations declined in each of the last three reported years, falling from INR 9.21 Cr in FY23 to INR 4.31 Cr in FY25
The FY22-FY25 CAGR is approximately negative 24.6%, while the two-year FY23-FY25 CAGR is approximately negative 31.6%
The EBITDA proxy remained negative and deteriorated sharply relative to core revenue. FY25 proxy EBITDA was approximately negative INR 29.49 Cr, equivalent to negative 684% of operating revenue
FY25 PAT loss improved to INR 34.22 Cr from INR 48.74 Cr in FY24, but the improvement came despite a further decline in operating revenue
Sustainable profitability therefore requires a material increase in core exchange activity rather than cost reduction alone
Other Income was INR 13.07 Cr in FY25, more than three times revenue from operations
Balance Sheet
| Financial Metric | FY 2023 | FY 2024 | FY 2025 |
|---|---|---|---|
| EQUITY & LIABILITIES | ₹ 299.4 Cr | ₹ 249.2 Cr | ₹ 443.7 Cr |
| Net Worth | ₹ 241.4 Cr | ₹ 192.8 Cr | ₹ 396.6 Cr |
| Share Capital | ₹ 480.5 Cr | ₹ 480.5 Cr | ₹ 599.5 Cr |
| Reserves & Surplus | ₹ -239.1 Cr | ₹ -287.7 Cr | ₹ -202.9 Cr |
| Total Liabilities | ₹ 58.0 Cr | ₹ 56.4 Cr | ₹ 47.1 Cr |
| Current Liabilities | ₹ 35.7 Cr | ₹ 37.3 Cr | ₹ 17.0 Cr |
| Lease Liabilities | ₹ 3.6 Cr | ₹ 1.4 Cr | ₹ 8.2 Cr |
| Trade Payables | ₹ 0.9 Cr | ₹ 2.6 Cr | ₹ 0.8 Cr |
| Other Current Liabilities | ₹ 31.2 Cr | ₹ 33.3 Cr | ₹ 8.0 Cr |
| Non-Current Liabilities | ₹ 22.3 Cr | ₹ 19.1 Cr | ₹ 30.1 Cr |
| Borrowings | ₹ 0.0 Cr | ₹ 0.0 Cr | ₹ 0.0 Cr |
| Other Non-Current Liabilities | ₹ 22.3 Cr | ₹ 19.1 Cr | ₹ 30.1 Cr |
| ASSETS | ₹ 299.3 Cr | ₹ 249.3 Cr | ₹ 444.0 Cr |
| Current Assets | ₹ 202.6 Cr | ₹ 161.6 Cr | ₹ 258.6 Cr |
| Trade Receivables | ₹ 1.3 Cr | ₹ 2.6 Cr | ₹ 0.9 Cr |
| Inventory | ₹ 0.0 Cr | ₹ 0.0 Cr | ₹ 0.0 Cr |
| Cash & Cash Equivalents | ₹ 63.4 Cr | ₹ 13.7 Cr | ₹ 47.5 Cr |
| Other Current Assets | ₹ 137.9 Cr | ₹ 145.3 Cr | ₹ 210.2 Cr |
| Non-Current Assets | ₹ 96.7 Cr | ₹ 87.7 Cr | ₹ 185.4 Cr |
| Fixed Assets | ₹ 6.3 Cr | ₹ 4.5 Cr | ₹ 2.8 Cr |
| Other Non-Current Assets | ₹ 90.4 Cr | ₹ 83.2 Cr | ₹ 182.6 Cr |
OBSERVATIONS & INSIGHTS
FY25 total equity almost doubled to INR 396.69 Cr from INR 192.79 Cr in FY24, primarily reflecting the fresh private placement rather than retained profitabilit
The company remains conventionally debt-free. Financial resilience therefore depends on the size and deployment of its equityfunded liquidity pool rather than refinancing access
Intangible assets including development increased to approximately INR 36.14 Cr, consistent with a technology-intensive exchange build-out. The economic return on this investment depends on future participant activity and trading volumes
The post-FY25 INR 1,000 Cr capital raise further strengthens liquidity but creates significant dilution and raises the bar for capital efficiency
Cash Flow
| Financial Metric | FY 2023 | FY 2024 | FY 2025 |
|---|---|---|---|
CFO (₹ Cr) Cash generated from core business operations. | -172.11 Cr | -56.4 Cr | -68.4 Cr |
CFI (₹ Cr) Cash used for investments and long-term assets. | +224.0 Cr | +9.0 Cr | -133.4 Cr |
CFF (₹ Cr) Cash flow related to funding and borrowings. | -3.28 Cr | -2.31 Cr | +235.7 Cr |
Financial Ratios
Measures the company’s leverage relative to shareholder equity.
OBSERVATIONS & INSIGHTS
ROE and ROCE remained negative in all three years, confirming that the Exchange has not yet generated an adequate return on its capital base
The absence of conventional borrowings is a material balance-sheet strength. The principal financial risk is cash burn and capital efficiency rather than debt servicing
The FY25 current ratio increased sharply to approximately 15x because the equity raise expanded liquid assets while current liabilities fell
ROE improved from negative 25.28% in FY24 to negative 8.63% in FY25 primarily because losses narrowed and equity increased materially following fresh capital issuance
ROCE similarly improved to negative 8.79% in FY25, but remains negative. The post-FY25 INR 1,000 Cr raise will further increase the capital base, raising the execution hurdle for future returns
Industry Overview
Industry Drivers
Expansion of Technological Capabilities
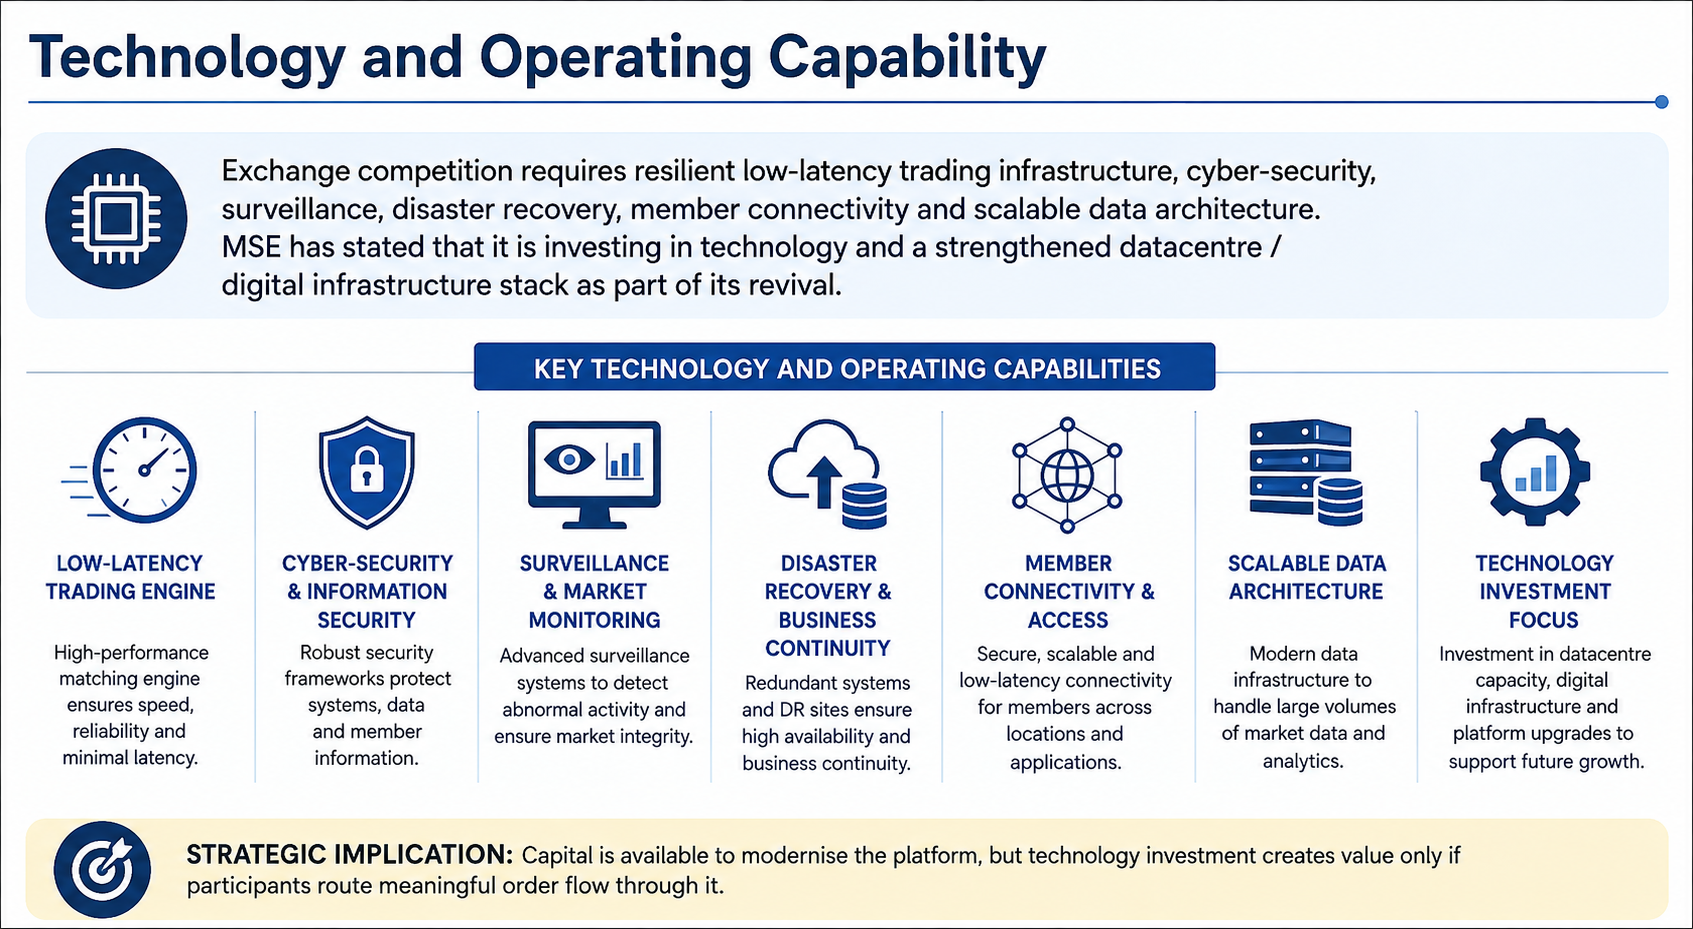
Exchange competition requires resilient low-latency trading infrastructure, cyber-security, surveillance, disaster recovery, member connectivity and scalable data architecture
MSE has stated that it is investing in technology and a strengthened datacentre / digital infrastructure stack as part of its revival
Strategic implication: capital is available to modernise the platform, but technology investment creates value only if participants route meaningful order flow through it
Liquidity, Market Makers and Network Effects
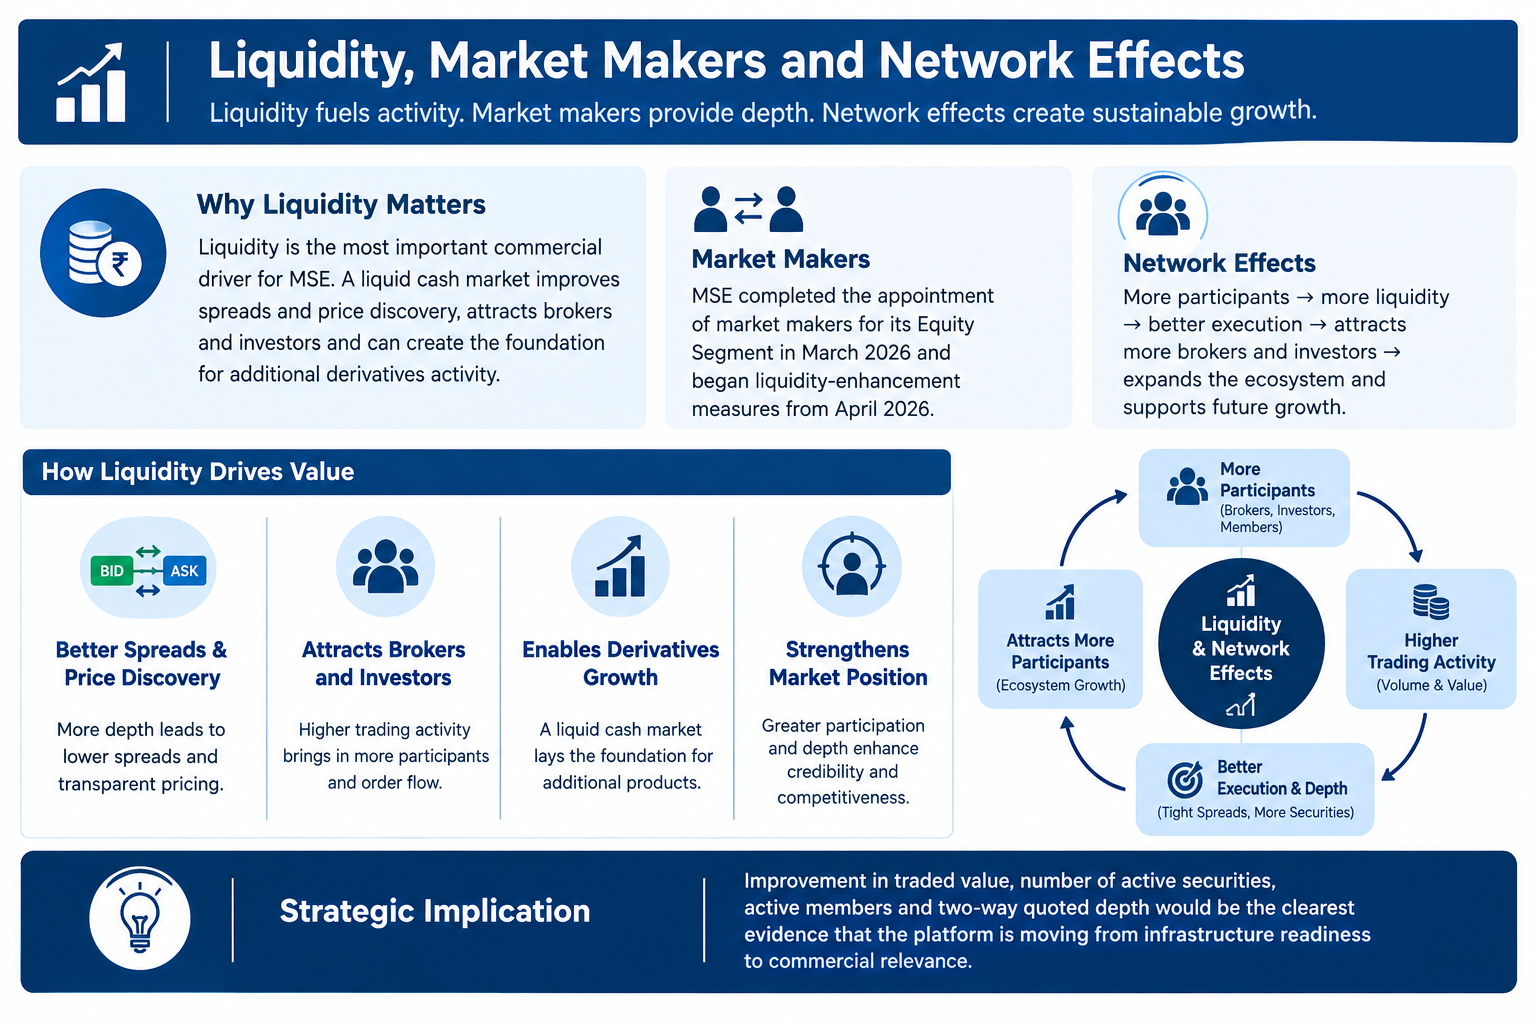
Liquidity is the most important commercial driver for MSE. A liquid cash market improves spreads and price discovery, attracts brokers and investors and can create the foundation for additional derivatives activity
MSE completed the appointment of market makers for its Equity Segment in March 2026 and began liquidity-enhancement measures from April 2026
Strategic implication: improvement in traded value, number of active securities, active members and two-way quoted depth would be the clearest evidence that the platform is moving from infrastructure readiness to commercial relevance
Capital Base and Ecosystem Participation
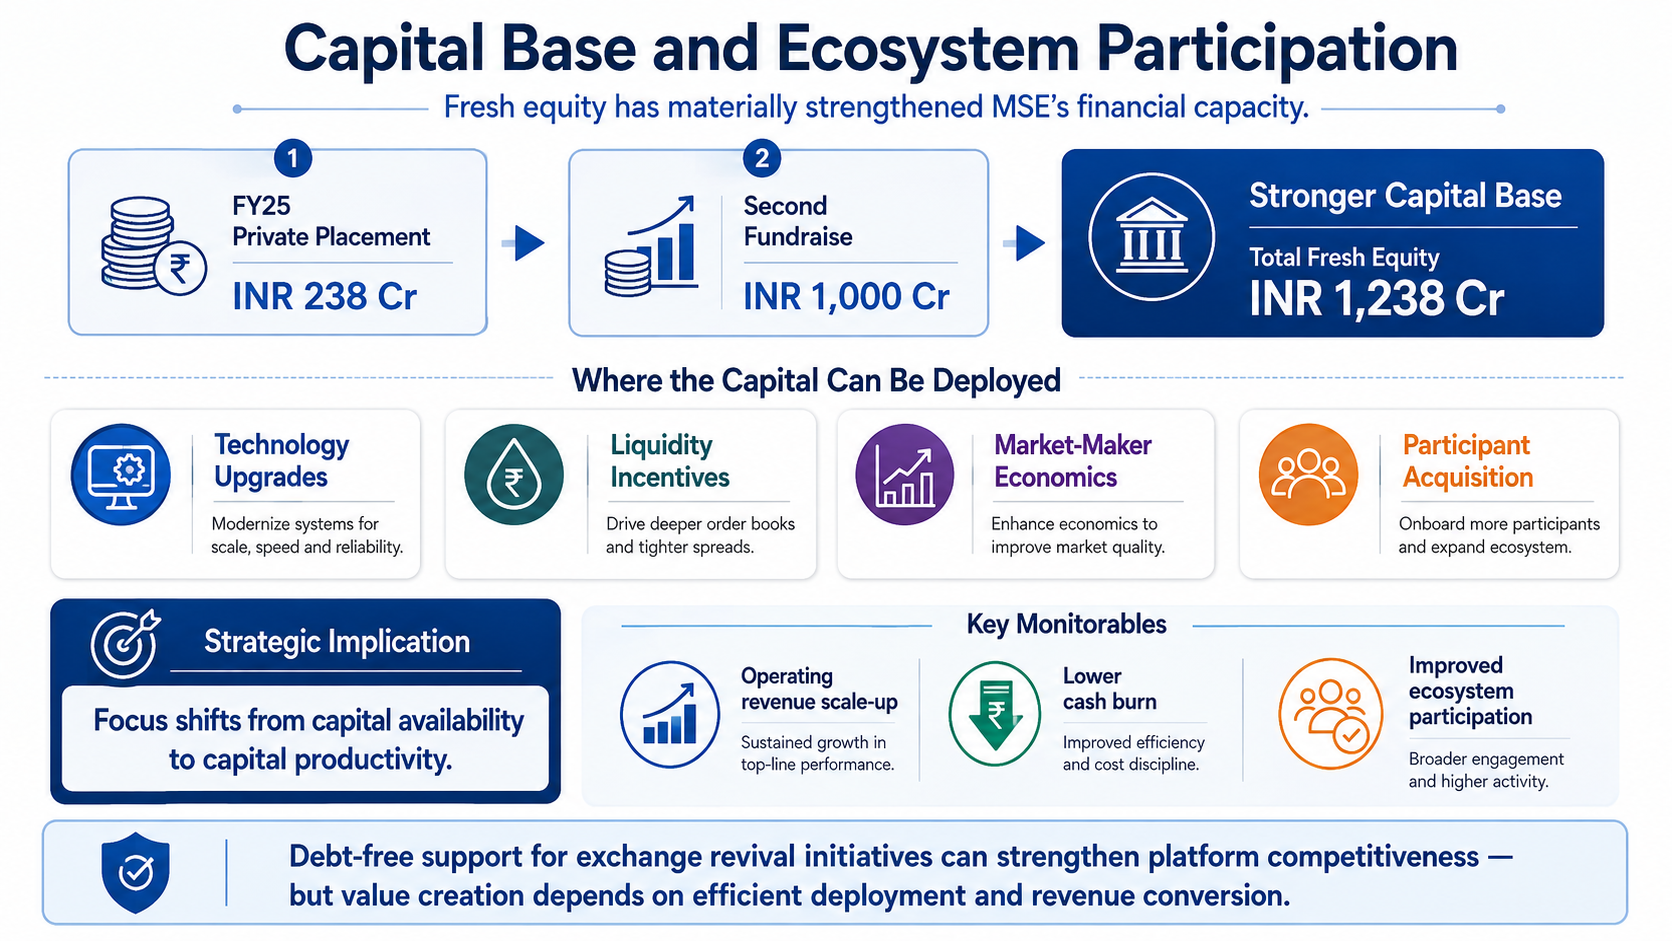
The INR 238 Cr FY25 private placement and the subsequent INR 1,000 Cr second fundraise materially changed MSE's financial capacity
The capital can support technology upgrades, liquidity incentives, market-maker economics and participant acquisition without conventional debt
Strategic implication: the principal question is now capital productivity - whether the enlarged equity base can produce a stepchange in operating revenue and reduce cash burn
Government Policy Support
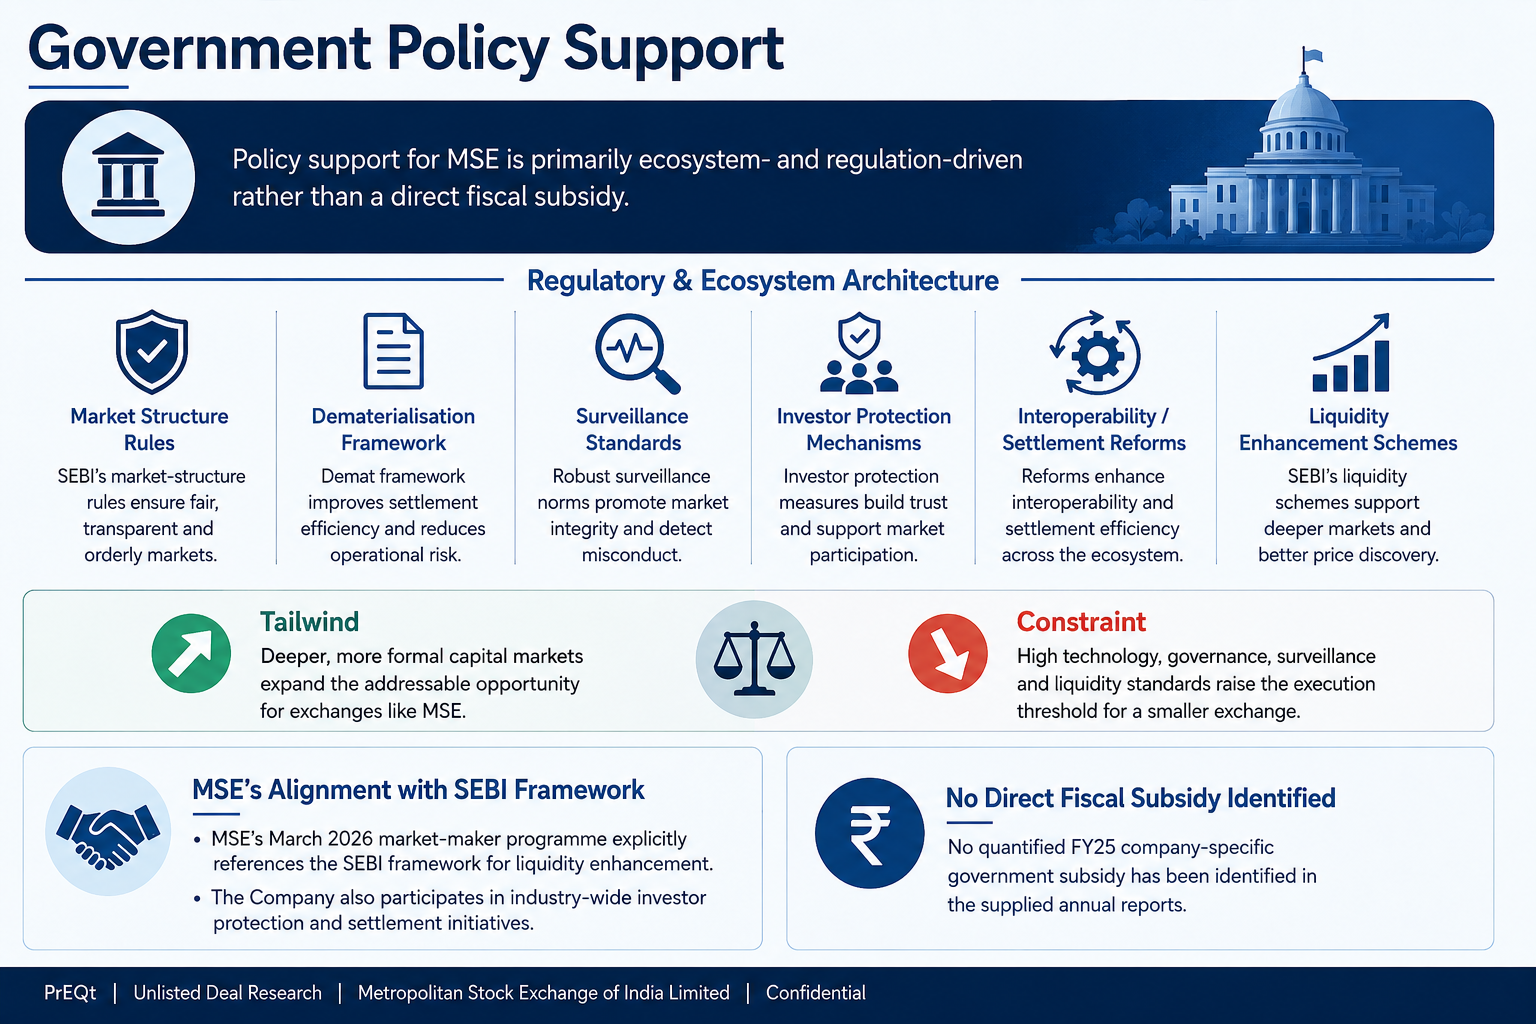
Policy support for MSE is primarily ecosystem- and regulation-driven rather than a direct fiscal subsidy
SEBI's market-structure rules, dematerialisation framework, surveillance standards, investor-protection mechanisms, interoperability / settlement reforms and regulated liquidity-enhancement schemes provide the operating architecture within which exchanges compete
Recent market reforms have included stronger investor-protection and settlement processes, while SEBI has also tightened elements of the equity-derivatives market to reduce excessive retail speculation
For MSE, these measures are both a tailwind and a constraint: deeper formal capital markets expand the addressable opportunity, but high technology, governance, surveillance and liquidity standards raise the execution threshold for a smaller exchange
MSE's March 2026 market-maker programme explicitly references the SEBI framework for liquidity enhancement
- Overview
- Business
- Financial Highlights
- Industry Overview
- Documentation
Get the Preqt App and keep in touch around the clock!
 Monitor your investments in real-time.
- Receive tailored deal suggestions.
- Get real-time updates and alerts.
