

National Commodity and Derivatives Exchange Ltd. (NCDEX)
Commodity Price DiscoveryTrusted Exchange Infrastructure
Unlisted Review and Rating
Speculative
DRHP Not FiledOverall Recommendation
NCDEX holds a strong strategic position in India’s agricultural commodity derivatives market, with ~97% share in its core agri-derivatives segment, an independent Board and a virtually debt-free balance sheet; however, this has not yet translated into sustainable profitability. FY25 PAT of INR 236.1 Cr was largely driven by INR 344.0 Cr of exceptional income, while underlying EBITDA remained negative at ~INR -48.9 Cr, with losses continuing into FY26. The key upside trigger is regulatory normalisation, as revival of major agricultural contracts suspended for over 3.5 years could materially improve trading volumes, revenue and operating leverage
PARAMETER
WEIGHT
SCORE
KEY FACTORS
Financial Performance
25.0%
3.0/5
Revenue recorded a (7.9)% 2-year CAGR, FY25 underlying EBITDA margin stood at (55.4)%, reported PAT margin at 267.7%, D/E at approximately 0.01x, reported ROE at approximately 38.5%, and OCF improved to INR 11.8 Cr from INR (55.4) Cr.
Show more
Detailed Analysis
Revenue from operations declined from INR 103.9 Cr in FY23 to INR 96.4 Cr in FY24 and INR 88.2 Cr in FY25, representing a FY23-FY25 2-year CAGR of -7.9%; FY25 revenue declined 8.5% YoY
Underlying FY25 EBITDA was approximately INR -48.9 Cr, compared with INR -25.2 Cr in FY24; EBITDA margin deteriorated from approximately -26.1% to -55.4%
Reported FY25 PAT was INR 236.1 Cr, resulting in a mechanical PAT margin of approximately 267.7% on operating revenue; however, this was driven by INR 344.0 Cr exceptional income, while pre-exceptional operations recorded a INR -75.0 Cr loss
NCDEX had no conventional financial borrowings in FY25; lease liabilities were approximately INR 9.7 Cr against total equity of INR 750.6 Cr, resulting in adjusted D/E of approximately 0.01x
FY25 PAT of INR 236.1 Cr against average FY24-FY25 consolidated equity of approximately INR 613.3 Cr resulted in reported ROE of approximately 38.5%; the return is materially inflated by exceptional income
Consolidated OCF improved from INR -55.4 Cr in FY24 to INR 11.8 Cr in FY25, turning positive after one negative year
Industry
25.0%
4.0/5
Indian commodity-derivatives notional turnover reached INR 580 Tn in FY25 and nearly doubled YoY, while NCDEX retained approximately 97.0% share in its core agricultural-derivatives niche
Show more
Detailed Analysis
India's commodity-derivatives annual notional turnover reached approximately INR 580 Tn in FY25, nearly doubling YoY; futures turnover increased 37.4% and options notional turnover increased 122.3%
FY25 commodity-derivatives turnover nearly doubled and the notified commodity universe expanded to 104 commodities/variants, supporting a Growth-stage classification
NCDEX is SEBI-regulated and operated through more than 3.5 years of continued suspension of several key agricultural contracts by FY25; FY25 ADTV consequently declined to INR 599.0 Cr from INR 848.0 Cr
NCDEX's exchange operations are predominantly India-focused, with no material international exchange revenue contribution disclosed
Management
25.0%
5.0/5
Leadership experience exceeds 30 years, public-interest/independent directors constituted approximately 71.4% of the Board,
Show more
Detailed Analysis
MD & CEO Arun Raste has 30+ years of experience across BFSI, corporate and social-development sectors, including prior roles with NDDB, NABARD, IDFC First Bank and Kotak Mahindra Bank
FY25 Board comprised 7 Directors, including 5 Public Interest Directors, resulting in approximately 71.4% independent/public-interest representation
Recurring FY25 RPTs were approximately INR 4.4 Cr, equivalent to approximately 4.9% of operating revenue
Valuation Metrics
25.0%
1.0/5
Not Dependable due to high amount of exceptional income
Show more
Detailed Analysis
FY25 reported P/E: 14.2x, is not dependable as its distorted by exceptional income
Current P/B stands at approximately 2.26x, based on post-fundraise net worth and current indicative market capitalization
Indicative 52-week OTC range is approximately INR 262.0-INR 478.0/share, representing a 45.2% peak-to-trough range relative to the high
TOTAL
100%
3.3/5
Weighted Composite Score
Per Share Price
₹390.0
As of 14 Oct 2026
Lot Size
500.0 Shares
Minimum Investment
₹1,95,000.0 / 500 shares
Market Cap. (₹ Cr)
Revenue FY’25
PAT FY’25
P/E Multiple
Face Value
₹ 10.0Offer Price
₹ 378.0Lot Size
500.0 sharesSale Type
Secondary SalePAT FY’25
₹ 236.1 CrPAT Margin (%)
267.7 %P/E Multiple
8.5xCAGR Growth 3Y
-8.6 %ROE (FY’25)
40.0 %ROCE (FY’25)
42.8 %Price to Book Value ratio
2.8xDebt/Equity (FY’25)
0.0xMerchant banker appointed
❌ NoCompany Website
www.ncdex.comDisclaimer: Unlisted shares are unregulated & illiquid. This is NOT investment advice. Please do your own due diligence before investing.
Minimum Investment
₹1,95,000.0 / 500 sharesShares Lot 500 X 1
Investment amount
₹1,95,000.0
Overview
Business
Business Model
Geographical Presence
Sales Channel
Key Risk Factor
Financial Highlights
Income Statement
Revenue growth with EBITDA and PAT margins
| Financial Metric | FY 2023 | FY 2024 | FY 2025 |
|---|---|---|---|
| Revenue (₹ Cr) | 104.0 | 96.4 | 88.2 |
| Growth (%) | -9.9% | -7.2% | -8.5% |
| EBITDA (₹ Cr) | -34.0 | -25.2 | -48.9 |
| EBITDA Margin (%) | -32.8% | -26.1% | -55.4% |
| PAT (₹ Cr) | 42.4 | -27.7 | 236.1 |
| PAT Margin (%) | -40.8% | -28.7% | 267.7% |
OBSERVATIONS & INSIGHTS
Consolidated revenue from operations declined from INR 103.9 Cr in FY23 to INR 88.2 Cr in FY25. Revenue contracted in each of the three years as suspension of several major agricultural contracts constrained transaction activity and transaction-charge income
EBITDA remained negative throughout the period and deteriorated to approximately negative INR 48.9 Cr in FY25. Employee and technology costs create a sizeable fixed-cost base, so lower trading activity has a disproportionate impact on operating profitability
FY25 PAT swung to INR 236.1 Cr from losses in FY23-FY24, but this should not be read as an operating turnaround. Exceptional income of INR 344.0 Cr included INR 139.4 Cr of net profit on the PXIL stake sale and INR 219.0 Cr of fair-value uplift on the retained interest, partly offset by a receivable provision
The FY22-FY25 revenue CAGR is approximately -8.6%. The forward growth thesis therefore depends less on historical trend extrapolation and more on restoration / deepening of commodity liquidity plus successful monetisation of the mutual-fund and planned equity businesses
Balance Sheet
| Financial Metric | FY 2023 | FY 2024 | FY 2025 |
|---|---|---|---|
| EQUITY & LIABILITIES | ₹ 876.0 Cr | ₹ 838.3 Cr | ₹ 1,246.0 Cr |
| Net Worth | ₹ 493.1 Cr | ₹ 476.0 Cr | ₹ 750.6 Cr |
| Share Capital | ₹ 50.7 Cr | ₹ 50.7 Cr | ₹ 50.7 Cr |
| Reserves & Surplus | ₹ 442.4 Cr | ₹ 425.3 Cr | ₹ 699.9 Cr |
| Total Liabilities | ₹ 382.9 Cr | ₹ 362.3 Cr | ₹ 495.4 Cr |
| Current Liabilities | ₹ 355.4 Cr | ₹ 334.2 Cr | ₹ 441.3 Cr |
| Borrowings | ₹ 0.0 Cr | ₹ 0.0 Cr | ₹ 0.0 Cr |
| Trade Payables | ₹ 9.0 Cr | ₹ 9.3 Cr | ₹ 10.5 Cr |
| Other Current Liabilities | ₹ 346.4 Cr | ₹ 324.9 Cr | ₹ 430.8 Cr |
| Non-Current Liabilities | ₹ 27.5 Cr | ₹ 28.1 Cr | ₹ 54.1 Cr |
| Borrowings | ₹ 0.0 Cr | ₹ 0.0 Cr | ₹ 0.0 Cr |
| Other Non-Current Liabilities | ₹ 27.5 Cr | ₹ 28.1 Cr | ₹ 54.1 Cr |
| ASSETS | ₹ 870.3 Cr | ₹ 830.8 Cr | ₹ 1,245.9 Cr |
| Current Assets | ₹ 596.8 Cr | ₹ 618.8 Cr | ₹ 793.5 Cr |
| Trade Receivables | ₹ 31.7 Cr | ₹ 22.9 Cr | ₹ 22.5 Cr |
| Inventory | ₹ 0.0 Cr | ₹ 0.0 Cr | ₹ 0.0 Cr |
| Cash & Cash Equivalents | ₹ 457.5 Cr | ₹ 479.3 Cr | ₹ 655.9 Cr |
| Other Current Assets | ₹ 107.6 Cr | ₹ 116.6 Cr | ₹ 115.1 Cr |
| Non-Current Assets | ₹ 273.5 Cr | ₹ 212.0 Cr | ₹ 452.4 Cr |
| Fixed Assets | ₹ 70.6 Cr | ₹ 61.2 Cr | ₹ 48.9 Cr |
| Other Non-Current Assets | ₹ 202.9 Cr | ₹ 150.8 Cr | ₹ 403.5 Cr |
OBSERVATIONS & INSIGHTS
Total equity increased sharply to INR 750.6 Cr in FY25 from INR 476.0 Cr in FY24, primarily reflecting exceptional gains and retained earnings
Total assets expanded to INR 1,245.9 Cr in FY25 from INR 838.3 Cr in FY24. The increase was concentrated in financial assets, including a large equity-instrument investment balance and higher cash / bank balances rather than conventional fixed-asset expansion.
Cash and bank balances increased from approximately INR 457.5 Cr in FY23 to INR 655.9 Cr in FY25, providing significant liquidity relative to the current liability base
The Group reported no conventional borrowings, which limits balance-sheet leverage risk. However, current liabilities include sizeable member / settlement deposits and other financial liabilities that are integral to exchange and clearing operations and require robust liquidity management
Fixed operating assets declined to approximately INR 48.9 Cr on the stated mapping, while technology and intangible infrastructure remain strategically important. The future equity-segment build will require additional technology, surveillance, compliance and connectivity investment
The FY25 audited balance sheet should not be treated as the current capital structure because 3.90 Cr new shares were allotted in October 2025 at INR 197.34 per share
Cash Flow
| Financial Metric | FY 2023 | FY 2024 | FY 2025 |
|---|---|---|---|
CFO (₹ Cr) Cash generated from core business operations. | -96.9 Cr | -55.4 Cr | +11.8 Cr |
CFI (₹ Cr) Cash used for investments and long-term assets. | +97.1 Cr | +96.0 Cr | +60.2 Cr |
CFF (₹ Cr) Cash flow related to funding and borrowings. | -8.4 Cr | -6.4 Cr | -7.5 Cr |
Working Capital
| Efficiency Metric | FY 2023 | FY 2024 | FY 2025 |
|---|---|---|---|
Debtor Days Average number of days taken to collect customer payments. | - | - | - |
Creditor Days Average time taken to pay suppliers and vendors. | - | - | - |
Inventory Days Average number of days inventory remains unsold. | - | - | - |
CCC (Cash Conversion Cycle) (Debtor Days + Inventory Days - Creditor Days) | - | - | - |
Financial Ratios
Measures the company’s leverage relative to shareholder equity.
OBSERVATIONS & INSIGHTS
The Group carried no conventional financial borrowings across FY23-FY25, resulting in a debt/equity ratio of approximately 0.0x on the stated methodology.
Interest coverage is not meaningful in FY23-FY24 because EBIT was negative. The FY25 ratio appears exceptionally high only because PBT includes large one-off gains; underlying EBITDA remained negative.
ROCE improved from negative levels to 42.8% in FY25, but the change is principally accounting-driven by exceptional income rather than a comparable increase in recurring operating earnings
ROE similarly moved from negative 8.3% in FY23 and negative 5.6% in FY24 to 40.0% in FY25 due to the one-time earnings uplift.
The current ratio remained healthy at roughly 1.7-1.9x across the period, supported by substantial cash, bank balances and treasury investments.
FY25 total equity increased to INR 750.6 Cr from INR 476.0 Cr in FY24, before the subsequent INR 770 Cr preferential allotment completed in October 2025. Post-balance-sheet capitalisation is therefore materially stronger than the FY25 audited balance sheet alone suggests.
Industry Overview
Industry Drivers
Technology and Operating Capability
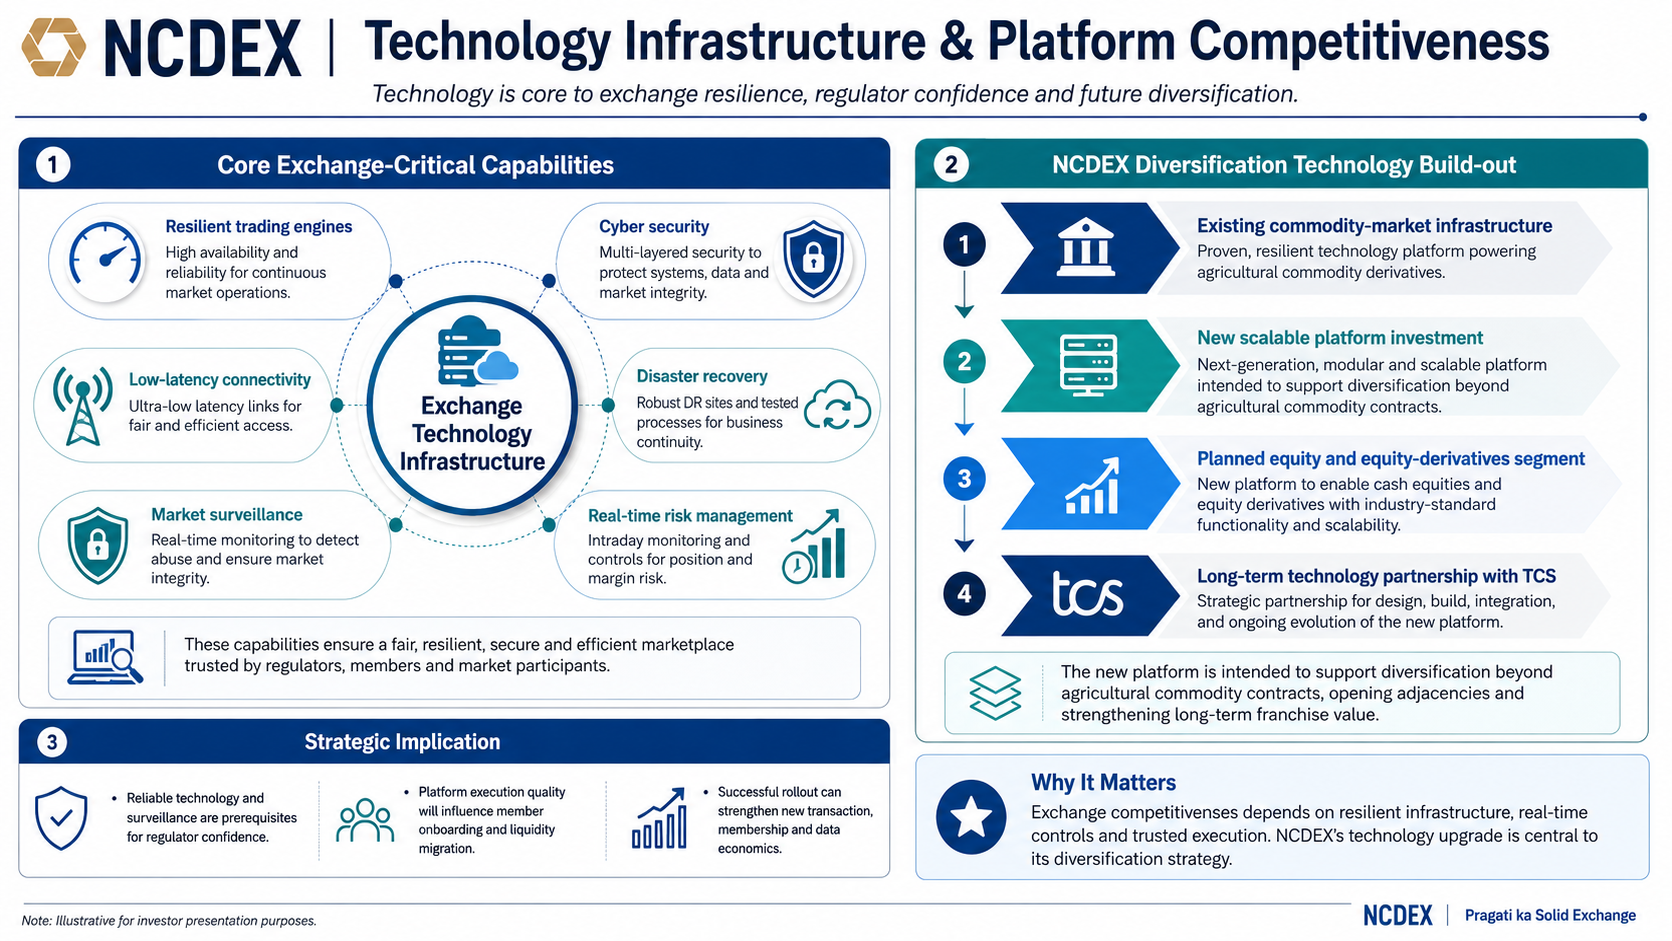
Exchange competitiveness depends on resilient trading engines, low-latency connectivity, surveillance, cyber security, disaster recovery and real-time risk management
NCDEX has historically positioned technology as core infrastructure and is now investing in a new scalable platform for its planned equity and equity-derivatives segment, including a long-term technology partnership with TCS
The reliable technology and surveillance are prerequisites for regulator confidence, member onboarding and liquidity migration; execution quality of the new platform will directly affect the economics of the diversification strategy
Liquidity, Product Breadth and Market Utilisation
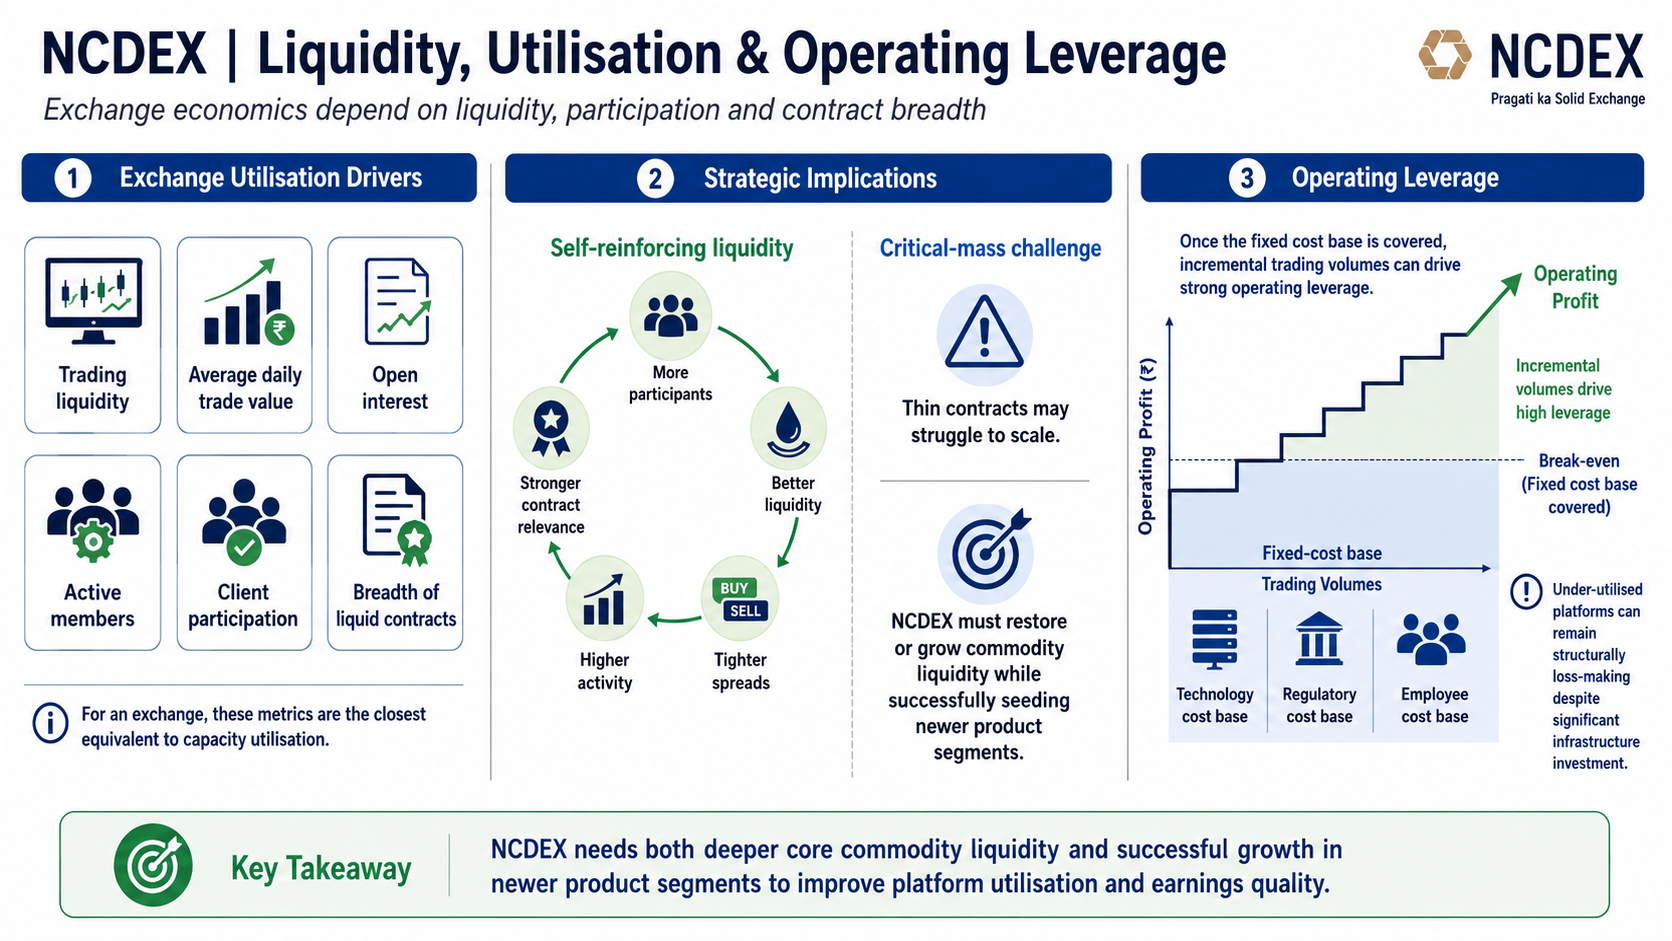
For an exchange, the equivalent of capacity utilisation is trading liquidity, average daily trade value, open interest, active members, client participation and the breadth of liquid contracts
Liquidity tends to be self-reinforcing, but thin contracts can struggle to reach critical mass. NCDEX therefore needs both restoration / growth of commodity liquidity and successful seeding of newer product segments
Incremental trading volumes can carry strong operating leverage once the fixed technology, regulatory and employee cost base is covered, but under-utilised platforms can remain structurally loss-making despite significant infrastructure investment
Geographic and Ecosystem Penetration
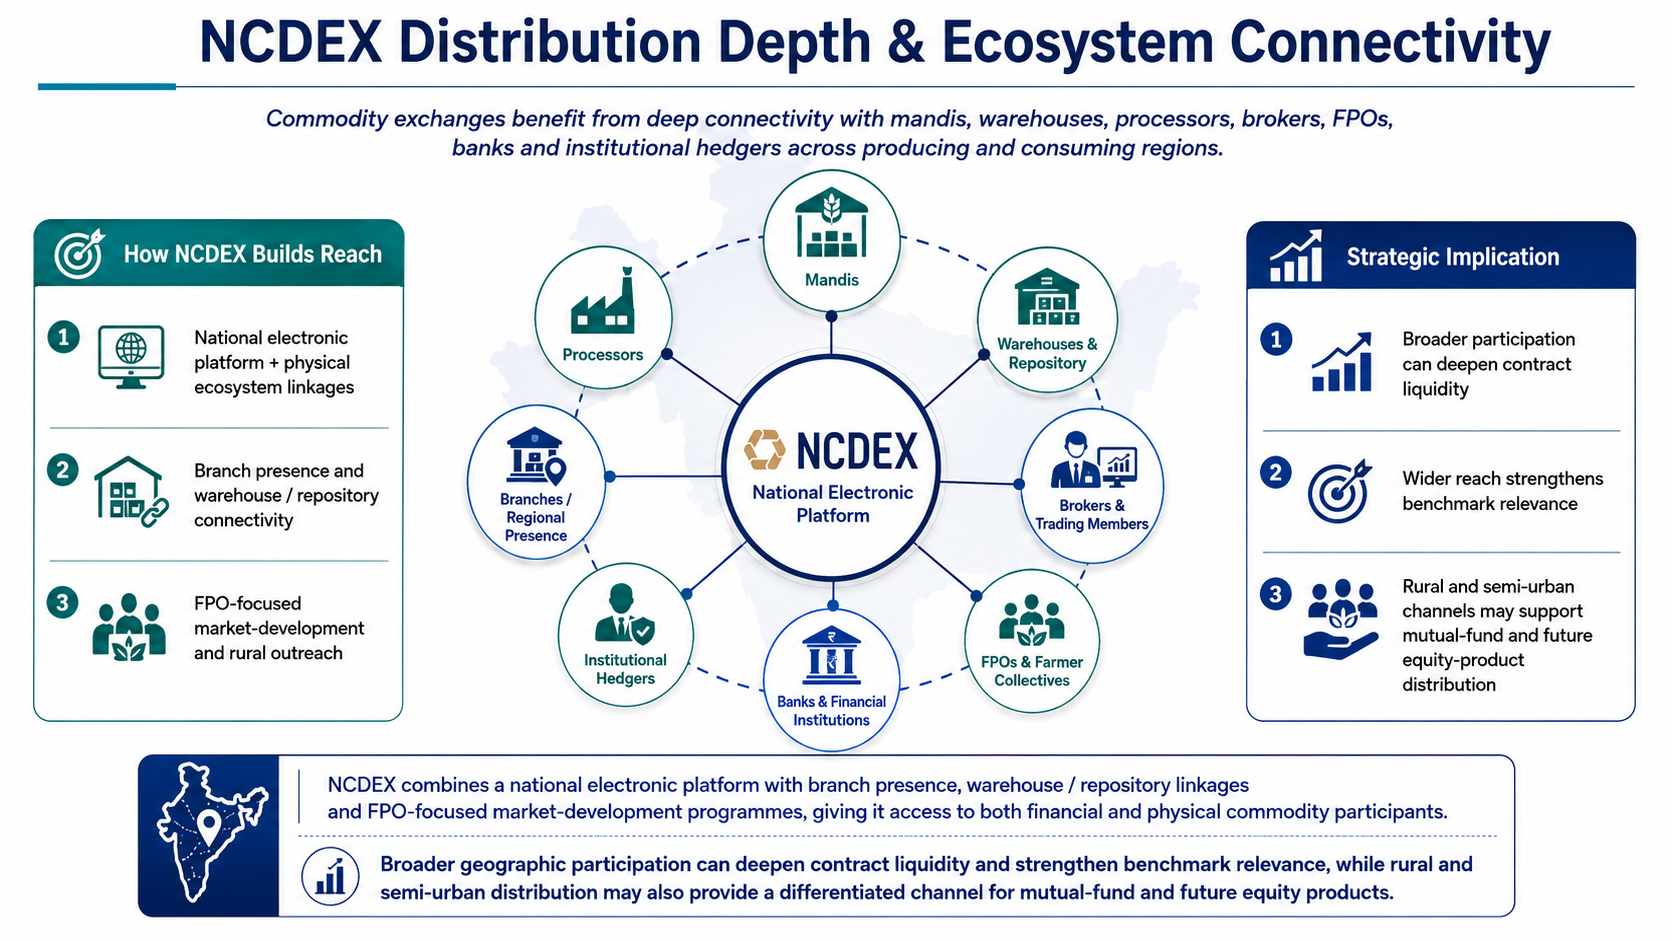
Commodity exchanges benefit from deep connectivity with mandis, warehouses, processors, brokers, FPOs, banks and institutional hedgers across producing and consuming regions
NCDEX combines a national electronic platform with branch presence, warehouse / repository linkages and FPO-focused market-development programmes, giving it access to both financial and physical commodity participants
Broader geographic participation can deepen contract liquidity and strengthen benchmark relevance, while rural and semi-urban distribution may also provide a differentiated channel for mutual-fund and future equity products
Customer Relationship and Revenue Depth
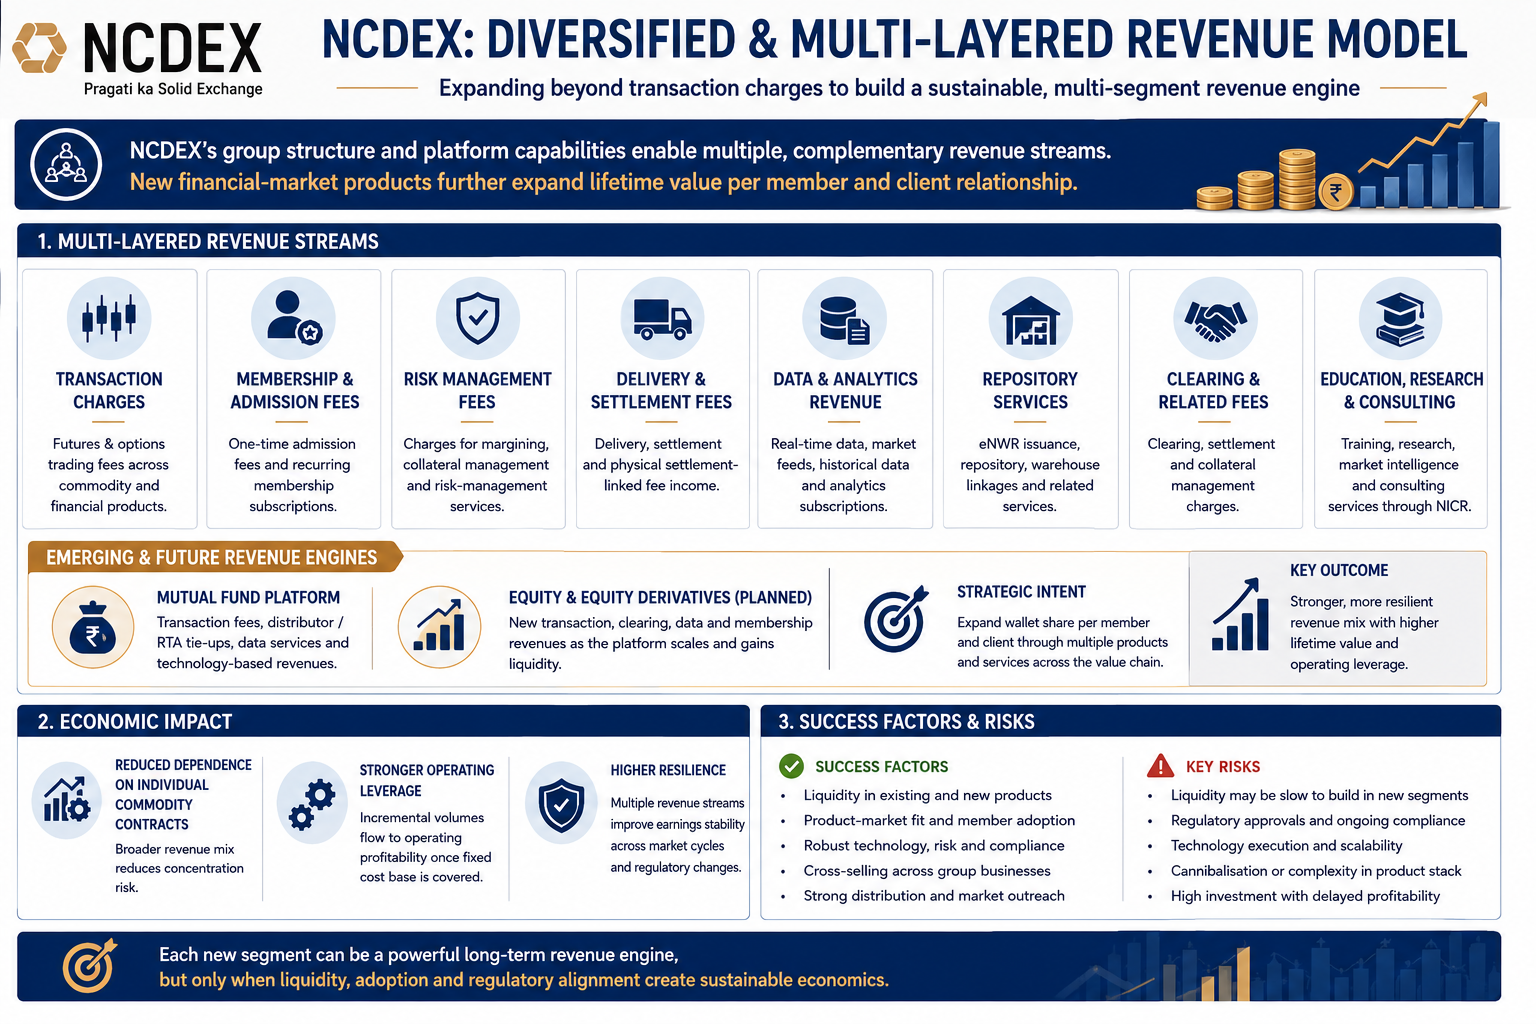
Revenue can extend beyond transaction charges into membership, risk-management and delivery fees, data / analytics, repository services, clearing, technology services, education / consulting and new financial-market products
NCDEX's group structure provides several of these layers, while the mutual-fund and planned equity segments can expand the lifetime revenue opportunity per member and client relationship
Successful cross-segment participation can reduce reliance on individual commodity contracts and improve operating leverage, but each new segment requires liquidity, product-market fit and regulatory compliance before it becomes economically meaningful
Government Policy Support
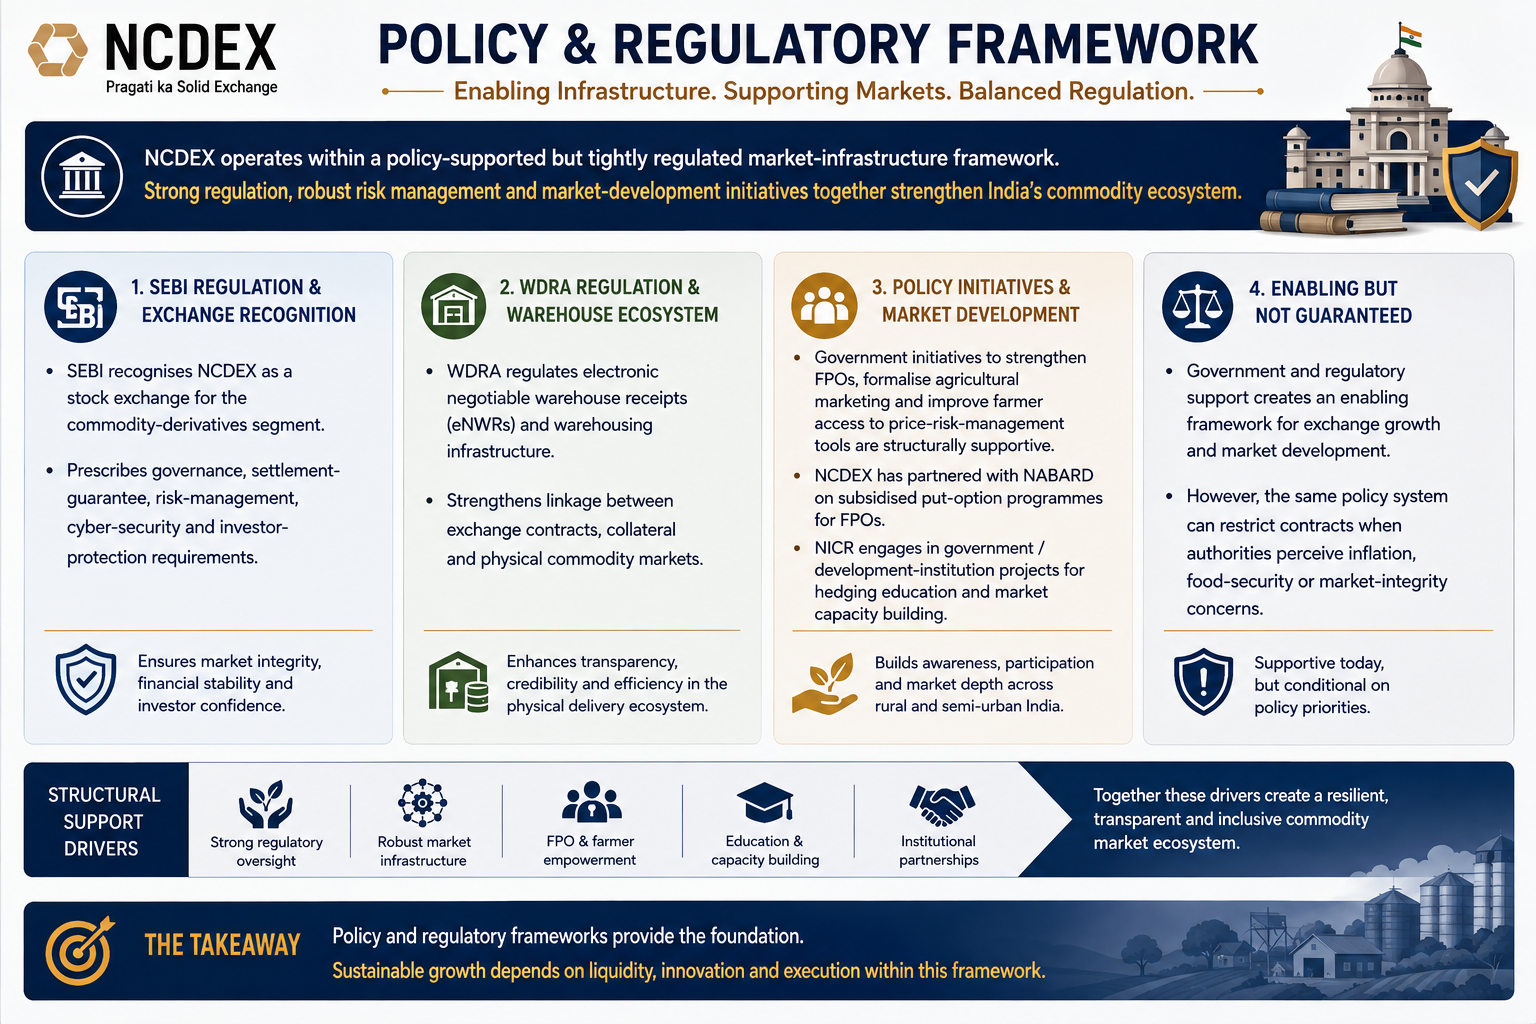
NCDEX operates within a policy-supported but tightly regulated market-infrastructure framework. SEBI recognises NCDEX as a stock exchange for the commodity-derivatives segment and prescribes governance, settlement-guarantee, risk-management, cyber-security and investor-protection requirements.
WDRA regulation of electronic negotiable warehouse receipts and warehousing infrastructure supports the linkage between exchange contracts, collateral and physical commodity markets.
Policy initiatives aimed at strengthening FPOs, formalising agricultural marketing and improving farmer access to price-risk-management tools are structurally supportive. NCDEX has worked with NABARD on subsidised put-option programmes for FPOs, while NICR participates in government / development-institution projects for hedging education and market capacity building.
Government and regulatory support should nevertheless be viewed as an enabling framework rather than a guaranteed financial benefit. The same policy system can restrict contracts when authorities perceive inflation, food-security or market-integrity concerns.
- Overview
- Business
- Financial Highlights
- Industry Overview
- Documentation
Get the Preqt App and keep in touch around the clock!
 Monitor your investments in real-time.
- Receive tailored deal suggestions.
- Get real-time updates and alerts.
