


National Stock Exchange of India (NSE)
Where India InvestsPowering India’s Markets
IPO Summary (PrEqT)
National Stock Exchange of India Limited (NSE) is India's dominant market-infrastructure institution across cash equities, equity derivatives and exchange-traded currency derivatives, supported by integrated clearing, settlement, index, data, connectivity and colocation businesses. As of March 31, 2026, NSE had 129.09 million unique registered investors, 2,978 listed entities with market capitalisation of INR 411.25 trillion, 1,680 colocation member racks and 425 Nifty indices. FY26 revenue from operations was INR 16,601.3 Cr, operating EBITDA INR 11,097.9 Cr and PAT INR 10,302.1 Cr. Revenue declined 3.1% YoY in FY26 as transaction-charge and clearing revenues moderated after regulatory measures reduced trading activity, while data, listing and other operating income partly offset the decline. Despite the softer year, FY24-FY26 revenue CAGR was 6.0% and PAT CAGR 11.4%; normalized operating EBITDA margin remained 76.2% in FY26. The IPO is a pure OFS of 12.64 Cr shares, representing approximately 5.1% of outstanding equity, with no dilution and no fresh capital raised by NSE. At the INR 1,785 cap price, the implied market capitalisation is approximately INR 4.42 lakh Cr, FY26 P/E is 42.9x and P/B is 13.8x.
IPO Review Rating
Buy
MainboardBuilding India’s Financial Future Through Technology, Trust, and Access
NSE business quality is exceptional: dominant market shares approaching monopoly levels in several segments, a 76% normalised EBITDA Margin, ~51% PAT Margin, strong return ratios, negligible financial leverage and substantial structural barriers to entry. The principal concern is regulation rather than competition. NSE's earnings remain heavily dependent on transaction charges—particularly derivatives—and SEBI has demonstrated its ability to materially alter market structure and trading economics. The historic colocation and governance matters also justify a meaningful governance deduction despite the largely completed financial settlement. Valuation is better than it first appears. At 42.9x FY26 earnings, NSE is at a ~21% discount to BSE's 54.3x P/E, while Q1 FY27 annualised earnings reduce the implied multiple to approximately 35.4x. Given NSE's much stronger market leadership, this is a reasonable-to-attractive relative valuation, although BSE currently has the superior RoNW. The main IPO-structure weakness is the 100% OFS. However, only about 5.1% of total shares are being sold, there is no identifiable promoter, and NSE has no obvious requirement for fresh equity capital. Hence, the OFS is less concerning here than it would be in a highly leveraged or promoter-controlled company. The biggest remaining determinant of the final score is now institutional demand.
PARAMETER
WEIGHT
SCORE
KEY FACTORS
Financial Performance
40.0%
4.0/5
NSE demonstrates exceptional profitability, strong cash generation and a debt-light balance sheet, supported by very high EBITDA and PAT margins.
Show more
Detailed Analysis
Revenue increased from INR 14,780.0 Cr in FY24 to INR 16,601.3 Cr in FY26 - ~6.0% CAGR, although FY26 declined 3.1% YoY. Q1 FY27 returned to ~13.1% YoY growth
FY26 Operating EBITDA Margin was 66.9%; Normalised EBITDA Margin was substantially higher at 76.2%
FY26 PAT Margin was an exceptional 51.0%
NSE has effectively negligible conventional financial debt; liabilities are primarily exchange/settlement-related rather than borrowings
FY26 ROE was 33.0%, despite being lower than 44.9% in FY25
FY26 operating cash inflow was ~INR 23,836.2 Cr, well above PAT, although exchange settlement movements make OCF unusually volatile
Transaction charges contribute ~78.7% of Revenue; options alone contribute ~60.2%, creating regulatory/product concentration
Industry
15.0%
3.0/5
NSE operates in a structurally attractive and highly concentrated capital-markets industry, with dominant market shares across cash equities, equity futures, options and clearing.
Show more
Detailed Analysis
India's capital-market ecosystem has a strong structural runway driven by rising investor participation, financialisation, IPO activity and increasing savings allocation to financial assets
Stock exchanges are a mature business globally, but Indian capital-market penetration remains relatively low, supporting continued long-term growth
Competition is extremely concentrated in NSE's favour, with ~93% cash-market share, ~99.8% equity-futures share and ~74.7% options premium share
Regulatory risk is high, as NSE is a systemically important market infrastructure institution subject to continuous SEBI supervision and product-level regulation
Management
15.0%
4.0/5
Management quality and Board composition are strong, with an experienced leadership team and a Governing Board dominated by Public Interest Directors.
Show more
Detailed Analysis
Management quality is strong, led by Ashishkumar Chauhan, who has extensive exchange and technology experience and previously served as MD & CEO of BSE
Governance structure is robust, with 12 Directors comprising 7 Public Interest Directors and 5 Non-Independent Directors
The biggest governance concern is NSE's historic colocation, dark-fibre and governance-related regulatory proceedings, despite substantial financial settlement of these matters
RPTs are disclosed as arm's length and regulated, though loans and guarantees involving group entities warrant continued monitoring
NSE has no identifiable promoter; only ~5.1% of outstanding shares are being sold despite the IPO being entirely OFS, limiting exit-related concern
Valuation
20.0%
4.0/5
The IPO appears reasonable to attractive on relative valuation, though not cheap in absolute terms
Show more
Detailed Analysis
NSE trades at ~42.9x FY26 earnings versus BSE at 54.3x, implying approximately a 21% discount to its closest listed peer
EV/EBITDA ~23.4x, above available peer benchmarks
Historical P/B ~12.4x
FY26 RoNW of 32.6%
Merchant Banker Track Record
10.0%
5.0/5
The IPO is backed by an exceptionally strong, top-tier merchant-banking consortium including major Indian and global investment banks.
Show more
Detailed Analysis
This is a top-tier merchant-banking consortium, including Kotak, JM Financial, Morgan Stanley, Citi, HSBC, J.P. Morgan, Axis, IIFL, Nuvama and others
The consortium includes several highly experienced IPO managers with strong execution history across large Indian offerings
The syndicate has deep institutional and retail distribution capability, important for an unusually large ~INR 22,562 Cr issue
Multiple BRLMs have extensive mainboard IPO execution experience, reducing execution risk materially
TOTAL
100%
4.0/5
Weighted Composite Score
Issue Price
₹1700.0 to ₹1785.0
As of 14 Sep 2026
GMP
₹210.0
As of 14 Sep 2026
Estimated Gain / Loss
+11.8%
Lot Size
8.0 Shares
Grey Market Premium (GMPs) are shared for knowledge purpose only. PrEqt doesn’t promote or execute the trades.
| Issue Size (in Cr) | |
|---|---|
| Overall | ₹22,562.0 Cr |
| Fresh Issue | ₹0.0 Cr |
| Offer for Sale | ₹22,562.0 Cr |
Minimum Investment
₹14,280.0 / 64 shares

Merchant Banker
Kotak Mahindra Capital Co.Ltd., JM Financial, Morgan Stanley, Citi Bank, HSBC, JP Morgan
Kotak Mahindra Capital Co.Ltd.
JM Financial
Morgan Stanley, Citi Bank, HSBC
JP Morgan
IPO Document
Offer Start Date
Offer End Date
Valuation
Revenue (FY'26)
PAT (FY'26)
Issue Size (in Cr)
Face Value
₹ 1.0Lot Size
8.0 sharesSale Type
OFS onlyPAT (FY'26)
₹ 10,302.1 CrPAT Margin (FY'26)
51.0 %EBITDA (FY'26)
₹ 11,097.9 CrCAGR Growth 2Y
6.0 %ROE (FY'26)
33.0 %ROCE (FY'26)
42.8 %Price to Book Value
12.4xCompany Website
www.nseindia.comExplore new deals
Overview
Fund Allocation
Total: ₹0 CrSource:Company DRHP
Timeline
IPO Open Date
To Be Announced
IPO Close Date
To Be Announced
Tentative Allotment
To Be Announced
Initiation of Refunds
To Be Announced
Credit of Shares to Demat
To Be Announced
Tentative Listing Date
To Be Announced
Business
Business Model
Geographical Presence
Sales Channel
Key Risk Factor
Financial Highlights
Income Statement
Revenue growth with EBITDA and PAT margins
| Financial Metric | FY 2024 | FY 2025 | FY 2026 |
|---|---|---|---|
| Revenue (₹ Cr) | 16,352.1 | 19,176.8 | 18,713.4 |
| Growth (%) | - | 16.0% | -3.1% |
| EBITDA (₹ Cr) | 9,869.8 | 12,646.9 | 11,097.9 |
| EBITDA Margin (%) | 66.8% | 73.8% | 66.9% |
| PAT (₹ Cr) | 8,305.7 | 12,187.7 | 10,302.1 |
| PAT Margin (%) | 47.1% | 55.3% | 51.0% |
OBSERVATIONS & INSIGHTS
Revenue FY25 grew strongly, but FY26 declined 3.1% as transaction charges and clearing / settlement revenue decreased. The RHP attributes the transaction decline to lower ADTV in cash, futures and options following regulatory measures, partly offset by data-feed and other operating-income growth
EBITDA reported FY26 EBITDA declined 12.3% and margin returned to 66.9%. Reported margin was affected by regulatory / one-time items; normalized EBITDA declined more moderately and normalized margin remained 76.2%
PAT FY26 PAT declined 15.5% from FY25. FY25 included exceptional disposal gains, while FY26 included the substantial SEBI-related provision and lower transaction activity. FY24-FY26 PAT CAGR nevertheless remained 11.4%
Balance Sheet
| Financial Metric | FY 2024 | FY 2025 | FY 2026 |
|---|---|---|---|
| Net Worth | ₹ 23,973.9 Cr | ₹ 30,353.3 Cr | ₹ 32,113.5 Cr |
| Total Assets | ₹ 65,464.0 Cr | ₹ 69,466.6 Cr | ₹ 87,937.4 Cr |
| Total Borrowing | ₹ 0.0 Cr | ₹ 0.0 Cr | ₹ 0.0 Cr |
| Reserves & Surplus | ₹ 23,924.9 Cr | ₹ 30,105.8 Cr | ₹ 31,866.0 Cr |
OBSERVATIONS & INSIGHTS
PPE rose steadily as NSE invested in exchange and technology infrastructure; FY26 CWIP increased sharply to INR 173.2 Cr, indicating projects under implementation
Trade receivables rose to INR 2,468.2 Cr in FY26
Total Equity increased from INR 23,973.9 Cr in FY24 to INR 32,113.5 Cr in FY26; FY25 share capital increased after the 4:1 bonus issue, which did not itself increase total equity
Cash / bank balances expanded materially in FY26, but a large portion of cash includes settlement obligations / member margins and should not be treated as unrestricted corporate cash
Cash Flow
| Financial Metric | FY 2023 | FY 2024 | FY 2025 |
|---|---|---|---|
CFO (₹ Cr) Cash generated from core business operations. | +29,744.3 Cr | +4,091.5 Cr | +23,836.2 Cr |
CFI (₹ Cr) Cash used for investments and long-term assets. | -8,463.0 Cr | -5,431.0 Cr | -45.9 Cr |
CFF (₹ Cr) Cash flow related to funding and borrowings. | -3,993.7 Cr | -4,599.7 Cr | -8,808.9 Cr |
Working Capital
| Efficiency Metric | FY 2023 | FY 2024 | FY 2025 |
|---|---|---|---|
Debtor Days Average number of days taken to collect customer payments. | - | - | - |
Creditor Days Average time taken to pay suppliers and vendors. | - | - | - |
Inventory Days Average number of days inventory remains unsold. | - | - | - |
CCC (Cash Conversion Cycle) (Debtor Days + Inventory Days - Creditor Days) | - | - | - |
Financial Ratios
Measures the company’s leverage relative to shareholder equity.
OBSERVATIONS & INSIGHTS
ROE remained very high but declined to 33.0% in FY26 as reported PAT reduced while the equity base expanded
ROCE followed the same pattern, moderating to 42.8% in FY26 from 52.1% in FY25 but remaining strong for an asset-light market-infrastructure model
ROA fell to 11.7% because FY26 assets increased materially, including settlement-related cash / financial balances, while PAT declined
Current Ratio remains above 1.0x, but interpretation is limited because current assets and current liabilities include large member-margin and settlement obligations that are pass-through market-infrastructure balances
Industry Overview
Industry Drivers
Financialisation of Household Savings and Rising Investor Participation
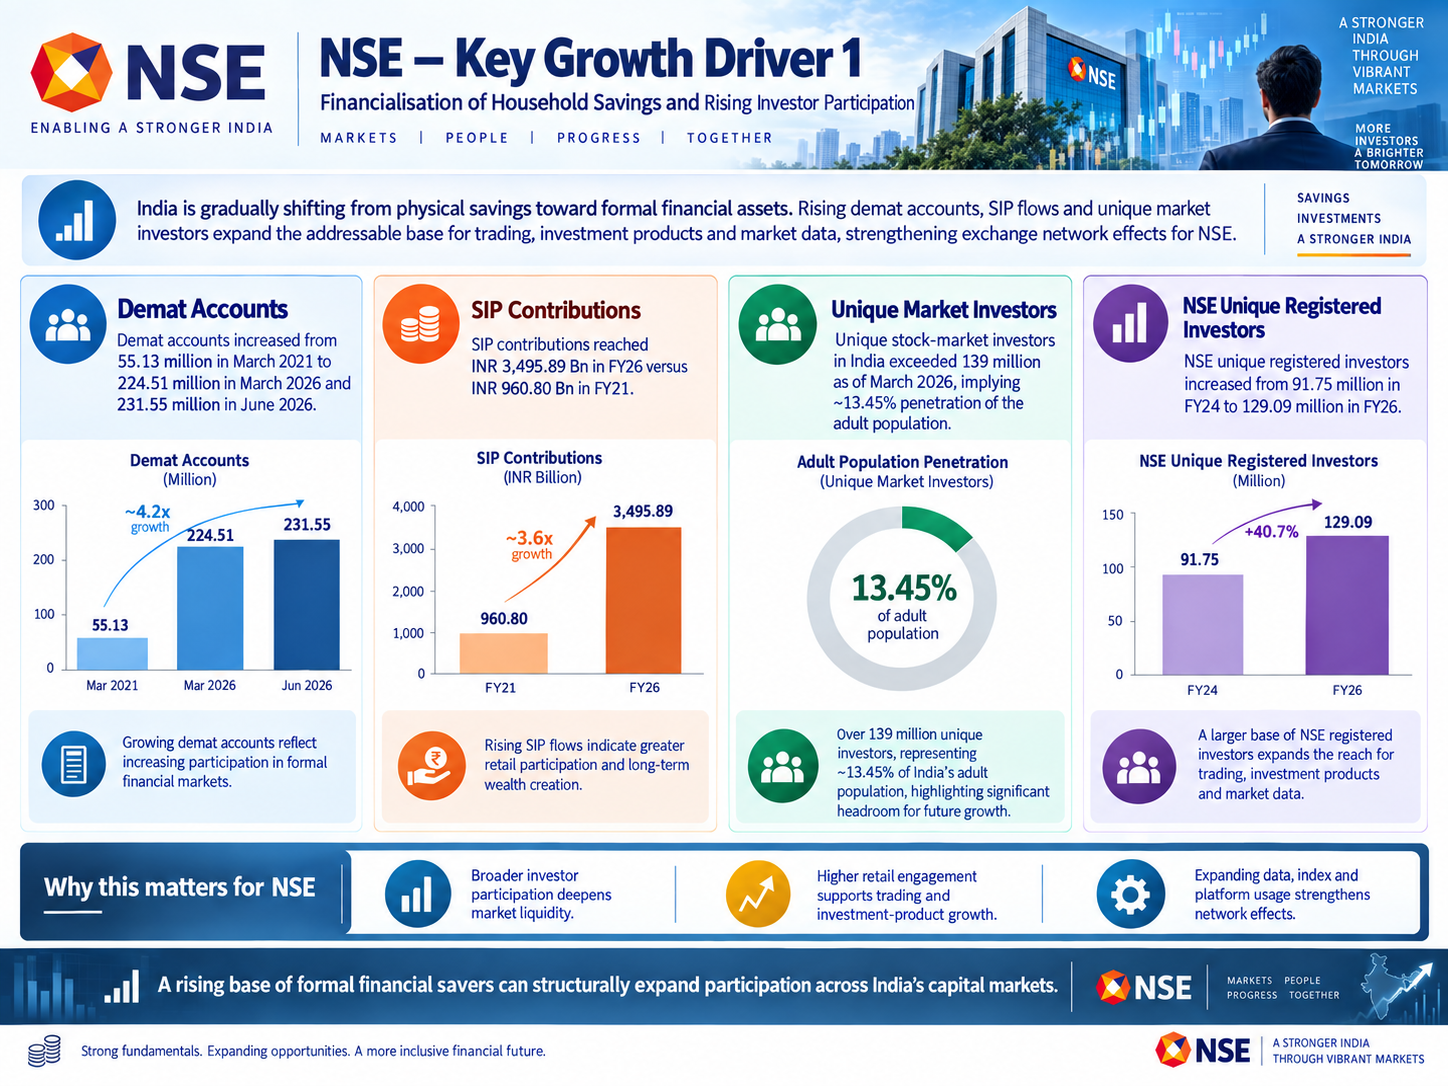
India is moving gradually from physical savings toward formal financial assets. More demat accounts, SIP flows and unique market investors expand the addressable base for trading, investment products and market data, strengthening exchange network effects.
The key drivers are:
Demat accounts increased from 55.13 million in March 2021 to 224.51 million in March 2026 and 231.55 million in June 2026
Unique stock-market investors in India exceeded 139 million as of March 2026, implying approximately 13.45% penetration of the adult population
SIP contributions reached INR 3,495.89 Bn in FY26 versus INR 960.80 Bn in FY21
NSE unique registered investors increased from 91.75 million in FY24 to 129.09 million in FY26
Capital Formation, Listings and Institutional Market Depth
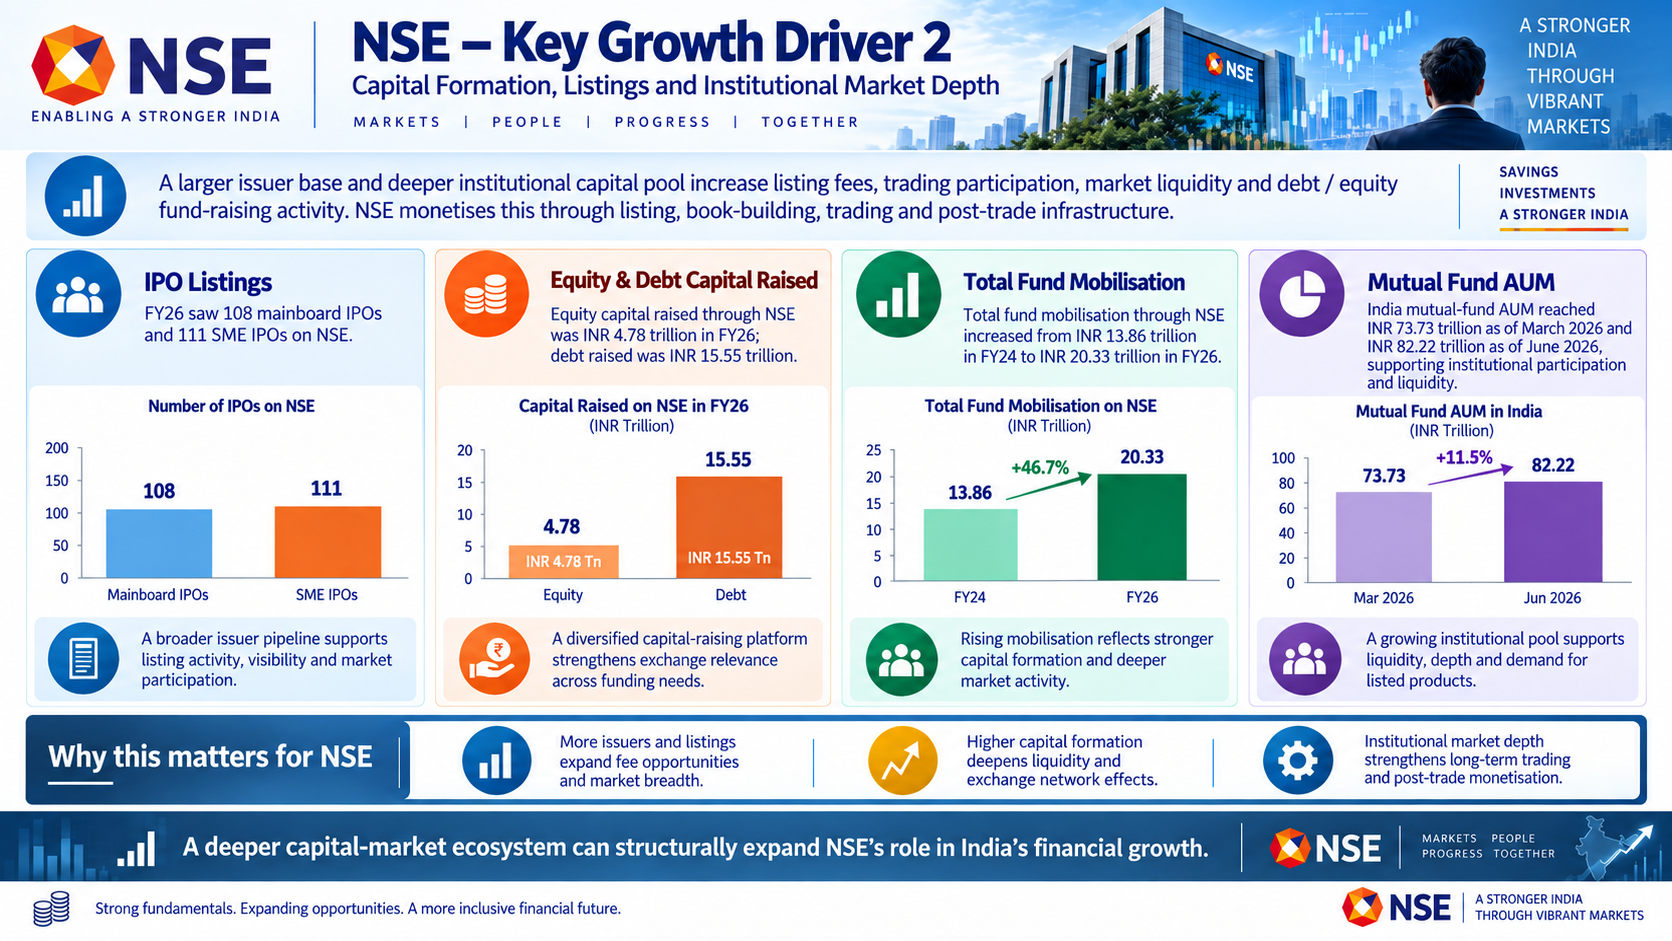
A larger issuer base and deeper institutional capital pool increase listing fees, trading participation, market liquidity and debt / equity fund-raising activity. NSE monetises this through listing, book-building, trading and post-trade infrastructure.
The key drivers are:
FY26 saw 108 mainboard IPOs and 111 SME IPOs on NSE
Equity capital raised through NSE was INR 4.78 trillion in FY26; debt raised was INR 15.55 trillion
Total fund mobilisation through NSE increased from INR 13.86 trillion in FY24 to INR 20.33 trillion in FY26
India mutual-fund AUM reached INR 73.73 trillion as of March 2026 and INR 82.22 trillion as of June 2026, supporting institutional participation and liquidity
Liquidity Leadership and Self-Reinforcing Exchange Network Effects
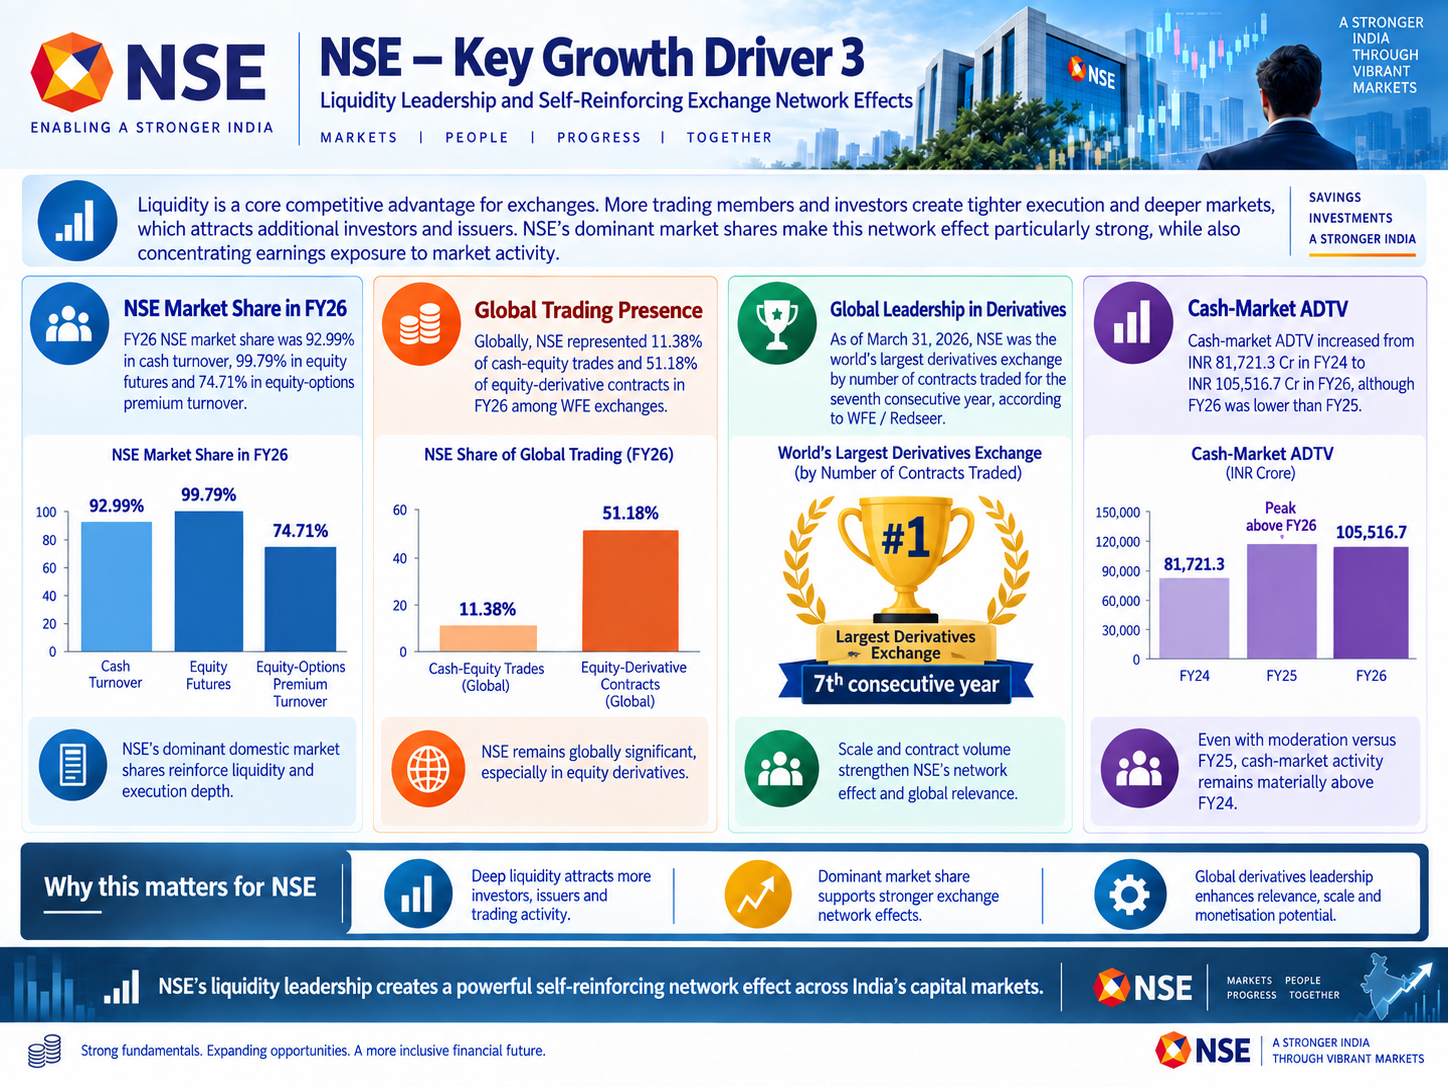
Liquidity is a core competitive advantage for exchanges. More trading members and investors create tighter execution and deeper markets, which attracts additional investors and issuers. NSE's dominant market shares make this network effect particularly strong, while also concentrating earnings exposure to market activity.
The key drivers are:
FY26 NSE market share was 92.99% in cash turnover, 99.79% in equity futures and 74.71% in equity-options premium turnover
Globally, NSE represented 11.38% of cash-equity trades and 51.18% of equity-derivative contracts in FY26 among WFE exchanges
As of March 31, 2026, NSE was the world's largest derivatives exchange by number of contracts traded for the seventh consecutive year, according to WFE / Redseer
Cash-market ADTV increased from INR 81,721.3 Cr in FY24 to INR 105,516.7 Cr in FY26, although FY26 was lower than FY25
Risks in the Industry
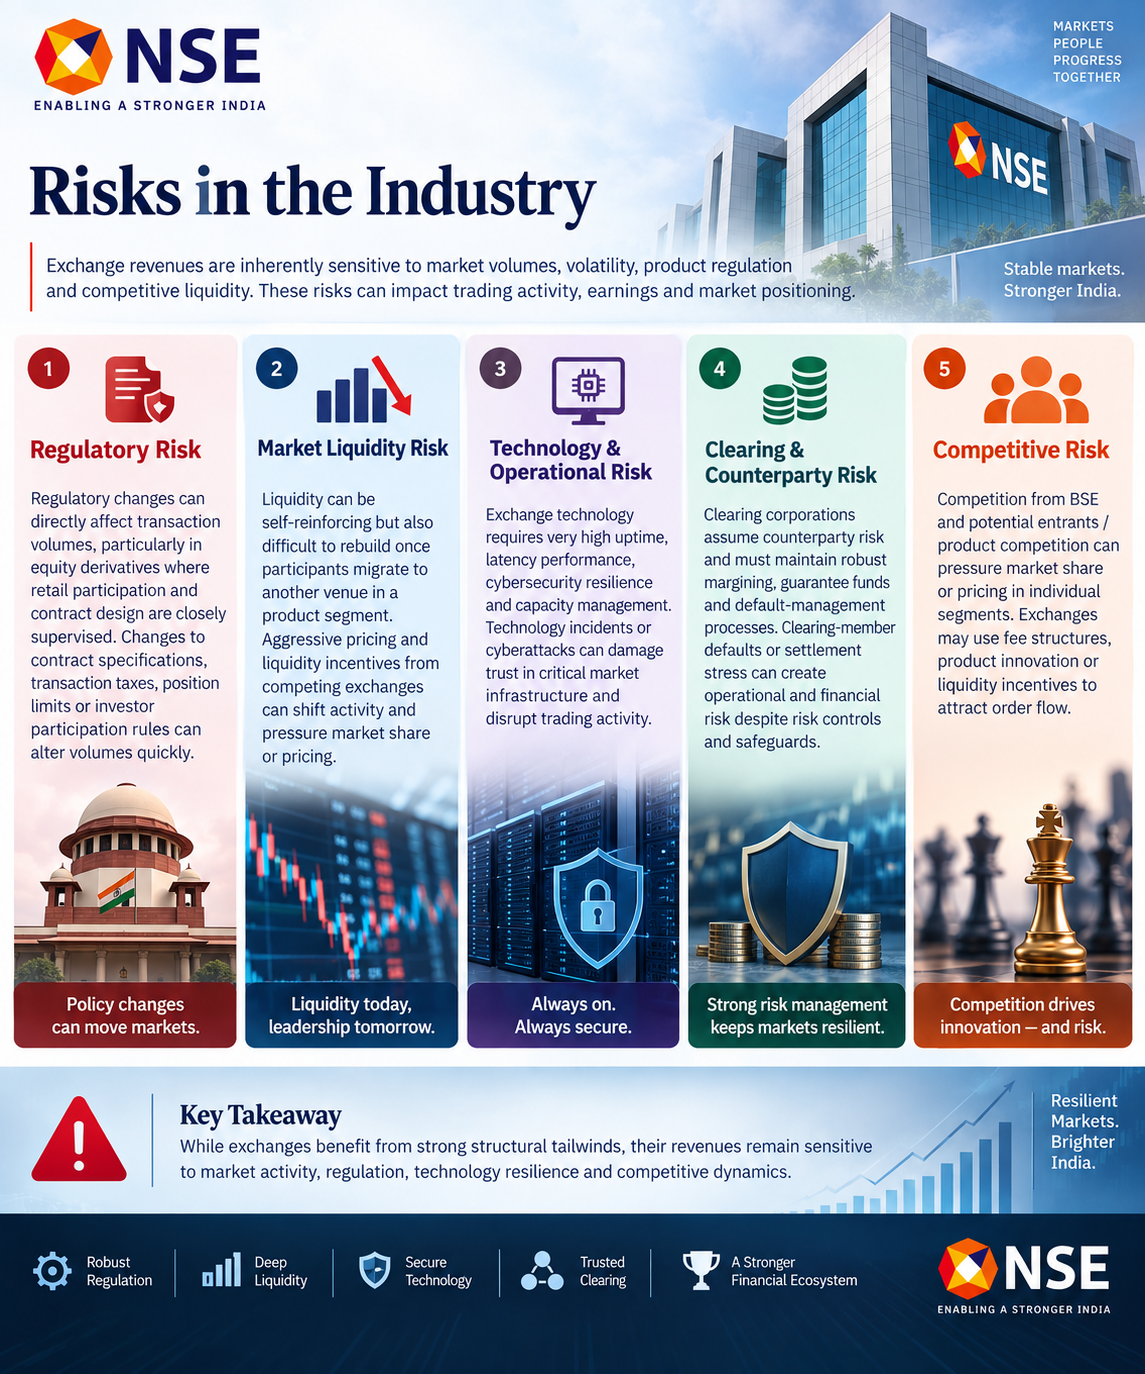
Exchange revenues are inherently sensitive to market volumes, volatility, product regulation and competitive liquidity. Regulatory changes to derivatives, contract specifications, transaction taxes, position limits or investor participation can alter volumes quickly. Technology incidents or cyberattacks can damage trust in critical market infrastructure, while aggressive pricing and liquidity incentives from competing exchanges can shift activity in specific products.
The key risks are:
Regulatory changes can directly affect transaction volumes, particularly in equity derivatives where retail participation and contract design are closely supervised
Liquidity can be self-reinforcing but also difficult to rebuild once participants migrate to another venue in a product segment
Exchange technology requires very high uptime, latency performance, cybersecurity resilience and capacity management
Clearing corporations assume counterparty risk and must maintain robust margining, guarantee funds and default-management processes
Government Policy Support
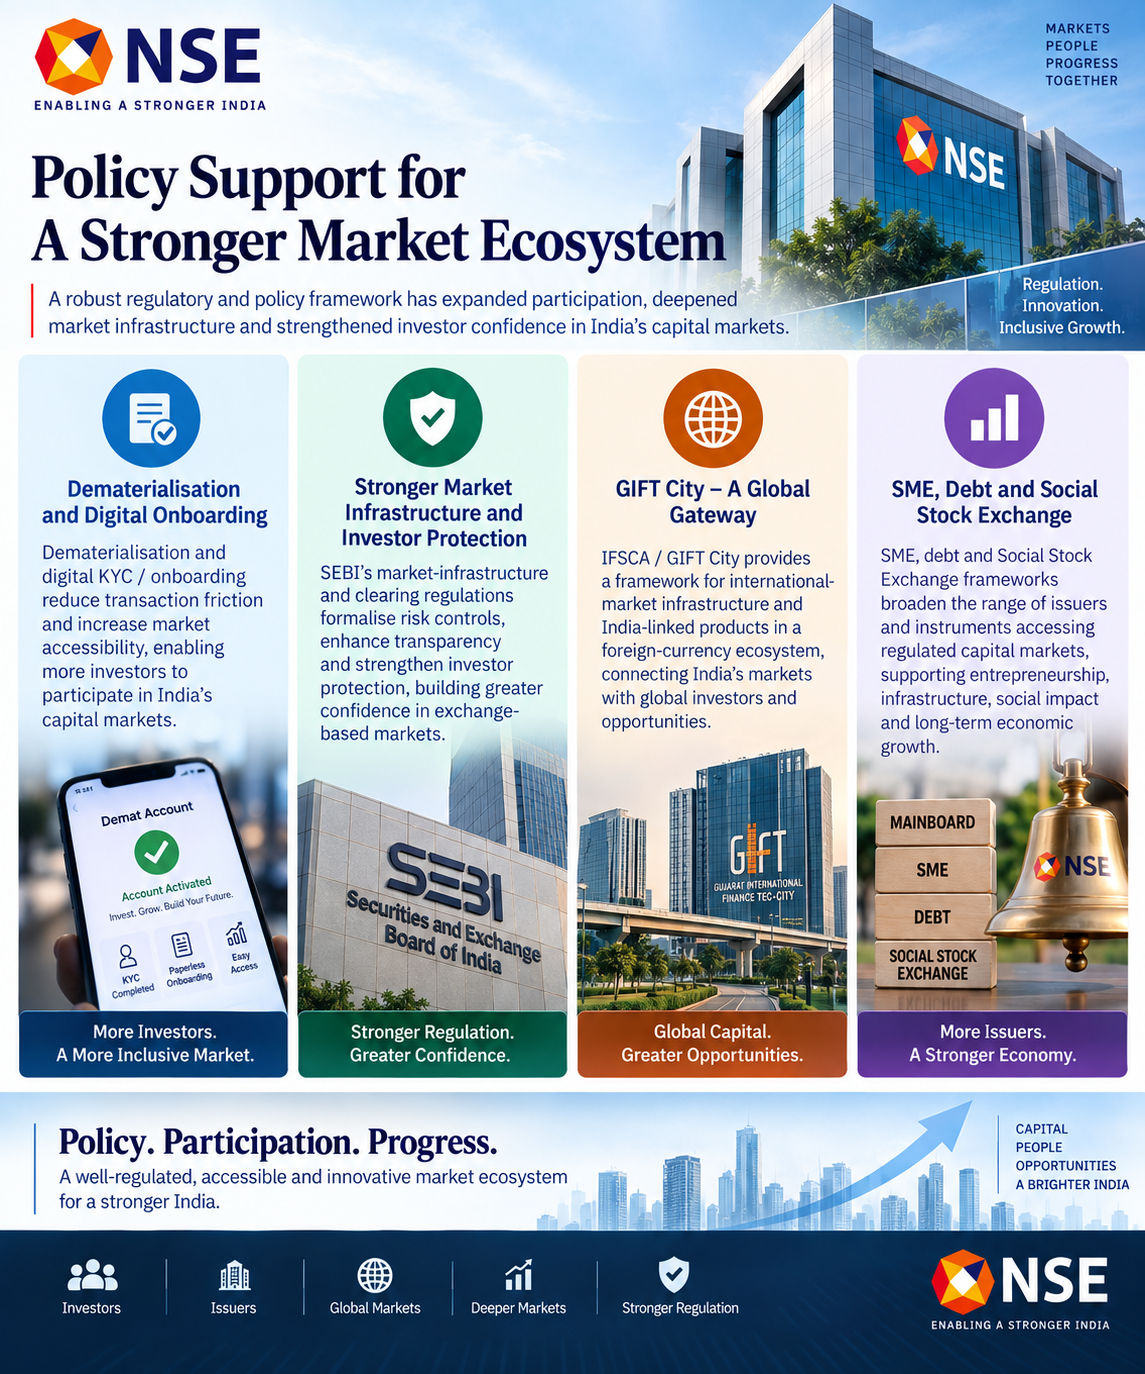
Policy support for exchanges is primarily structural rather than subsidy-based. SEBI-led dematerialisation, digital onboarding, stronger clearing and settlement frameworks, investor-protection mechanisms and regulated primary-market processes have increased transparency and participation. GIFT City / IFSCA provides a framework for internationally oriented India-linked products, while SME and Social Stock Exchange platforms broaden access to capital formation.
The key policies are:
Dematerialisation and digital KYC / onboarding reduce transaction friction and increase market accessibility
SEBI market-infrastructure and clearing regulations formalise risk controls and strengthen confidence in exchange-based markets
IFSCA / GIFT City enables international-market infrastructure and India-linked products in a foreign-currency ecosystem
SME, debt and Social Stock Exchange frameworks broaden the range of issuers and instruments accessing regulated capital markets
Fundraise/Future Plans
Shareholding
Pre-issue shareholding
Promoter Holding 0.0%
Post-Issue Shareholding
Promoter Holding 0.0%
Category
Pre-Issue%Post-Issue%
Promoters
State Bank of India
3.2%2.6%
Canada Pension Plan Investment Board
1.6%1.1%
Aranda Investments (Mauritius) Pte Ltd
4.5%4.1%
MS Strategic (Mauritius) Limited
1.2%0.8%
The New India Assurance Company Ltd.
1.4%1.0%
SBI Capital Markets Limited
4.3%4.0%
Bank of Baroda
0.9%0.6%
Stock Holding Corporation of India Limited
4.4%4.2%
Total Promoter Holding
21.5%18.4%
Additional Shareholders
0.0%0.0%
Total Additional Holding
0.0%0.0%
Total Shareholding
21.5%18.4%
Existing Investor
- Overview
- Business
- Financial Highlights
- Industry Overview
- Fundraise/Future Plans
- Documentation
Get the Preqt App and keep in touch around the clock!
 Monitor your investments in real-time.
- Receive tailored deal suggestions.
- Get real-time updates and alerts.
