


Nayara Energy Limited
Oil RefineryDownstream Major Player
Unlisted Review Rating
Average
DRHP Not FiledConnecting Communities and Businesses Through Dependable Energy Solutions
Nayara Energy is a strategically important downstream-energy company with approximately 7.7% of India’s installed refining capacity, a large private fuel-retailing network and significant export exposure.
PARAMETER
WEIGHT
SCORE
KEY FACTORS
Financial Performance
25.0%
2.0/5
Revenue declined moderately, but EBITDA and PAT fell much more sharply, demonstrating the sensitivity of the business to gross refining margins, crude sourcing economics, inventory effects and product cracks.
Show more
Detailed Analysis
Consolidated revenue increased from INR 138,112.5 Cr in FY23 to INR 149,217.4 Cr in FY25, representing a 2-year CAGR of 3.9%. Revenue declined by 3.8% in FY25, from INR 155,091.5 Cr in FY24
EBITDA declined from INR 20,669.8 Cr in FY24 to INR 12,294.6 Cr in FY25, representing a decline of 40.5%. EBITDA margin contracted from 13.3% to 8.2%, reflecting weaker refining economics and operating profitability
Consolidated PAT declined from INR 12,321.0 Cr in FY24 to INR 6,079.5 Cr in FY25, representing a decline of 50.7%. PAT margin decreased from 7.9% to 4.1%
Borrowings and lease liabilities increased from INR 13,495.6 Cr in FY24 to INR 14,318.1 Cr in FY25. However, growth in equity from INR 43,491.0 Cr to INR 50,010.2 Cr reduced debt-to-equity from approximately 0.3x to 0.3x, based on an unrounded FY25 ratio of 0.29x
FY25 PAT of INR 6,079.5 Cr, against average FY24–FY25 equity of INR 46,750.6 Cr, resulted in an ROE of 13.0%. The return was materially affected by the decline in FY25 profitability
Operating cash flow remained positive but declined by 11.8%, from INR 3,455.4 Cr in FY24 to INR 3,047.8 Cr in FY25. Cash generation was affected by a reduction of INR 9,409.5 Cr in trade and other payables
Industry
25.0%
2.0/5
The domestic outlook remains supported by mobility, infrastructure, industrial activity and India’s energy-security requirements. The industry nevertheless faces structural pressure from electric vehicles, biofuels, energy-transition policies, new refining capacity and volatile global product cracks
Show more
Detailed Analysis
India’s oil demand is forecast to increase from approximately 5.4 million barrels per day in 2023 to 6.6 million barrels per day by 2030, implying a CAGR of approximately 2.9%. Actual Indian oil-demand growth slowed to approximately 0.6% in 2025, partly because of higher biofuel use and weaker transport demand
India had installed refining capacity of approximately 258.1 MMT as of April 2025, with a large established network of public- and private-sector refiners
Refining and fuel retail are exposed to environmental approvals, product-quality standards, taxation, excise duty, trade restrictions and geopolitical policy. FY25 excise duty alone stood at INR 20,597.3 Cr, illustrating the direct policy and taxation exposure of the business
Valuation
25.0%
2.0/5
Nayara Energy appears expensive on both earnings and operating-profit measures.
Show more
Detailed Analysis
The Company is valued at a P/E multiple of 26.5x, compared with the refining and petroleum industry P/E of 5.1x, representing a premium of approximately 423.8%
Nayara Energy is valued at approximately 13.6x EV/EBITDA. The selected peer median is 4.2x, resulting in a premium of approximately 224.8%
The unlisted share price remained broadly unchanged at approximately INR 1,079.0 between July 7, 2026 and July 21, 2026, resulting in an observed price range of approximately 0.0%
0.0%
0.0/5
Detailed Analysis
TOTAL
100%
2.0/5
Weighted Composite Score
Per Share Price
₹1079.0
As of 14 Oct 2026
Lot Size
50.0 Shares
Minimum Investment
₹53,95,000.0 / 5,000 shares
Market Cap. (₹ Cr)
Revenue FY’25
PAT FY’25 (in Cr)
P/E Multiple
Face Value
₹ 10.0Lot Size
50.0 sharesSale Type
PrimaryPAT FY’25 (in Cr)
₹ 6,079.5 CrPAT Margin (%)
4.1 %P/E Multiple
26.4xCAGR Growth 3Y
7.8 %ROE (FY’25)
13.0 %ROCE (FY’25)
15.1 %Price to Book Value ratio
3.2xDebt/Equity (FY’25)
0.2xMerchant banker appointed
❌ NoCompany Website
www.nayaraenergy.com Disclaimer: Unlisted shares are unregulated & illiquid. This is NOT investment advice. Please do your own due diligence before investing.
Minimum Investment
₹53,95,000.0 / 5,000 sharesShares Lot 50 X 100
Investment amount
₹53,95,000.0
Overview
Business
Business Model
Geographical Presence
Sales Channel
Financial Highlights
Income Statement
Revenue growth with EBITDA and PAT margins
| Financial Metric | FY 2023 | FY 2024 | FY 2025 |
|---|---|---|---|
| Revenue (₹ Cr) | 1,38,866.3 | 1,56,030.5 | 1,50,324.4 |
| Growth (%) | - | 12.3% | -3.8% |
| EBITDA (₹ Cr) | 18,312.5 | 20,669.8 | 12,294.6 |
| EBITDA Margin (%) | 13.3% | 13.3% | 8.2% |
| PAT (₹ Cr) | 9,426.2 | 12,321.0 | 6,079.5 |
| PAT Margin (%) | 6.8% | 7.9% | 4.1% |
OBSERVATIONS & INSIGHTS
Revenue from operations declined from ₹155,091.5 Cr in FY24 to ₹149,217.4 Cr in FY25 after rising sharply from FY23 to FY24
EBITDA declined from ₹20,669.8 Cr in FY24 to ₹12,294.6 Cr in FY25, reflecting weaker operating profitability in the latest year
PAT declined from ₹12,321.0 Cr in FY24 to ₹6,079.5 Cr in FY25, with PAT margin moderating from 7.9% to 4.1%
The Company remained profitable across FY23-FY25 despite volatility in refining and crude markets
Balance Sheet
| Financial Metric | FY 2023 | FY 2024 | FY 2025 |
|---|---|---|---|
| EQUITY & LIABILITIES | ₹ 84,841.4 Cr | ₹ 87,749.0 Cr | ₹ 85,447.6 Cr |
| Net Worth | ₹ 30,533.1 Cr | ₹ 43,491.0 Cr | ₹ 50,010.2 Cr |
| Share Capital | ₹ 1,507.2 Cr | ₹ 1,507.2 Cr | ₹ 1,507.2 Cr |
| Reserves & Surplus | ₹ 29,025.9 Cr | ₹ 41,983.8 Cr | ₹ 48,503.0 Cr |
| Total Liabilities | ₹ 54,308.3 Cr | ₹ 44,258.0 Cr | ₹ 35,437.4 Cr |
| Current Liabilities | ₹ 25,983.6 Cr | ₹ 24,727.9 Cr | ₹ 17,982.1 Cr |
| Borrowings | ₹ 1,342.9 Cr | ₹ 3,595.2 Cr | ₹ 4,530.4 Cr |
| Trade Payables | ₹ 14,587.3 Cr | ₹ 11,785.9 Cr | ₹ 7,111.7 Cr |
| Other Current Liabilities | ₹ 10,053.4 Cr | ₹ 9,346.8 Cr | ₹ 6,340.0 Cr |
| Non-Current Liabilities | ₹ 28,324.7 Cr | ₹ 19,530.1 Cr | ₹ 17,455.3 Cr |
| Borrowings | ₹ 10,699.6 Cr | ₹ 8,190.0 Cr | ₹ 8,071.7 Cr |
| Other Non-Current Liabilities | ₹ 17,625.1 Cr | ₹ 11,340.1 Cr | ₹ 9,383.6 Cr |
| ASSETS | ₹ 84,841.4 Cr | ₹ 87,749.0 Cr | ₹ 85,447.6 Cr |
| Current Assets | ₹ 25,367.0 Cr | ₹ 28,025.3 Cr | ₹ 25,163.4 Cr |
| Trade Receivables | ₹ 5,264.8 Cr | ₹ 7,319.7 Cr | ₹ 4,212.9 Cr |
| Inventory | ₹ 9,595.2 Cr | ₹ 10,393.2 Cr | ₹ 10,456.7 Cr |
| Cash & Cash Equivalents | ₹ 7,924.2 Cr | ₹ 6,034.9 Cr | ₹ 6,468.8 Cr |
| Other Current Assets | ₹ 2,582.8 Cr | ₹ 4,277.5 Cr | ₹ 4,025.0 Cr |
| Non-Current Assets | ₹ 59,474.4 Cr | ₹ 59,723.7 Cr | ₹ 60,284.2 Cr |
| Fixed Assets | ₹ 58,636.9 Cr | ₹ 58,618.5 Cr | ₹ 58,870.6 Cr |
| Other Non-Current Assets | ₹ 837.5 Cr | ₹ 1,105.2 Cr | ₹ 1,413.6 Cr |
OBSERVATIONS & INSIGHTS
Net worth increased from ₹30,533.1 Cr in FY23 to ₹50,010.2 Cr in FY25
Total assets remained broadly stable over FY23-FY25, moving from ₹84,841.4 Cr in FY23 to ₹85,447.6 Cr in FY25
Current liabilities reduced from ₹24,727.9 Cr in FY24 to ₹17,982.1 Cr in FY25
Trade receivables reduced from ₹7,319.7 Cr in FY24 to ₹4,212.9 Cr in FY25
Inventory remained broadly stable at around ₹10,400 Cr in FY24 and FY25
Borrowings remained moderate relative to the company’s net worth
Cash Flow
| Financial Metric | FY 2023 | FY 2024 | FY 2025 |
|---|---|---|---|
CFO (₹ Cr) Cash generated from core business operations. | +18,018.7 Cr | +3,455.4 Cr | +3,047.8 Cr |
CFI (₹ Cr) Cash used for investments and long-term assets. | -4,903.9 Cr | -6,382.7 Cr | -1,456.1 Cr |
CFF (₹ Cr) Cash flow related to funding and borrowings. | -7,208.1 Cr | -2,555.6 Cr | -1,158.6 Cr |
Working Capital
| Efficiency Metric | FY 2023 | FY 2024 | FY 2025 |
|---|---|---|---|
Debtor Days Average number of days taken to collect customer payments. | - | - | - |
Creditor Days Average time taken to pay suppliers and vendors. | - | - | - |
Inventory Days Average number of days inventory remains unsold. | - | - | - |
CCC (Cash Conversion Cycle) (Debtor Days + Inventory Days - Creditor Days) | - | - | - |
Financial Ratios
Measures the company’s leverage relative to shareholder equity.
OBSERVATIONS & INSIGHTS
ROE moderated to around 13.0% in FY25 from 33.3% in FY24 due to lower profitability and a larger equity base
Debt/equity remained moderate at around 0.25x in FY25 when measured on gross borrowings excluding lease liabilities
Interest coverage remained above 5x across FY23-FY25, indicating adequate operating earnings coverage of finance cost
Current ratio improved to around 1.4x in FY25, supported by lower current liabilities
Industry Overview
Industry Drivers
Domestic Fuel Demand and Energy Security
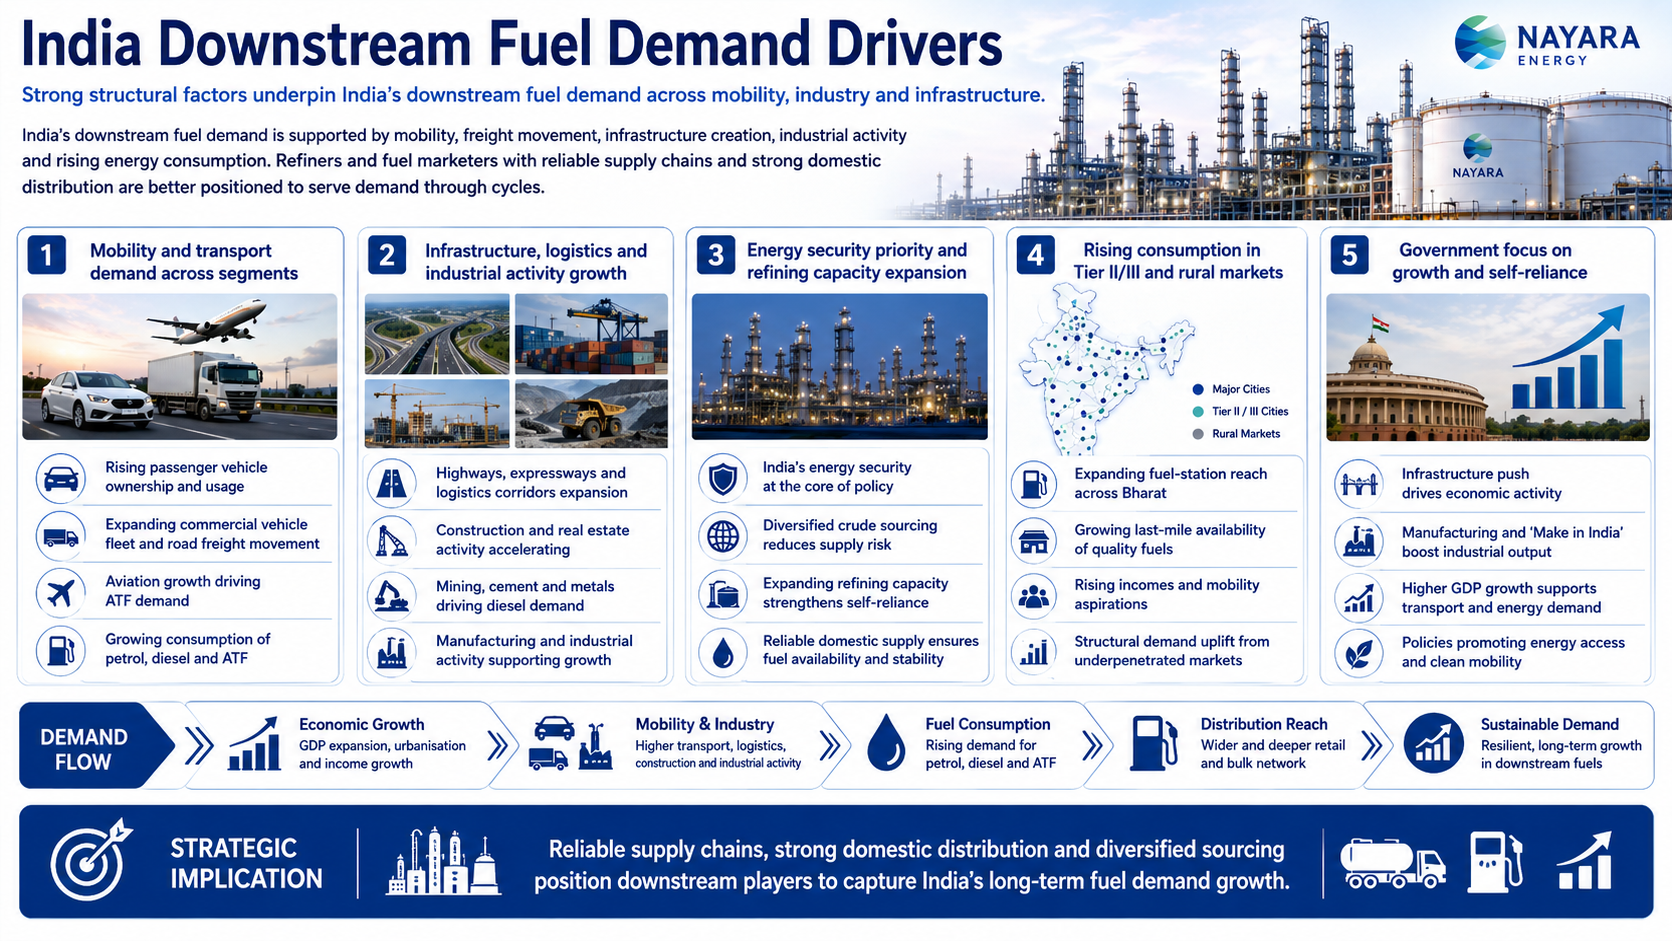
India’s downstream fuel demand is supported by mobility, freight movement, infrastructure creation, industrial activity and rising energy consumption. Refiners and fuel marketers with reliable supply chains and strong domestic distribution are better positioned to serve demand through cycles.
Key Drivers:
Mobility and transport demand across passenger vehicles, commercial vehicles, aviation and road freight
Growth in highways, logistics corridors, construction, mining and industrial activity supporting diesel, petrol and ATF demand
India’s energy security priority, including stable domestic supply, diversified crude sourcing and refining capacity expansion
Rising consumption in Tier II/III and rural markets, supported by fuel-station reach and last-mile availability
Government focus on infrastructure, manufacturing and economic growth, which supports petroleum product consumption
Refinery Complexity, Crude Flexibility and Margin Capture
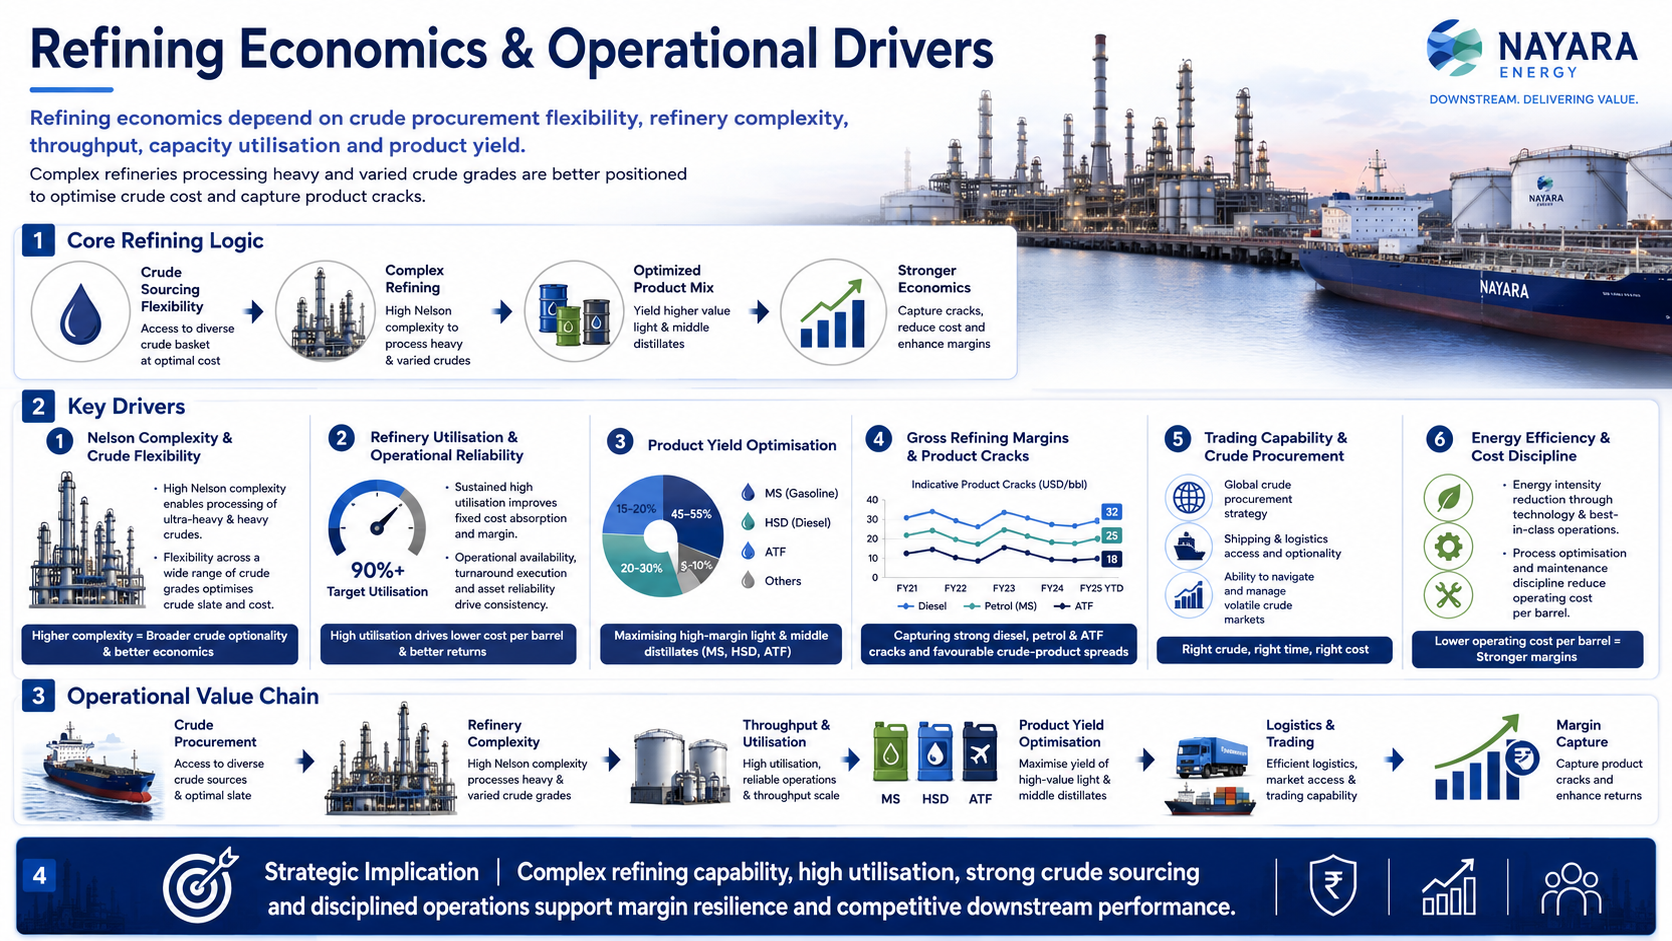
Refining economics depend on crude procurement flexibility, refinery complexity, throughput, capacity utilisation and product yield. Complex refineries that can process heavy and varied crude grades are better placed to optimise crude cost and capture product cracks.
Key Drivers:
Nelson complexity, ability to process ultra-heavy/heavy crude and flexibility across crude grades
Refinery utilisation, operational availability, turnaround execution and asset reliability
Product yield optimisation towards high-margin light and middle distillates such as MS, HSD and ATF
Gross refining margins, diesel/petrol/ATF cracks and crude-product spreads
Trading capability, crude procurement strategy, shipping/logistics access and ability to manage volatile crude markets
Energy efficiency, process optimisation and maintenance discipline reducing operating cost per barrel
Fuel Retail, Institutional Sales and Petrochemical Integration
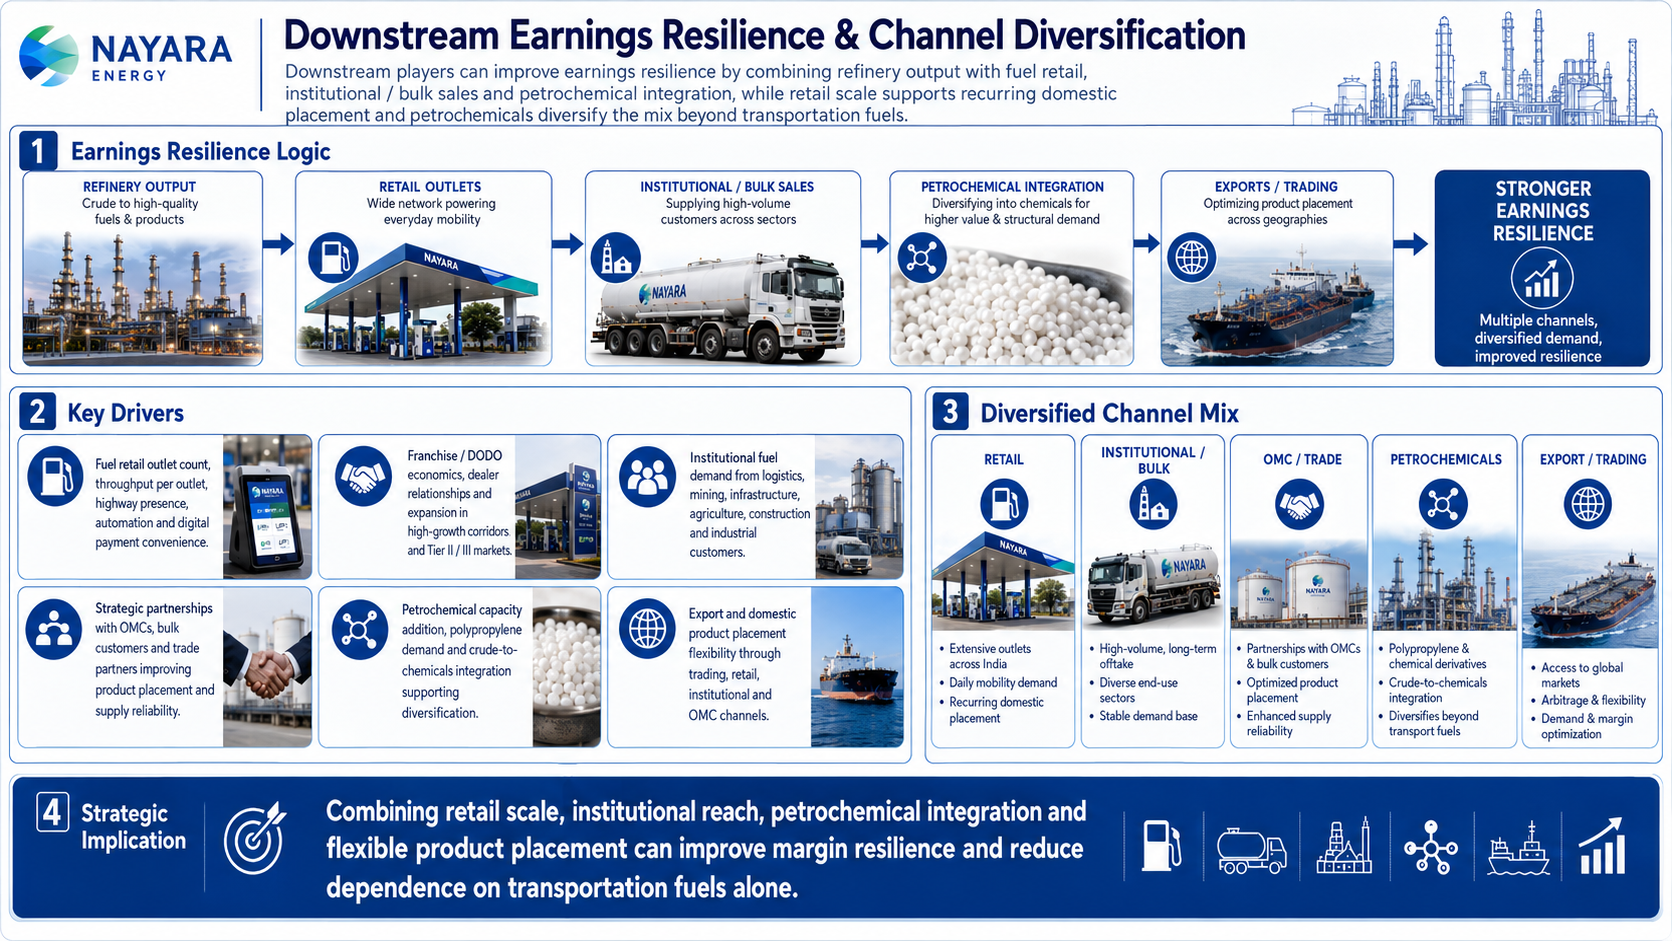
Downstream players can improve earnings resilience by combining refinery output with fuel retail, institutional/bulk sales and petrochemical integration. Retail scale supports recurring domestic placement, while petrochemicals can diversify the product mix beyond transportation fuels.
Key Drivers:
Fuel retail outlet count, throughput per outlet, highway presence, automation and digital payment convenience
Franchise/DODO economics, dealer relationships and expansion in high-growth corridors and Tier II/III markets
Institutional fuel demand from logistics, mining, infrastructure, agriculture, construction and industrial customers
Strategic partnerships with OMCs, bulk customers and trade partners improving product placement and supply reliability
Petrochemical capacity addition, polypropylene demand and crude-to-chemicals integration supporting diversification
Export and domestic product placement flexibility through trading, retail, institutional and OMC channels
Risks in the Industry
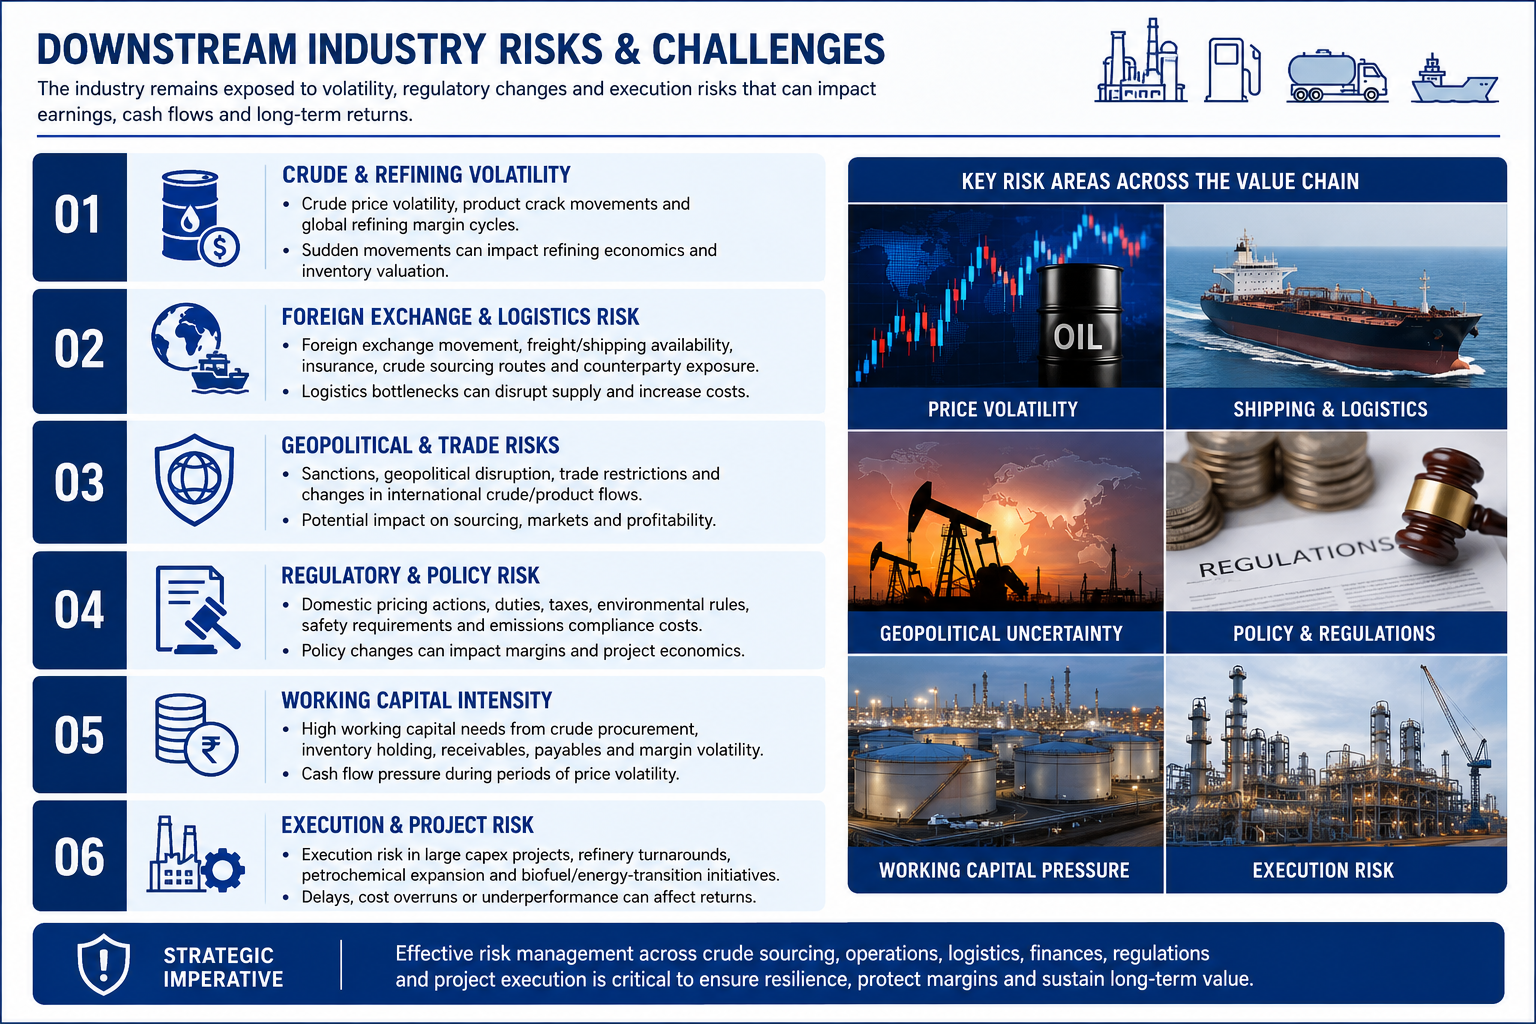
The industry remains exposed to sharp movements in crude prices, product cracks, foreign exchange, shipping costs, duties and regulations. Refining and fuel marketing businesses also require significant working capital and face risks from sanctions, trade-flow disruption and environmental compliance.
Key Drivers:
Crude price volatility, product crack movements and global refining margin cycles
Foreign exchange movement, freight/shipping availability, insurance, crude sourcing routes and counterparty exposure
Sanctions, geopolitical disruption, trade restrictions and changes in international crude/product flows
Domestic pricing actions, duties, taxes, environmental rules, safety requirements and emissions compliance costs
Working capital intensity from crude procurement, inventory holding, receivables, payables and margin volatility
Execution risk in large capex projects, refinery turnarounds, petrochemical expansion and biofuel/energy-transition initiatives
Government Policy Support
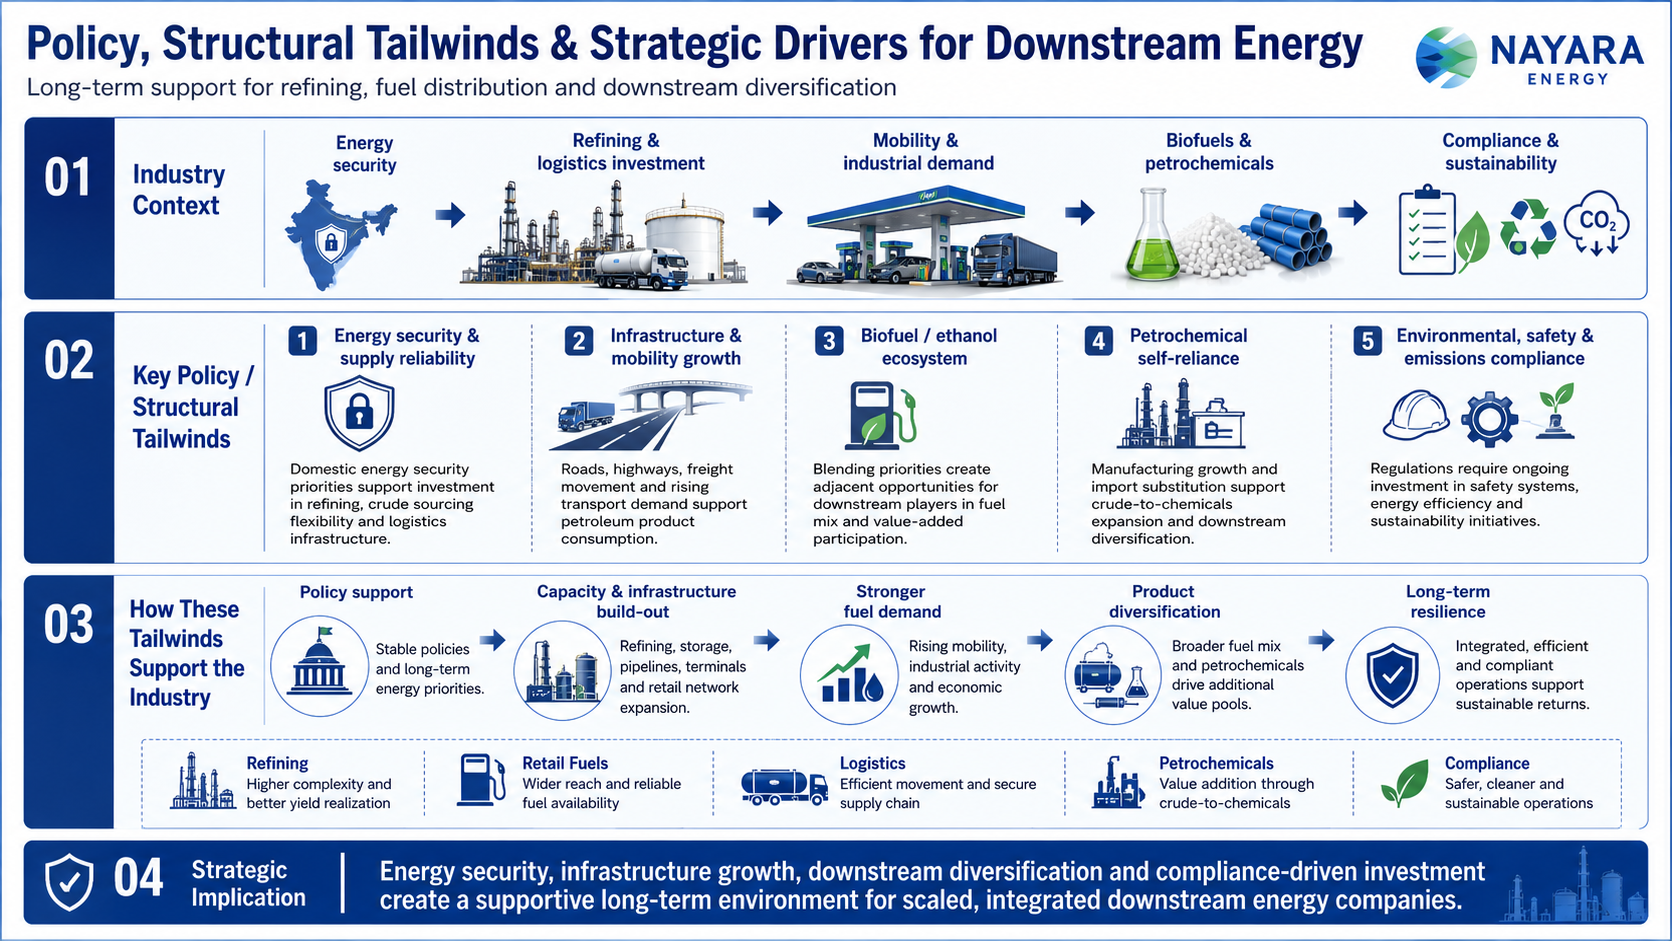
Domestic energy security priorities support investment in refining, fuel supply reliability, crude sourcing and logistics infrastructure
Infrastructure development, road transport growth and mobility expansion support long-term demand for refined products
Biofuel and ethanol blending priorities create adjacent opportunities for downstream energy companies
Petrochemical self-reliance and manufacturing growth support crude-to-chemicals expansion and downstream product diversification
Environmental, safety and emissions regulations require ongoing investment in compliance, energy efficiency and sustainability initiatives
Fundraise/Future Plans
Shareholding
Pre-issue shareholding
Promoter Holding 0.0%
Category
Pre-Issue%
Promoters
0.0%
Total Promoter Holding
0.0%
Additional Shareholders
0.0%
Total Additional Holding
0.0%
Total Shareholding
0.0%
- Overview
- Business
- Financial Highlights
- Industry Overview
- Fundraise/Future Plans
- Documentation
Get the Preqt App and keep in touch around the clock!
 Monitor your investments in real-time.
- Receive tailored deal suggestions.
- Get real-time updates and alerts.
