

Onix Renewables
Building India’s energy futureIntegrated energy solutions
IPO Review and Rating
Tactical
Overall Recommendation
Revenue increased from INR 146.0 Cr in FY23 to INR 1,001.3 Cr in FY25, representing a 161.9% 2-year CAGR, while FY25 EBITDA reached INR 164.5 Cr with a 16.4% margin and PAT reached INR 114.8 Cr with an 11.5% margin. D/E stood at 0.21x and ROE at 26.7%, while operating cash flow remained negative at INR (454.1) Cr. India's renewable market is projected to grow at 15.0% CAGR, with installed capacity excluding large hydro at approximately 236.5 GW by June 2026
PARAMETER
WEIGHT
SCORE
KEY FACTORS
Financial Performance
20.0%
4.0/5
Strong revenue growth recorded a 161.9% 2-year CAGR
Show more
Detailed Analysis
Revenue increased from INR 146.0 Cr in FY23 to INR 351.0 Cr in FY24 and INR 1,001.3 Cr in FY25, representing a 161.9% FY23-FY25 2-year CAGR and 185.3% FY25 YoY growth
EBITDA increased from INR 12.5 Cr in FY23 to INR 57.0 Cr in FY24 and INR 164.5 Cr in FY25; FY25 EBITDA margin stood at 16.4%, with EBITDA growth of 188.5% YoY
PAT increased from INR 8.6 Cr in FY23 to INR 39.0 Cr in FY24 and INR 114.8 Cr in FY25; FY25 PAT margin stood at 11.5%, with PAT growth of 194.3% YoY
FY25 D/E stood at 0.21x, compared with 0.56x in FY24, representing a reduction of approximately 62.5% YoY
FY25 ROE stood at 26.7%, compared with 64.2% in FY24; ROE declined by approximately 37.4 percentage points as the equity base expanded materially
Operating cash flow remained negative at approximately INR (60.9) Cr in FY24 and INR (454.1) Cr in FY25, with the FY25 outflow increasing by approximately 645.6% YoY
Industry
20.0%
3.0/5
India's renewable market is projected to grow at 15.0% CAGR to 486.0 GW by 2030
Show more
Detailed Analysis
India had approximately 236.5 GW of renewable capacity excluding large hydro by June 2026, including 162.2 GW solar and 57.4 GW wind
Project execution dependent on tendering, grid connectivity, land, approvals and renewable-policy frameworks, imposing regulatory risk; FY25 alone added 23.8 GW solar and 4.2 GW wind capacity
The reported operating base remains predominantly India-focused.
Management
20.0%
2.0/5
Leadership experience stands at 15+ years
Show more
Detailed Analysis
Divyesh Savaliya has 15+ years of renewable-energy and power-sector experience across power distribution, transmission and large hybrid projects
FY25 Board comprised 3 Directors and 0 Independent Directors, resulting in 0.0% independent representation
0% promoter pledge identified and 0 material regulatory/court orders affecting going concern
The FY25 Secretarial Audit contained 1 reservation/qualification/adverse remark and the proposed Eureka amalgamation remains subject to the NCLT/PPIRP process
FY25 related-party sales were approximately INR 617.8 Cr, equivalent to approximately 61.7% of FY25 revenue of INR 1,001.3 Cr
Valuation Metrics
20.0%
4.0/5
The Company is valued at 4.63x P/E, 0.76x P/B and 0.54x P/S
Show more
Detailed Analysis
The valuation of the Company is 4.63x P/E against the stated industry P/E of 65.0x, representing a 92.9% discount to the industry benchmark
Estimated FY25 EV is approximately INR 547.4 Cr against EBITDA of INR 164.5 Cr, resulting in 3.3x EV/EBITDA versus a selected current peer median of approximately 12.9x, representing a 74.2% discount
The valuation of the Company is 0.76x P/B, below 1.0x book value
TOTAL
100%
3.3/5
Weighted Composite Score
Per Share Price
₹49.0
As of 14 Oct 2026
Lot Size
50.0 Shares
Minimum Investment
₹2,450.0 / 50 shares
Market Cap. (₹ Cr)
Revenue FY’25
PAT FY’25
P/E Multiple
Face Value
₹ 10.0Lot Size
50.0 sharesPAT FY’25
₹ 114.8 CrPAT Margin (%)
11.5 %P/E Multiple
4.6xCAGR Growth 2Y
161.9 %ROE (FY’25)
26.7 %ROCE (FY’25)
32.3 %Price to Book Value ratio
0.8xDebt/Equity (FY’25)
0.2xMerchant banker appointed
✅ YesCompany Website
onixrenewable.comDisclaimer: Unlisted shares are unregulated & illiquid. This is NOT investment advice. Please do your own due diligence before investing.
Minimum Investment
₹2,450.0 / 50 sharesShares Lot 50 X 1
Investment amount
₹2,450.0
Overview
Business
Products
Business Model
Geographical Presence
Sales Channel
Financial Highlights
Income Statement
Revenue growth with EBITDA and PAT margins
| Financial Metric | FY 2024 | FY 2025 |
|---|---|---|
| Revenue (₹ Cr) | 351.0 | 1,001.3 |
| Growth (%) | 140.4% | 185.3% |
| EBITDA (₹ Cr) | 57.0 | 164.5 |
| EBITDA Margin (%) | 16.2% | 16.4% |
| PAT (₹ Cr) | 39.0 | 114.8 |
| PAT Margin (%) | 11.1% | 11.5% |
OBSERVATIONS & INSIGHTS
Supplied revenue increased 6.9x from FY23 to FY25, implying a two-year CAGR of approximately 162%, consistent with the supplied scoring sheet
EBITDA margin expanded from 8.5% in FY23 to 16.4% in FY25, indicating substantial operating leverage as project scale increased
Supplied PAT increased from INR 8.6 Cr to INR 114.8 Cr in two years and PAT margin almost doubled to 11.5%
Balance Sheet
| Financial Metric | FY 2024 | FY 2025 |
|---|---|---|
| EQUITY & LIABILITIES | ₹ 494.9 Cr | ₹ 1,072.4 Cr |
| Net Worth | ₹ 97.5 Cr | ₹ 705.6 Cr |
| Share Capital | ₹ 1.7 Cr | ₹ 2.4 Cr |
| Reserves & Surplus | ₹ 95.8 Cr | ₹ 703.2 Cr |
| Total Liabilities | ₹ 397.4 Cr | ₹ 366.8 Cr |
| Current Liabilities | ₹ 327.1 Cr | ₹ 272.2 Cr |
| Borrowings | ₹ 24.4 Cr | ₹ 82.6 Cr |
| Trade Payables | ₹ 143.7 Cr | ₹ 107.1 Cr |
| Other Current Liabilities | ₹ 159.0 Cr | ₹ 82.5 Cr |
| Non-Current Liabilities | ₹ 70.3 Cr | ₹ 94.6 Cr |
| Borrowings | ₹ 65.3 Cr | ₹ 89.9 Cr |
| Other Non-Current Liabilities | ₹ 5.0 Cr | ₹ 4.7 Cr |
| ASSETS | ₹ 494.9 Cr | ₹ 1,072.4 Cr |
| Current Assets | ₹ 473.6 Cr | ₹ 698.7 Cr |
| Trade Receivables | ₹ 134.2 Cr | ₹ 263.3 Cr |
| Inventory | ₹ 106.1 Cr | ₹ 114.3 Cr |
| Cash & Cash Equivalents | ₹ 2.1 Cr | ₹ 156.4 Cr |
| Other Current Assets | ₹ 231.2 Cr | ₹ 164.7 Cr |
| Non-Current Assets | ₹ 21.3 Cr | ₹ 373.7 Cr |
| Fixed Assets | ₹ 10.9 Cr | ₹ 12.4 Cr |
| Other Non-Current Assets | ₹ 10.4 Cr | ₹ 361.3 Cr |
OBSERVATIONS & INSIGHTS
Total assets expanded more than 2x in FY25 to INR 1,072.4 Cr, reflecting an exceptionally rapid scale-up in project activity and financial assets
Equity rose from INR 97.5Cr to INR 705.6Cr, driven predominantly by securities premium and profit retention
Cash increased to INR 156.4 Cr, but operating cash flow remained negative, meaning the cash build was funded primarily through equity and financing flows rather than internally generated cash
Cash Flow
| Financial Metric | FY 2024 | FY 2025 |
|---|---|---|
CFO (₹ Cr) Cash generated from core business operations. | -60.9 Cr | -454.1 Cr |
CFI (₹ Cr) Cash used for investments and long-term assets. | -15.6 Cr | +7.7 Cr |
CFF (₹ Cr) Cash flow related to funding and borrowings. | +77.2 Cr | +579.1 Cr |
Working Capital
| Efficiency Metric | FY 2023 | FY 2024 | FY 2025 |
|---|---|---|---|
Debtor Days Average number of days taken to collect customer payments. | - | - | - |
Creditor Days Average time taken to pay suppliers and vendors. | - | - | - |
Inventory Days Average number of days inventory remains unsold. | - | - | - |
CCC (Cash Conversion Cycle) (Debtor Days + Inventory Days - Creditor Days) | - | - | - |
Financial Ratios
Measures the company’s leverage relative to shareholder equity.
OBSERVATIONS & INSIGHTS
FY25 standalone gross debt was approximately INR 145.2 Cr versus equity of INR 693.4 Cr, resulting in low gross leverage of about 0.2x
Interest coverage remained very strong at more than 20x, providing a material cushion against finance cost at the FY25 scale
Current ratio improved from 1.5x to 2.7x
Industry Overview
Industry Drivers
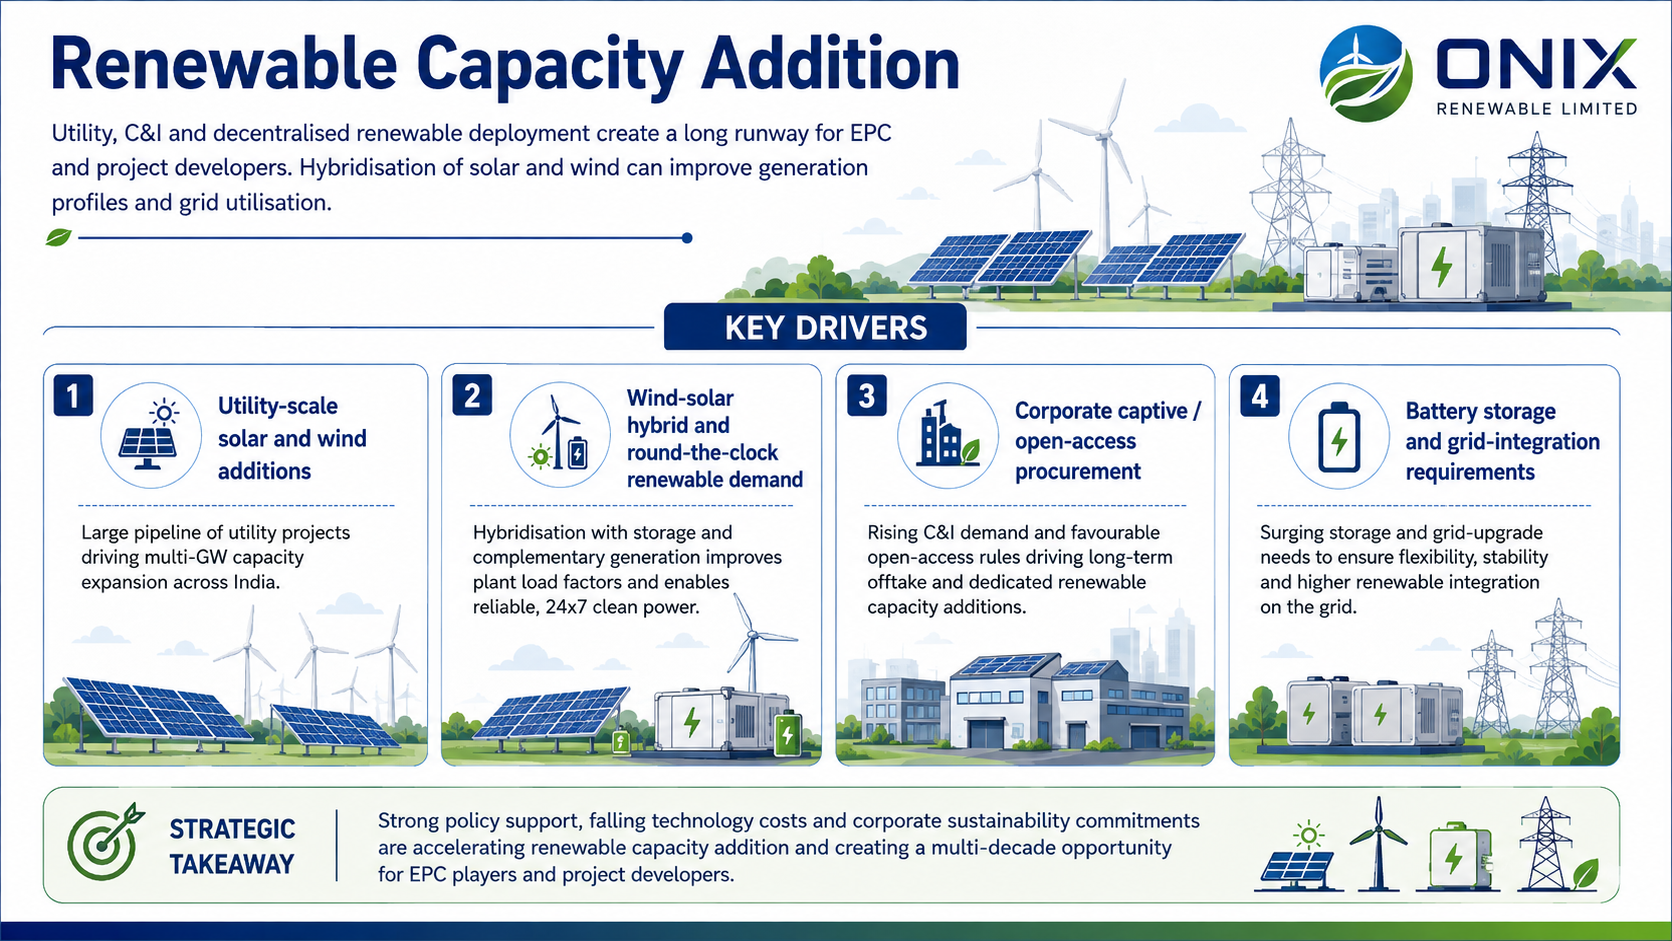
Renewable Capacity Addition
Utility-scale solar and wind additions
Wind-solar hybrid and round-the-clock renewable demand
Corporate captive / open-access procurement
Battery storage and grid-integration requirements
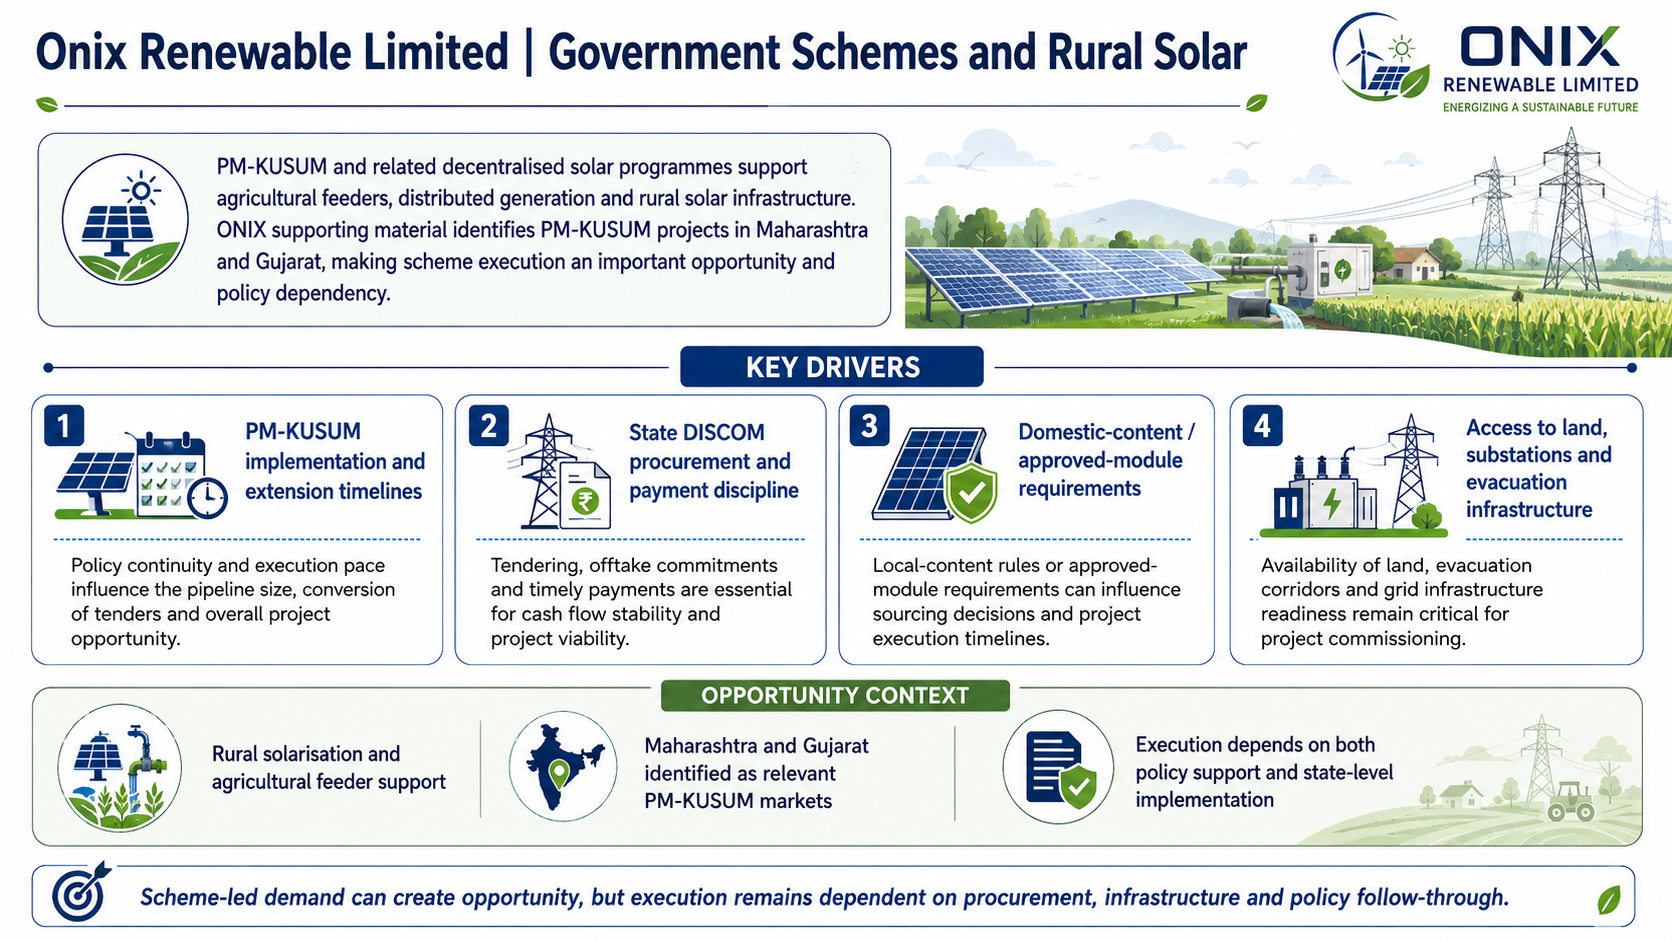
Government Schemes and Rural Solar
PM-KUSUM implementation and extension timelines
State DISCOM procurement and payment discipline
Domestic-content / approved-module requirements where applicable
Access to land, substations and evacuation infrastructure
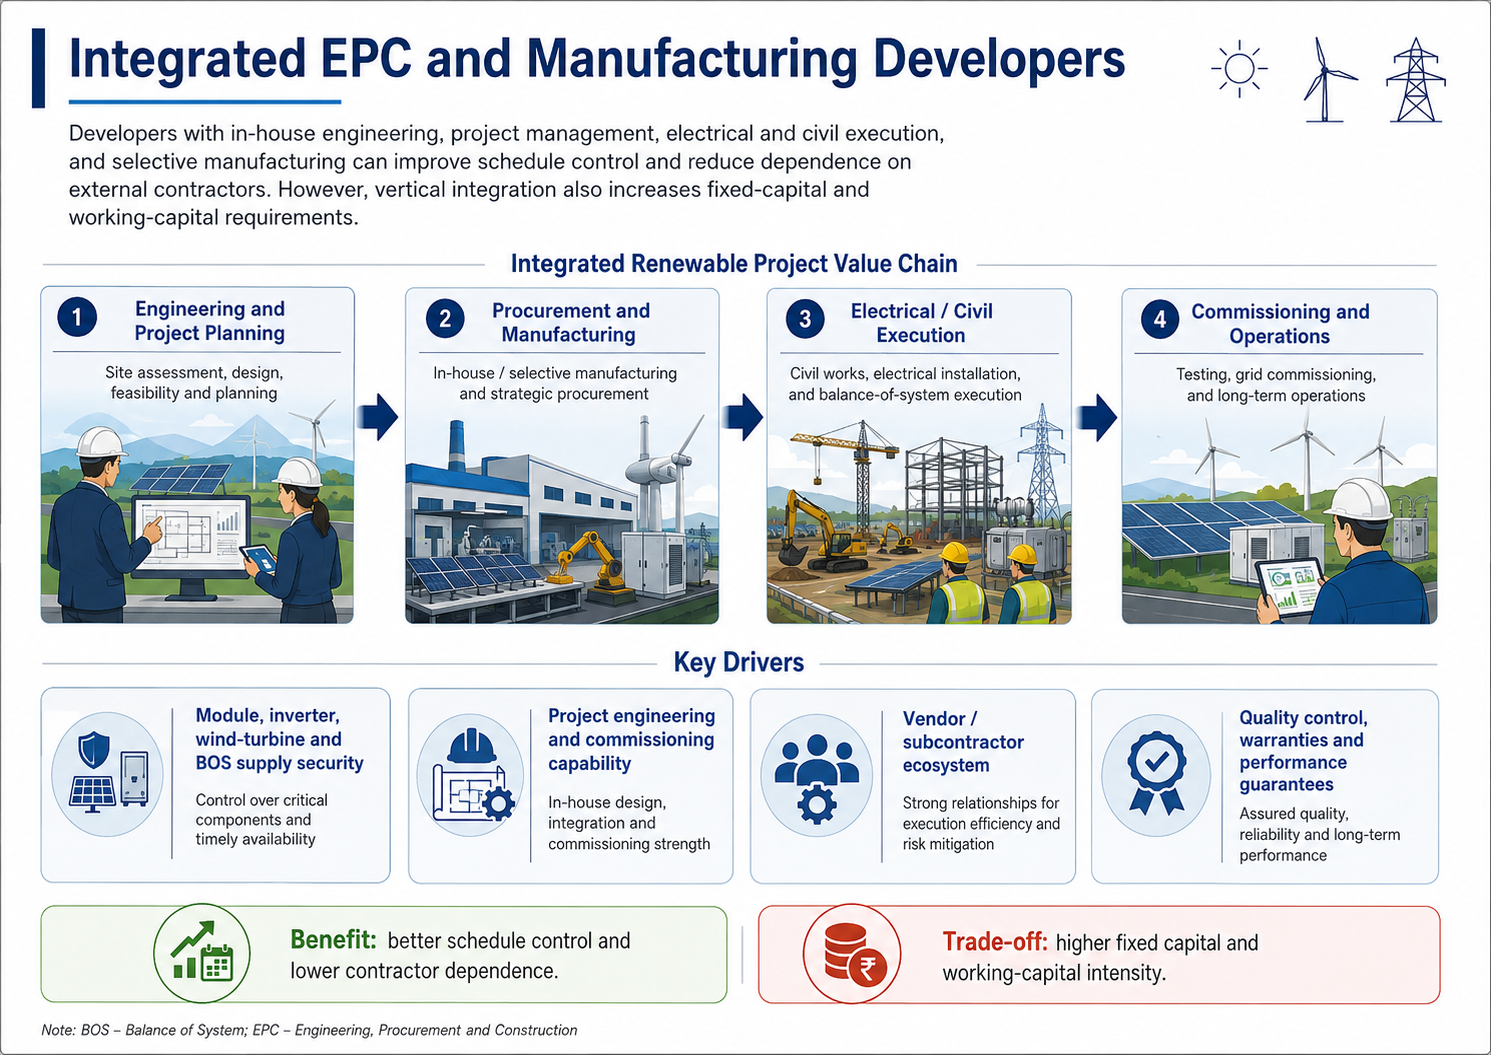
Integrated EPC and Manufacturing
Module, inverter, wind-turbine and BOS supply security
Project engineering and commissioning capability
Vendor / subcontractor ecosystem
Quality control, warranties and performance guarantees.
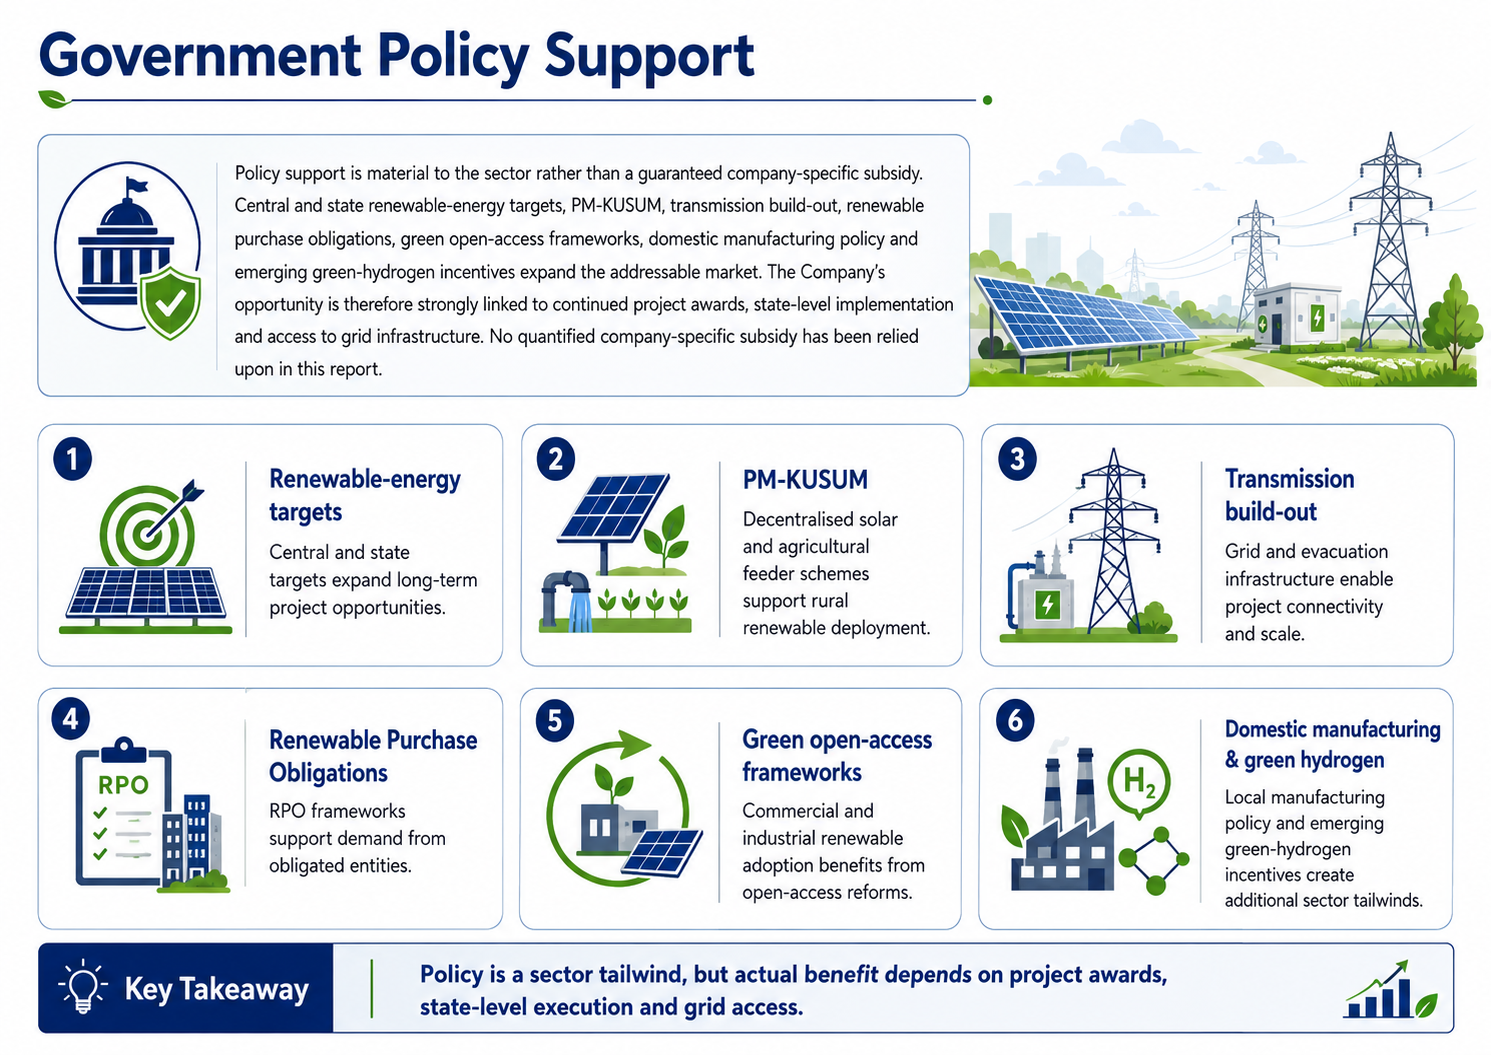
Government Policy Support
Policy support is material to the sector rather than a guaranteed company-specific subsidy
Central and state renewable-energy targets, PM-KUSUM, transmission build-out, renewable purchase obligations, green open access frameworks, domestic manufacturing policy and emerging green-hydrogen incentives expand the addressable market
The Company’s opportunity is therefore strongly linked to continued project awards, state-level implementation and access to grid infrastructure
Fundraise/Future Plans
Shareholding
Pre-issue shareholding
Promoter Holding 0.0%
Category
Pre-Issue%
Promoters
0.0%
Total Promoter Holding
0.0%
Additional Shareholders
0.0%
Total Additional Holding
0.0%
Total Shareholding
0.0%
- Overview
- Business
- Financial Highlights
- Industry Overview
- Fundraise/Future Plans
- Documentation
Get the Preqt App and keep in touch around the clock!
 Monitor your investments in real-time.
- Receive tailored deal suggestions.
- Get real-time updates and alerts.
