

Oravel Stays Ltd (OYO)
Affordable StaysConvenience, and Wider Access
Unlisted Review and Rating
Speculative
DRHP FiledConnecting Guests with Reliable Stays Through Technology and Scale
OYO (Oravel Stays Limited) offers exposure to a scaled, technology-led global hospitality platform with an asset-light model, diversified brand portfolio and improving operating profitability driven by higher bookings, premiumisation and technology efficiencies. Its long-term scalability is attractive, but investors should weigh elevated leverage, acquisition and integration risks, balance-sheet expansion and the limited liquidity of unlisted shares. The opportunity is therefore better suited to investors with a medium-to-long-term horizon who are comfortable with execution and unlisted-market risks.
PARAMETER
WEIGHT
SCORE
KEY FACTORS
Financial Performance
25.0%
3.0/5
The biggest positive is the operational turnaround: EBITDA reached INR 1,083.5 Cr with a healthy 17.3% margin and OCF stayed positive. However, reported PAT quality is weaker than it first appears because FY25 PBT remained negative, with the statutory profit largely created by a significant deferred-tax credit.
Show more
Detailed Analysis
Revenue increased from INR 5,463.9 Cr in FY23 to INR 5,388.8 Cr in FY24 and INR 6,252.8 Cr in FY25. FY23-FY25 2-year CAGR was only 7.0%, although FY25 growth accelerated to 16.0% YoY
FY25 EBITDA was INR 1,083.5 Cr, versus INR 887.8 Cr in FY24, giving a 17.3% FY25 EBITDA margin. The Chairman also reported approximately INR 1,100 Cr EBITDA
Audited FY25 PAT was INR 244.8 Cr, giving a margin of only 3.9%. More importantly, PBT was a loss of INR 489.3 Cr, while a deferred-tax credit of INR 767.6 Cr converted this into reported PAT
Consolidated net debt-to-equity was 2.2x in FY25, broadly unchanged from 2.19x in FY24
Based on PAT attributable to shareholders and average parent equity, FY25 ROE is approximately 7.4%. Parent equity increased sharply from INR 1,860.8 Cr to INR 4,768.2 Cr
Consolidated OCF remained positive in both years at INR 598.2 Cr in FY24 and INR 321.3 Cr in FY25, although it declined 46.3% YoY
Industry
25.0%
3.0/5
The industry environment is attractive because travel penetration, branded supply and digital adoption continue to expand. The trade-off is intense competition, low switching costs in booking channels and substantial dependence on property-owner economics, customer experience and brand execution.
Show more
Detailed Analysis
India's hotel industry is expected to record approximately 9-12% revenue growth in FY26, supported by leisure, weddings, MICE and corporate travel
Hospitality companies face multiple operational, licensing, tax and local regulatory requirements. NITI Aayog's 2026 hospitality review specifically highlights regulatory and procedural constraints affecting tourism businesses
OYO's global hotel count exceeded 20,000 in FY25, with operations spanning India, the US, Southeast Asia and other markets. The Motel 6 / Studio 6 acquisition materially expanded its North American presence
Management
25.0%
4.0/5
The governance structure scores well because of the majority-independent board and relatively modest recurring RPT intensity. The main deduction is from outstanding regulatory/legal matters rather than board structure.
Show more
Detailed Analysis
OYO remains founder-led by Ritesh Agarwal, Founder and Chairman. The business has operated for roughly 13 years by FY25
FY25 Board comprised 7 Directors, including 4 Independent Directors, giving 57.1% independence
Recurring FY25 consolidated RPTs, excluding dividends and pass-through/capital transactions, are approximately INR 144.2 Cr, around 2.3% of FY25 revenue
Valuation Metrics
25.0%
1.0/5
Show more
Detailed Analysis
138.9x P/E vs 100.00x industry P/E, a 38.9% premium
Estimated FY25 EV/EBITDA approximately 42.2x, versus a directional listed-hotel peer median of approximately 18.6x
Indicative unlisted price currently around INR 25, with a 52-week range of approximately INR 23-55, implying a very wide ~58% observed range
TOTAL
100%
2.8/5
Weighted Composite Score
Per Share Price
₹23.0
As of 14 Oct 2026
Lot Size
1,000.0 Shares
Minimum Investment
₹23,000.0 / 1,000 shares
Market Cap. (₹ Cr)
Revenue FY’25
PAT FY’25
P/E Multiple
Face Value
₹ 1.0Offer Price
₹ 25.0Lot Size
1,000.0 sharesPAT FY’25
₹ 244.8 CrPAT Margin (%)
3.9 %P/E Multiple
138.9xCAGR Growth 3Y
9.4 %ROE (FY’25)
7.4 %ROCE (FY’25)
4.9 %Price to Book Value ratio
9.3xDebt/Equity (FY’25)
1.9xMerchant banker appointed
❌ NoCompany Website
share.google/tGDmIkF0GKpKcLWPyDisclaimer: Unlisted shares are unregulated & illiquid. This is NOT investment advice. Please do your own due diligence before investing.
Minimum Investment
₹23,000.0 / 1,000 sharesShares Lot 1000 X 1
Investment amount
₹23,000.0
Overview
Business
Business Model
Geographical Presence
Sales Channel
Key Risk Factor
Financial Highlights
Income Statement
Revenue growth with EBITDA and PAT margins
| Financial Metric | FY 2023 | FY 2024 | FY 2025 |
|---|---|---|---|
| Revenue (₹ Cr) | 5,464.0 | 5,389.0 | 6,253.0 |
| Growth (%) | 14.3% | -1.4% | 16.0% |
| EBITDA (₹ Cr) | 256.5 | 887.8 | 1,083.5 |
| EBITDA Margin (%) | 4.7% | 16.5% | 17.3% |
| PAT (₹ Cr) | -1,286.5 | 229.6 | 244.8 |
| PAT Margin (%) | -23.5% | 4.3% | 3.9% |
OBSERVATIONS & INSIGHTS
Revenue moved from INR 5,463.9 Cr in FY23 to INR 5,388.8 Cr in FY24 before increasing 16.0% to INR 6,252.8 Cr in FY25. The FY22-FY25 revenue CAGR is approximately 9.4%
The central operating improvement is EBITDA: margin expanded from 4.7% in FY23 to 16.5% in FY24 and 17.3% in FY25, reflecting cost restructuring, operating leverage and an improving business mix
The Group moved from a PAT loss of INR 1,286.5 Cr in FY23 to audited profits of INR 229.6 Cr in FY24 and INR 244.8 Cr in FY25.
FY25 audited PAT requires careful interpretation. Profit before tax was a loss of approximately INR 489.3 Cr, but the Group recognised a large net deferred-tax benefit, resulting in positive PAT. Management separately reports operational PAT of approximately INR 411.8 Cr before exceptional items
The supplied valuation snapshot uses PAT of INR 271.8 Cr and EPS of INR 0.18; these do not reconcile with FY25 audited PAT of INR 244.8 Cr and basic EPS of INR 0.38. The discrepancy should be clarified before relying on the snapshot P/E
Balance Sheet
| Financial Metric | FY 2023 | FY 2024 | FY 2025 |
|---|---|---|---|
| EQUITY & LIABILITIES | ₹ 7,932.4 Cr | ₹ 6,443.5 Cr | ₹ 16,695.3 Cr |
| Net Worth | ₹ 582.6 Cr | ₹ 900.7 Cr | ₹ 3,786.6 Cr |
| Share Capital | ₹ 133.9 Cr | ₹ 135.0 Cr | ₹ 678.7 Cr |
| Reserves & Surplus | ₹ 448.7 Cr | ₹ 765.7 Cr | ₹ 3,107.9 Cr |
| Total Liabilities | ₹ 7,349.8 Cr | ₹ 5,542.8 Cr | ₹ 12,908.7 Cr |
| Current Liabilities | ₹ 1,919.5 Cr | ₹ 1,518.2 Cr | ₹ 2,587.0 Cr |
| Borrowings | ₹ 66.4 Cr | ₹ 46.2 Cr | ₹ 155.3 Cr |
| Trade Payables | ₹ 935.1 Cr | ₹ 963.3 Cr | ₹ 1,240.2 Cr |
| Other Current Liabilities | ₹ 918.0 Cr | ₹ 508.7 Cr | ₹ 1,191.5 Cr |
| Non-Current Liabilities | ₹ 5,430.3 Cr | ₹ 4,024.6 Cr | ₹ 10,321.7 Cr |
| Borrowings | ₹ 5,005.0 Cr | ₹ 3,556.8 Cr | ₹ 6,988.8 Cr |
| Other Non-Current Liabilities | ₹ 425.3 Cr | ₹ 467.8 Cr | ₹ 3,332.9 Cr |
| ASSETS | ₹ 7,932.5 Cr | ₹ 6,443.5 Cr | ₹ 16,695.4 Cr |
| Current Assets | ₹ 2,294.5 Cr | ₹ 1,421.8 Cr | ₹ 2,126.3 Cr |
| Trade Receivables | ₹ 158.3 Cr | ₹ 203.0 Cr | ₹ 487.8 Cr |
| Inventory | ₹ 0.0 Cr | ₹ 0.0 Cr | ₹ 0.0 Cr |
| Cash & Cash Equivalents | ₹ 1,677.1 Cr | ₹ 709.8 Cr | ₹ 713.0 Cr |
| Other Current Assets | ₹ 459.1 Cr | ₹ 509.0 Cr | ₹ 925.5 Cr |
| Non-Current Assets | ₹ 5,638.0 Cr | ₹ 5,021.7 Cr | ₹ 14,569.1 Cr |
| Fixed Assets | ₹ 55.2 Cr | ₹ 52.3 Cr | ₹ 70.3 Cr |
| Other Non-Current Assets | ₹ 5,582.8 Cr | ₹ 4,969.4 Cr | ₹ 14,498.8 Cr |
OBSERVATIONS & INSIGHTS
FY25 represents a step-change in the balance sheet: total assets increased from INR 6,443.5 Cr in FY24 to INR 16,695.3 Cr, largely because of acquisitions and the associated recognition of goodwill, intangible assets and right-of-use assets
FY25 goodwill was approximately INR 5,624.7 Cr, other intangible assets INR 4,927.4 Cr and right-of-use assets INR 2,625.2 Cr. Together these three categories represented roughly 79% of total assets, creating meaningful impairment and integration risk
Total borrowings increased from approximately INR 3,603.0 Cr in FY24 to INR 7,144.1 Cr in FY25. The Group refinanced prior facilities and raised a USD 830 million Term Loan B associated with the enlarged global portfolio
Total equity increased from INR 900.7 Cr to INR 3,786.6 Cr following equity / preference capital issuance and retained earnings. Equity attributable to owners was higher at INR 4,768.2 Cr because non-controlling interest remained negative
Current liabilities of INR 2,587.0 Cr exceeded current assets of INR 2,126.3 Cr in FY25, while cash and bank balances were approximately INR 713.0 Cr. Debt maturities, partner settlement obligations and cash conversion therefore remain important
Trade receivables increased to INR 487.8 Cr in FY25 and trade payables to INR 1,240.2 Cr. The platform retains a payable-funded working-capital structure, but the rising receivable base should be monitored as the Group expands managed / principal arrangements
Cash Flow
| Financial Metric | FY 2023 | FY 2024 | FY 2025 |
|---|---|---|---|
CFO (₹ Cr) Cash generated from core business operations. | +141.8 Cr | +598.2 Cr | +321.3 Cr |
CFI (₹ Cr) Cash used for investments and long-term assets. | -108.8 Cr | +1,424.9 Cr | -4,212.1 Cr |
CFF (₹ Cr) Cash flow related to funding and borrowings. | -704.7 Cr | -2,413.2 Cr | +4,159.8 Cr |
Working Capital
| Efficiency Metric | FY 2023 | FY 2024 | FY 2025 |
|---|---|---|---|
Debtor Days Average number of days taken to collect customer payments. | - | - | - |
Creditor Days Average time taken to pay suppliers and vendors. | - | - | - |
Inventory Days Average number of days inventory remains unsold. | - | - | - |
CCC (Cash Conversion Cycle) (Debtor Days + Inventory Days - Creditor Days) | - | - | - |
Financial Ratios
Measures the company’s leverage relative to shareholder equity.
OBSERVATIONS & INSIGHTS
Return ratios recovered sharply after FY23 losses. ROE was approximately 12.7% in FY24 and 7.4% in FY25; the FY25 moderation reflects a much larger equity base after capital issuance and acquisition-related balance-sheet expansion.
Reported net debt/equity improved from 2.6x in FY23 to 2.2x in FY24 and remained around 2.2x in FY25. Absolute borrowings nevertheless increased materially in FY25 following acquisition financing.
Interest coverage is a key monitorable. EBIT-based coverage was only approximately 0.5x in FY25, versus 1.3x in FY24, because finance costs remained high and depreciation / exceptional items increased after acquisitions. EBITDA-to-finance-cost coverage was only about 1.1x in FY25.
The current ratio weakened from 1.2x in FY23 to 0.8x in FY25. Short-term liquidity is supported by cash generation and refinancing access, but current liabilities exceed current assets.
FY25 ROCE fell to approximately 4.9% as the capital employed denominator expanded sharply following G6 / other acquisitions. The ratio should be monitored as acquired assets mature and synergies are realised.
FY25 ROA of approximately 2.1% is also affected by the acquisition-led expansion in goodwill, intangible assets and right-of-use assets, making asset productivity and impairment risk important diligence areas.
Industry Overview
Industry Drivers
Expansion of Technological Capabilities
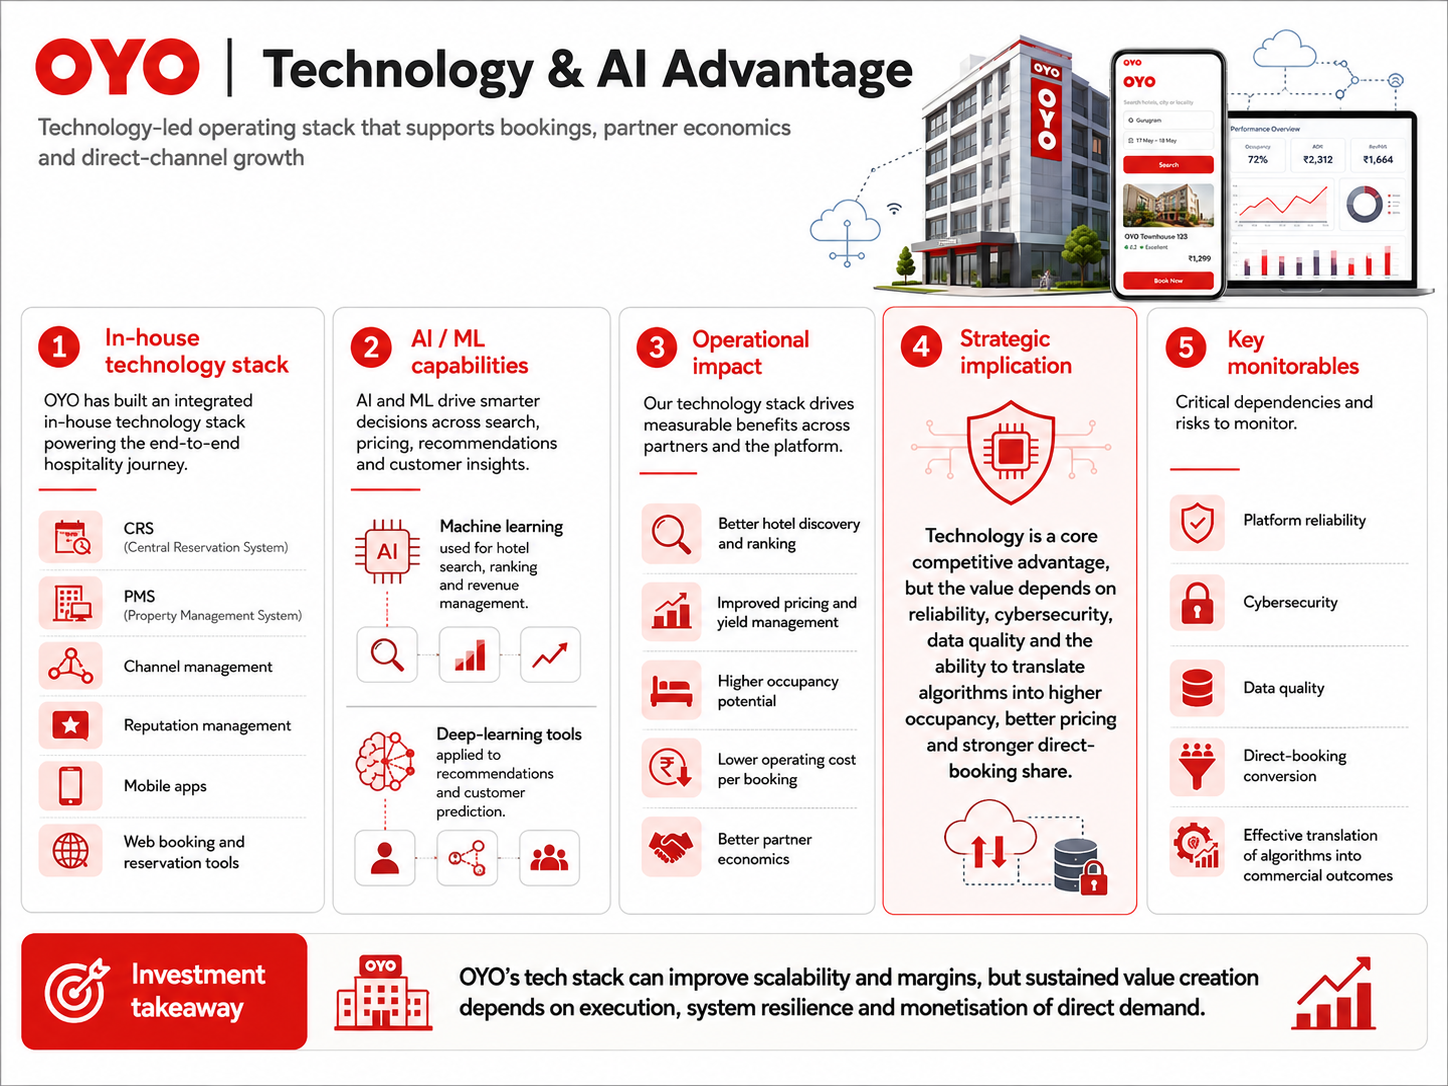
OYO has built an in-house technology stack covering CRS, PMS, channel management, reputation management, mobile apps, web booking and reservation tools
Machine learning is used for hotel search, ranking and revenue management, while deep-learning tools are being applied to recommendations and customer prediction.
AI-led yield management and automation can improve partner economics and reduce operating cost per booking
Strategic implication: technology is a core competitive advantage, but the value depends on reliability, cybersecurity, data quality and the ability to translate algorithms into higher occupancy, better pricing and stronger direct-booking share
Platform Scale and Operating Efficiency
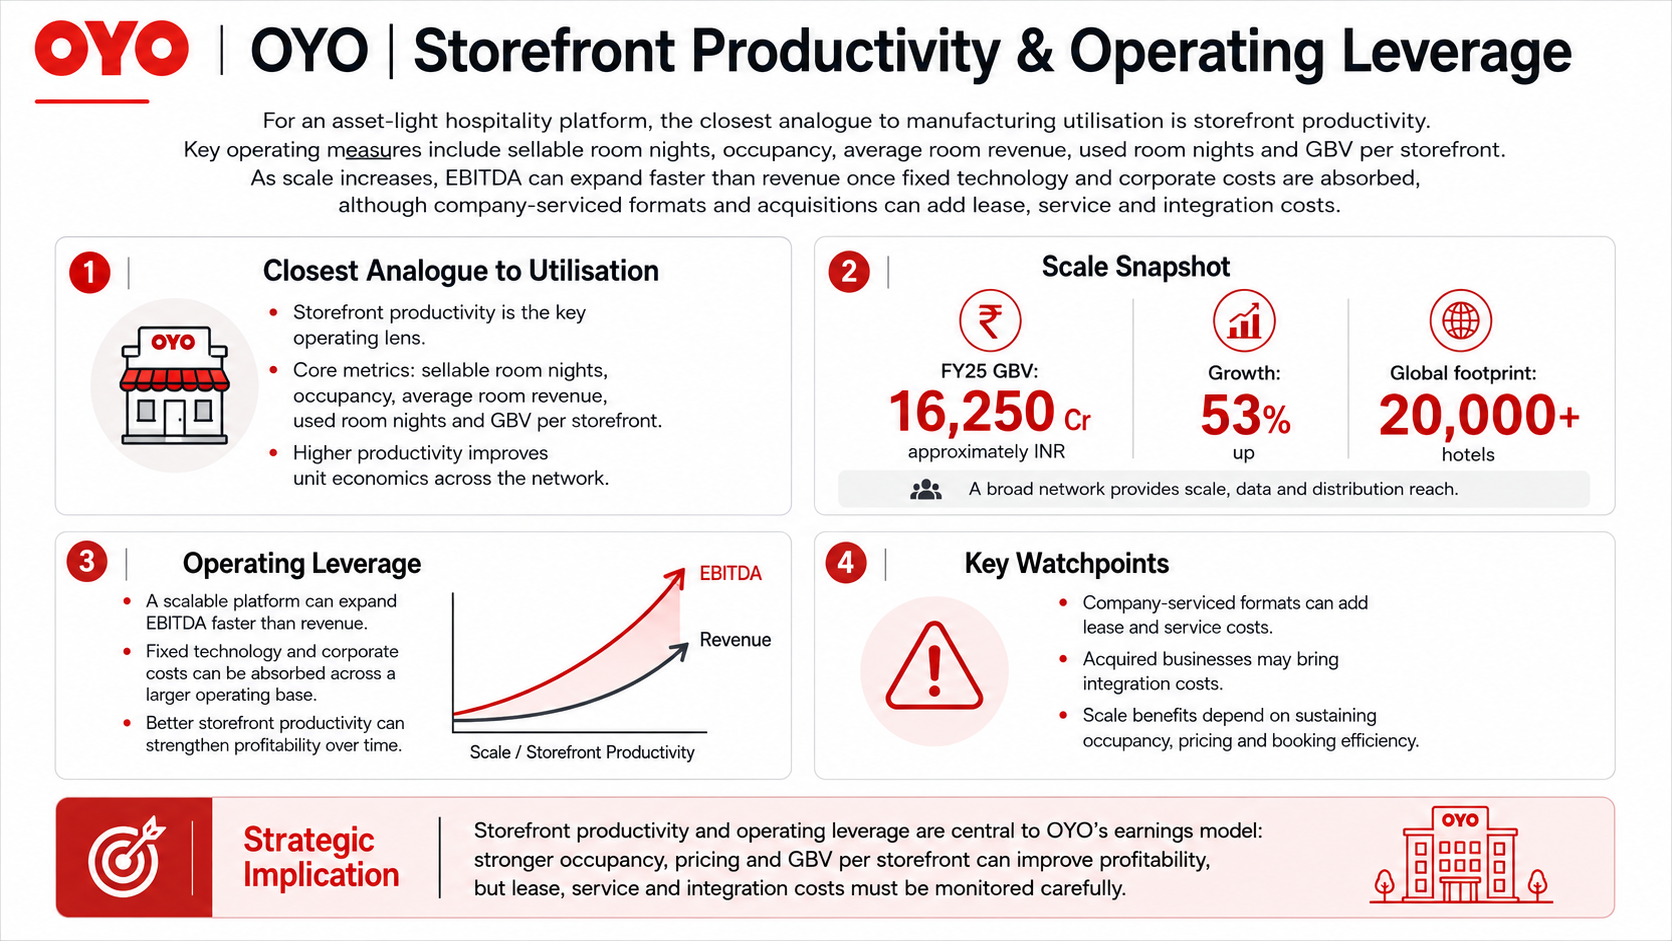
The closest analogue to manufacturing utilisation is storefront productivity: sellable room nights, occupancy, average room revenue, used room nights and GBV per storefront
The Company reported FY25 GBV of approximately INR 16,250 Cr, up 53%, and more than 20,000 hotels globally
A scalable platform can expand EBITDA faster than revenue once fixed technology and corporate costs are absorbed, but company-serviced formats and acquired businesses can add lease, service and integration costs
Global Market Penetration
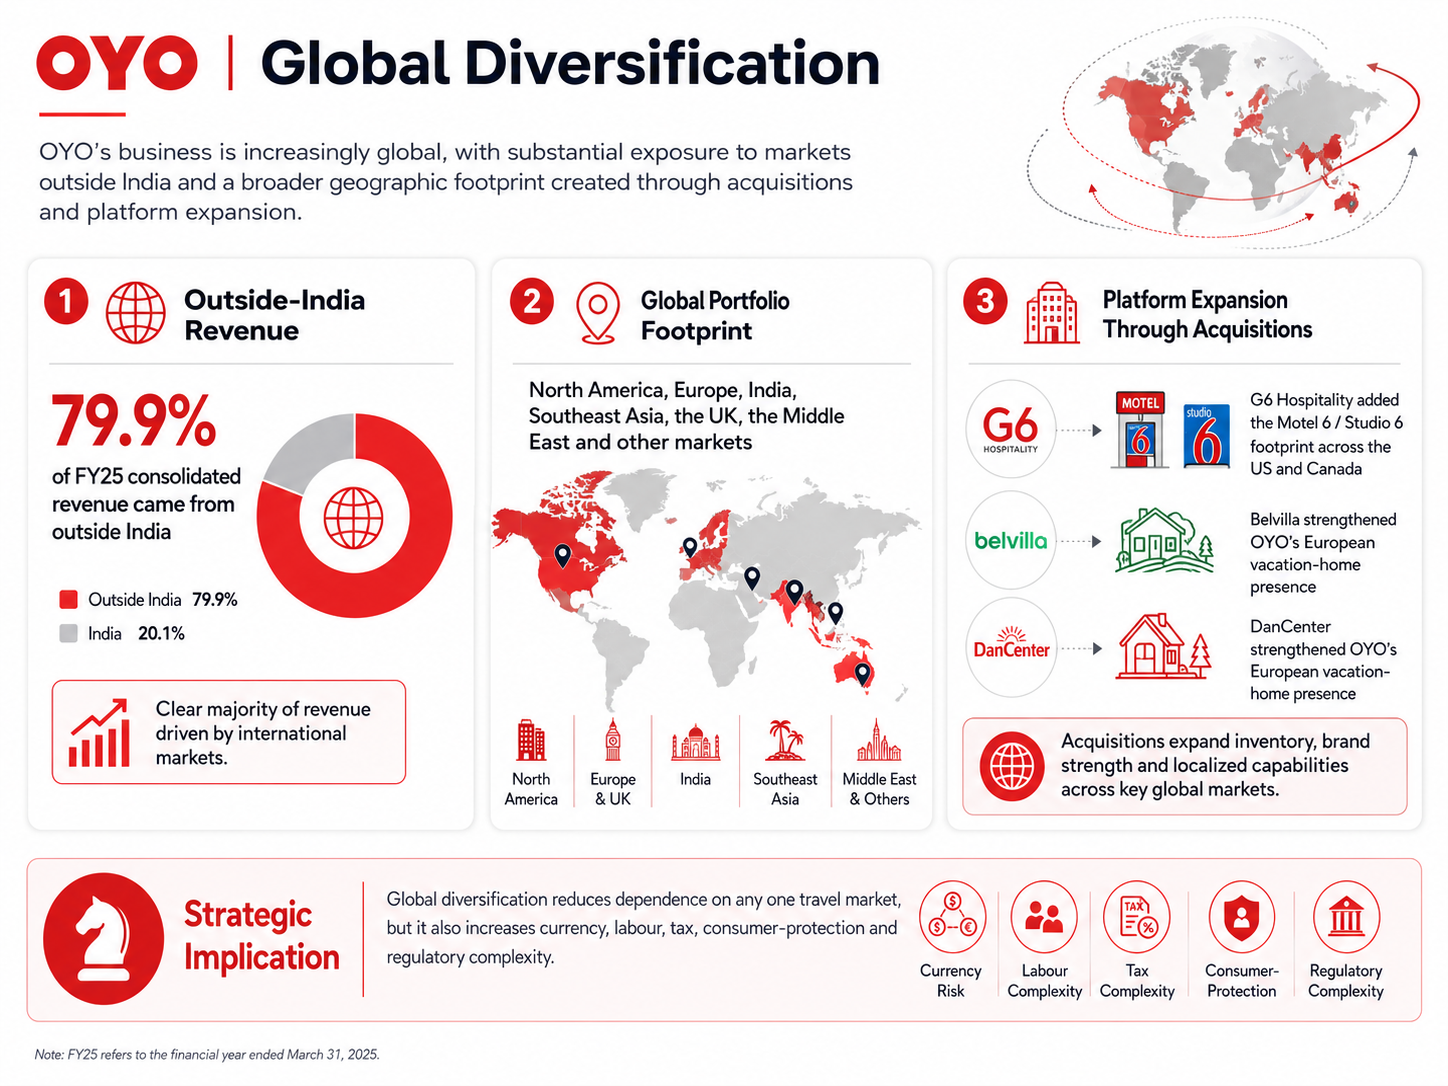
Outside-India revenue represented approximately 79.9% of FY25 consolidated revenue. The portfolio now spans North America, Europe, India, Southeast Asia, the UK, the Middle East and other markets
G6 Hospitality gives the Group an established Motel 6 / Studio 6 footprint in the US and Canada, while Belvilla and DanCenter provide a European vacation-home base
Global diversification reduces dependence on any one travel market, but increases currency, labour, tax, consumer-protection and regulatory complexity
Partner Network and Customer Relationship Depth
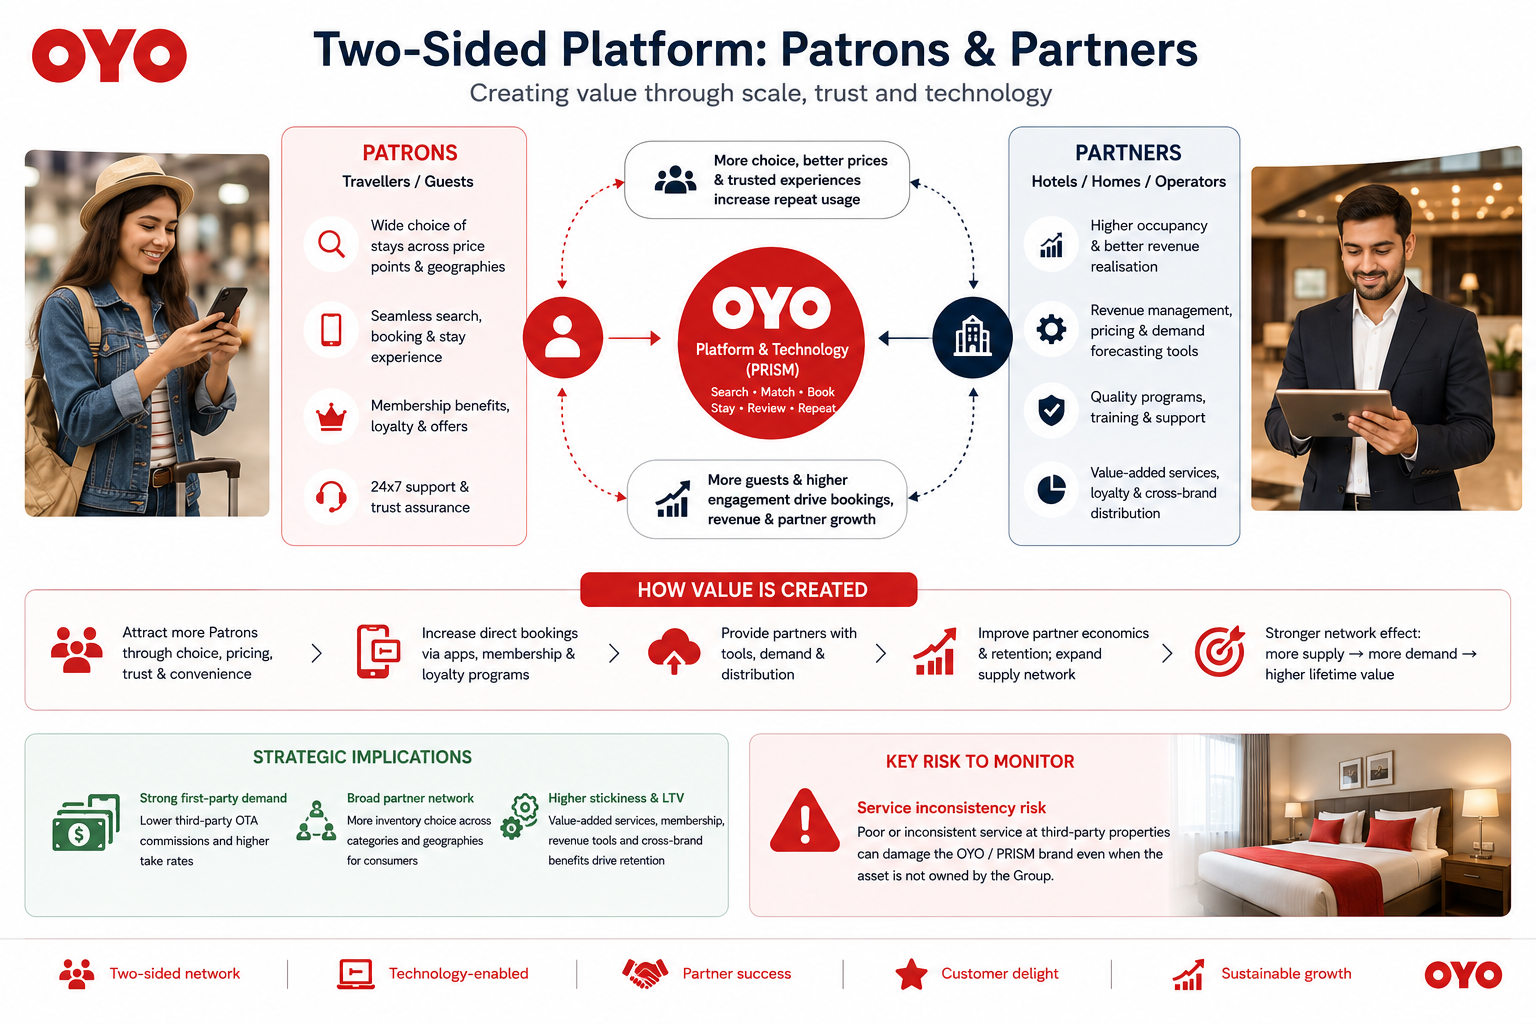
The two-sided platform depends on attracting and retaining Patrons while increasing repeat usage and direct bookings from travellers.
Value-added services, membership, direct apps, revenue-management tools and cross-brand distribution can increase partner stickiness and customer lifetime value
Strategic implication: strong first-party demand can lower third-party OTA commissions and improve take rates, while a broad partner network increases consumer choice
Service inconsistency at third-party properties can, however, damage the OYO / PRISM brand even when the underlying asset is not owned by the Group
Government Policy Support
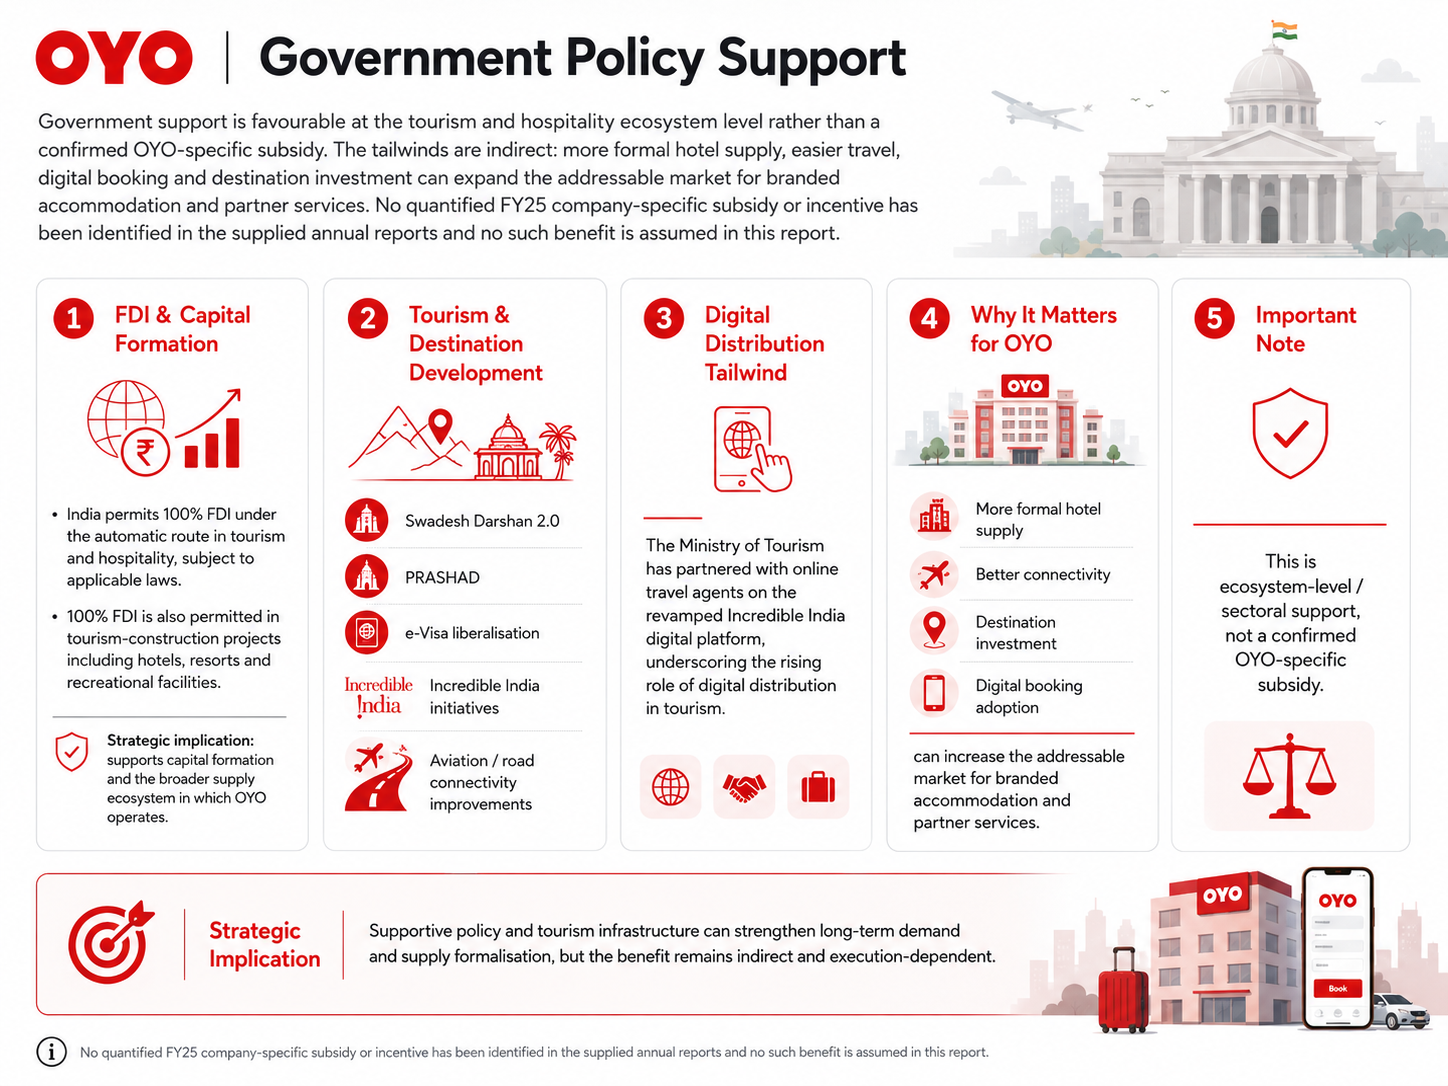
Government support is favourable at the tourism and hospitality ecosystem level rather than a confirmed OYO-specific subsidy. India permits 100% FDI under the automatic route in tourism and hospitality, subject to applicable laws, and also permits 100% FDI in tourism construction projects including hotels, resorts and recreational facilities. This supports capital formation and the broader supply ecosystem in which OYO operates
Tourism demand also benefits from destination-development and connectivity programmes such as Swadesh Darshan 2.0, PRASHAD, e-Visa liberalisation, Incredible India initiatives and aviation / road connectivity improvements
The Ministry of Tourism has also partnered with online travel agents on the revamped Incredible India digital platform, underscoring the increasing role of digital distribution in tourism
For OYO, these policies are indirect demand and ecosystem tailwinds: more formal hotel supply, easier travel, digital booking and destination investment can expand the addressable market for branded accommodation and partner services. No quantified FY25 company-specific subsidy or incentive has been identified in the supplied annual reports and no such benefit is assumed in this report
- Overview
- Business
- Financial Highlights
- Industry Overview
- Documentation
Get the Preqt App and keep in touch around the clock!
 Monitor your investments in real-time.
- Receive tailored deal suggestions.
- Get real-time updates and alerts.
