


Orbis Financial Corporation
Filtration That PerformsPrecision in Filtration
Unlisted Review Rating
Apply
DRHP Not FiledDelivering Precision Filtration for Automotive and Industrial Applications
Orbis Financial Corporation is a high-growth, high-margin and strategically positioned securities-services platform. The Company benefits from rising institutional capital-market participation, expansion of AIFs and foreign investment, technology-led scalability and increasing demand for independent custody and fund-administration services.
PARAMETER
WEIGHT
SCORE
KEY FACTORS
Financial Performance
25.0%
4.0/5
Orbis earnings growth during FY25. Revenue increased by 31.2%, while EBITDA and PAT grew by approximately 51.4% and 45.5%, respectively
Show more
Detailed Analysis
Revenue increasing from INR 294.2 Cr in FY23 to INR 551.4 Cr in FY25, representing a 2-year CAGR of 36.9%. FY25 revenue increased by 31.2%, from INR 420.1 Cr in FY24. Both measures indicate very strong growth
EBITDA increased from INR 246.1 Cr in FY24 to INR 372.7 Cr in FY25, representing growth of approximately 51.4%. EBITDA margin improved from 58.6% to 67.6%, demonstrating substantial operating leverage in the technology-led custody and securities-services platform
PAT increased from INR 138.9 Cr in FY24 to INR 202.0 Cr in FY25, representing growth of approximately 45.5%. PAT margin improved from 33.1% to 36.6%, indicating that profitability continued to grow faster than revenue
Operating cash flow was positive at INR 22.7 Cr in FY24, but turned negative at INR 109.7 Cr in FY25. The deterioration occurred despite strong PAT growth and was accompanied by an increase in debtor days from 28.2 days to 60.4 days
ROE improved from 20.3% in FY24 to 22.7% in FY25, while ROCE increased from 35.9% to approximately 41.0%
Industry
25.0%
4.0/5
Orbis operates in an attractive financial-infrastructure segment supported by the formalisation and deepening of India’s capital markets
Show more
Detailed Analysis
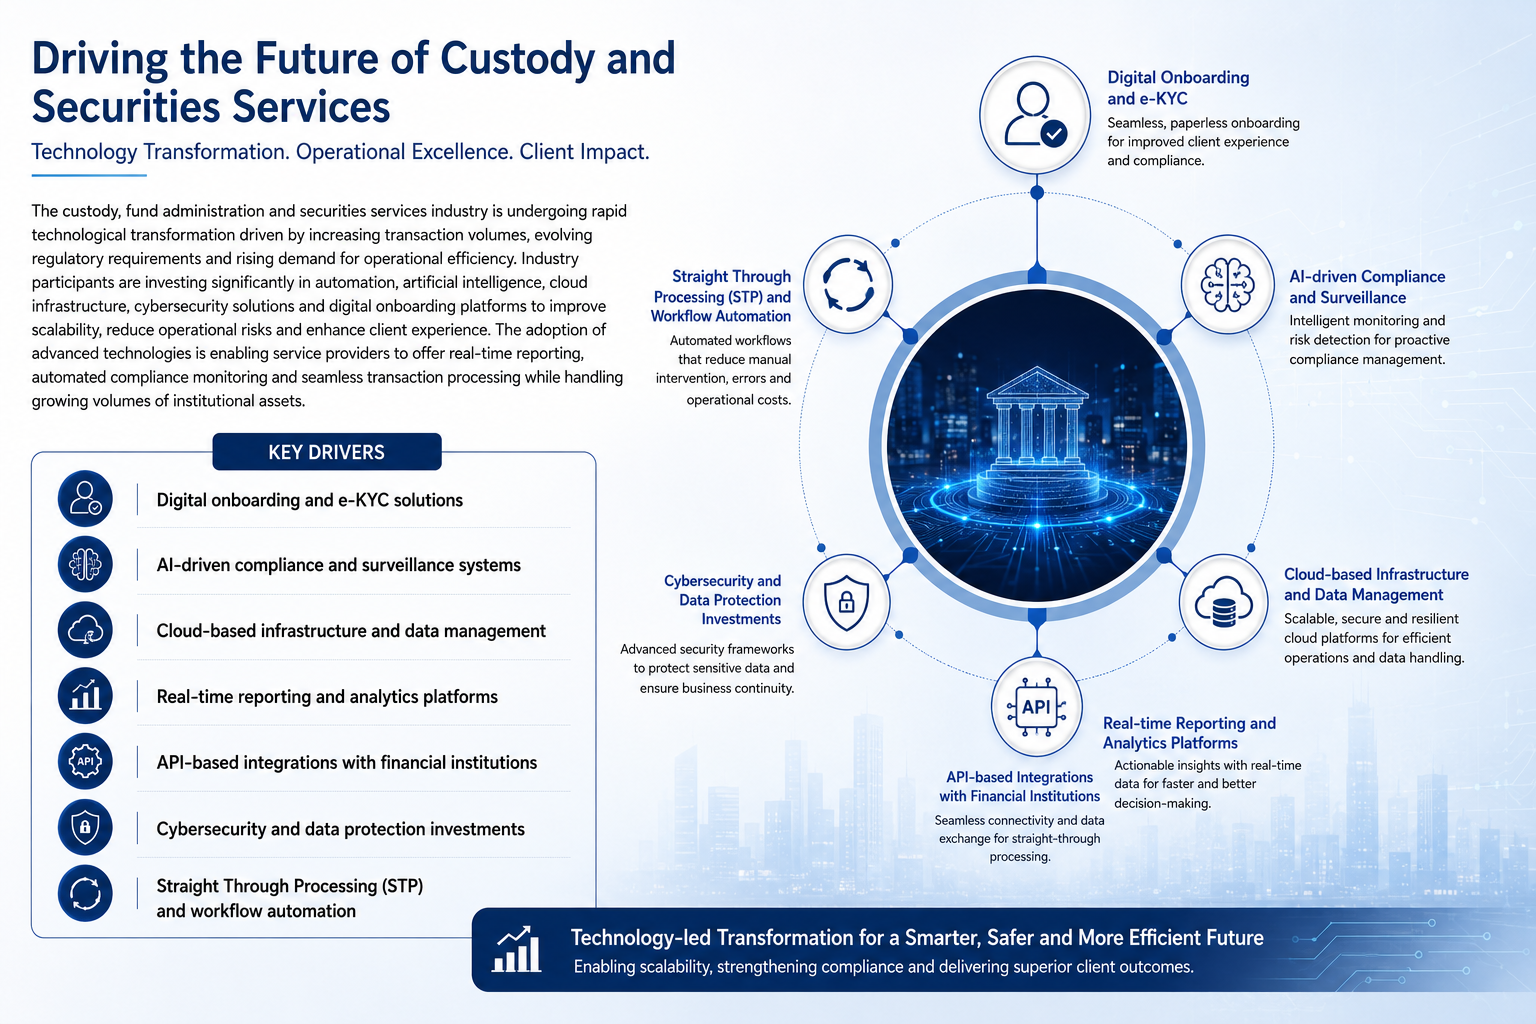
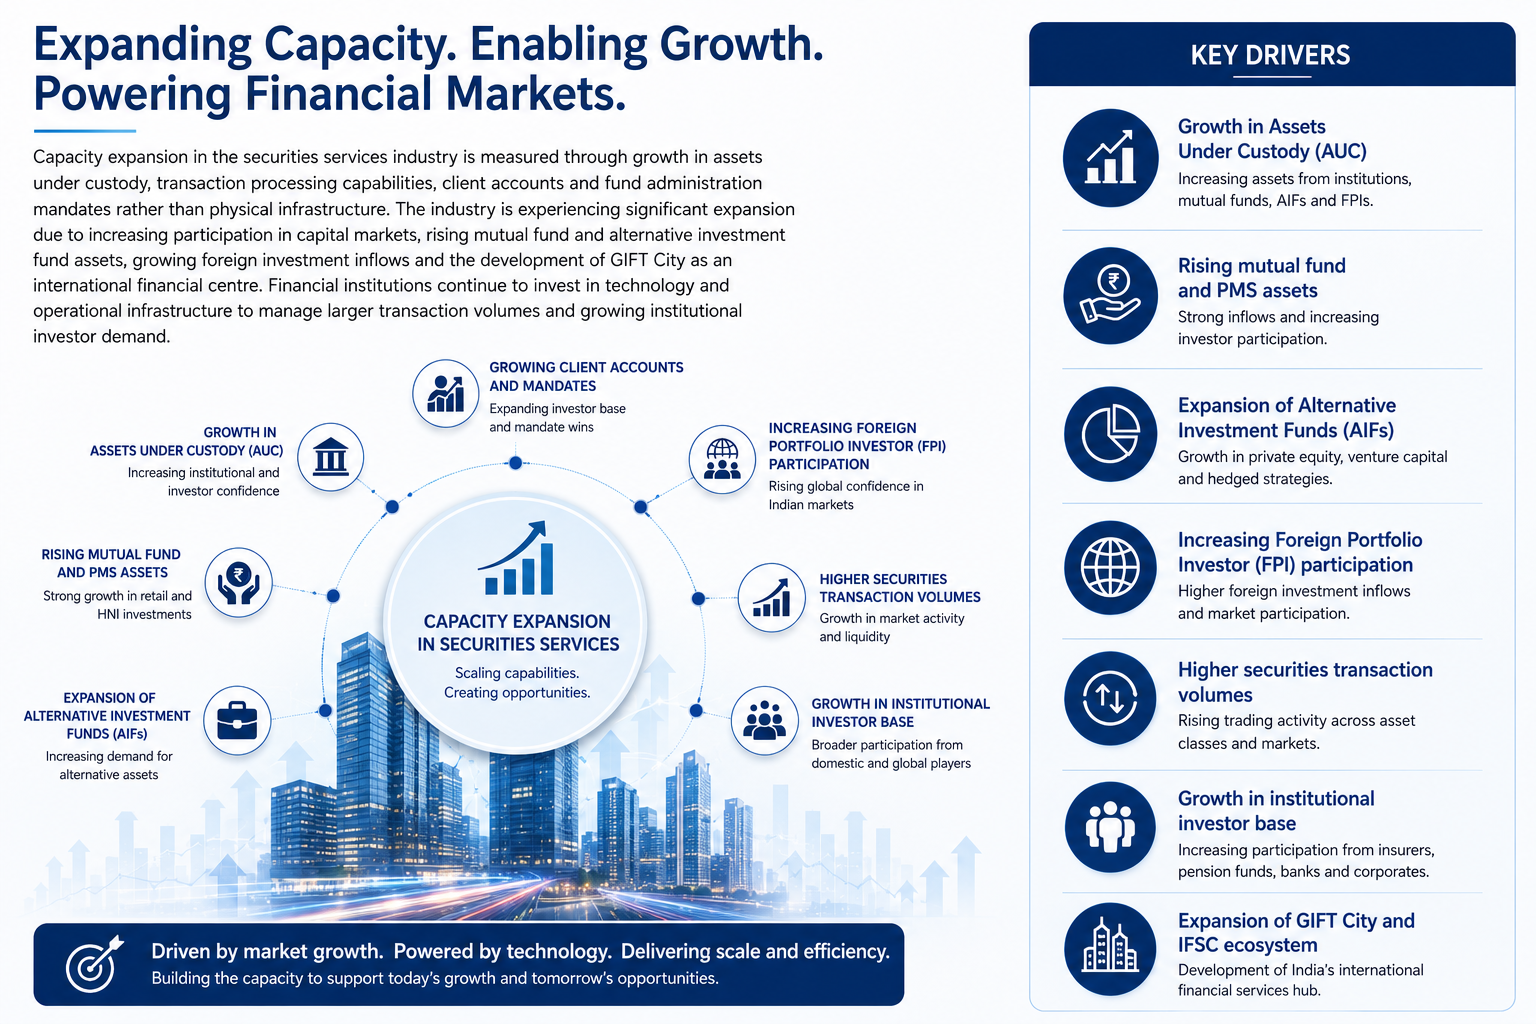
The capital-markets infrastructure and securities-services industry CAGR at 17.5%. Growth is supported by increasing institutional participation, AIF and mutual-fund assets, foreign investment, transaction volumes and expansion of the GIFT City ecosystem
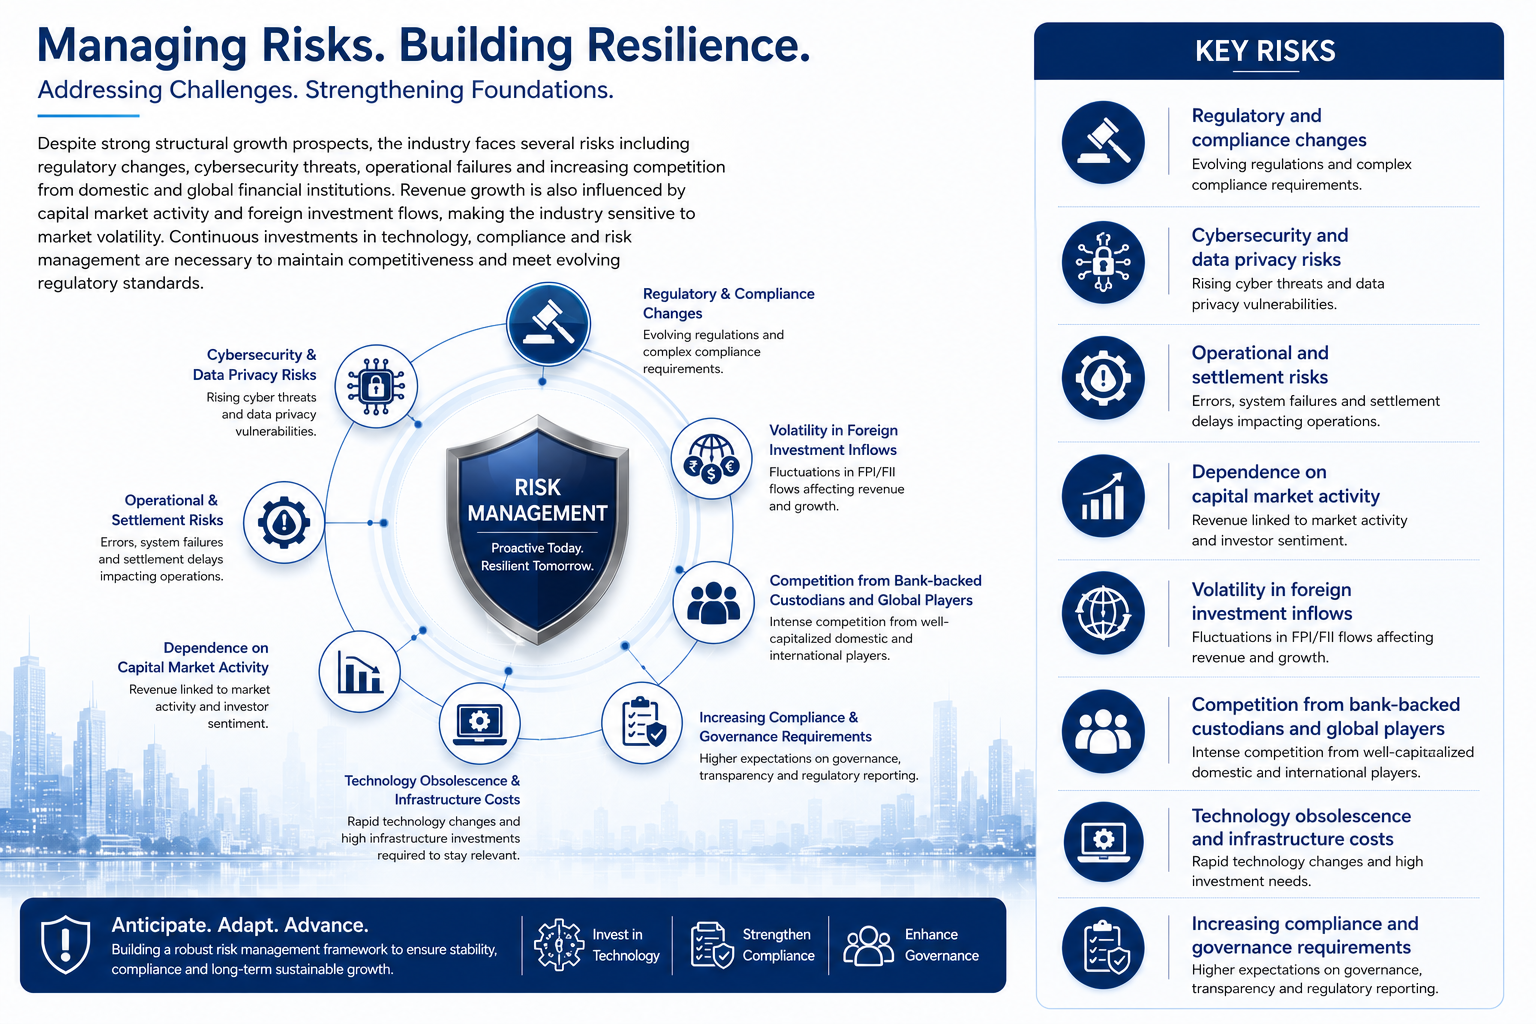
Orbis operates as a SEBI-regulated non-bank custodian and also provides DP, DDP, clearing, fund-accounting, RTA and trusteeship services. Regulation creates material compliance, cybersecurity and operational requirements, but it also creates high entry barriers and supports established compliant operators
Management
25.0%
4.0/5
Orbis benefits from highly experienced promoter leadership. Atul Gupta brings more than four decades of experience, while Managing Director and CEO Shyamsunder Agarwal leads the operating platform across custody, clearing, settlement, fund accounting and trusteeship
Show more
Detailed Analysis
Founder and Executive Chairman Atul Gupta has more than 40 years of experience across banking, financial services, consulting and manufacturing. He identified the market opportunity that led to the creation of Orbis and has direct experience in custody and capital-market infrastructure
The reviewed document identifies Siddartha Acharya and Pranay Kothari as independent directors, although Pranay Kothari ceased to be an independent director on March 25, 2025. The independent representation is of approximately 33.0%
Valuation
25.0%
5.0/5
Orbis appears attractively valued relative to listed financial-infrastructure peers on P/E and adjusted EV/EBITDA
Show more
Detailed Analysis
The Company is valued at a P/E multiple of 24.1x. The peer table in the financial document reports P/E multiples of 54.7x for CDSL, 43.4x for NSDL and 39.7x for CAMS, producing a median of 43.4x. Orbis therefore trades at a discount of approximately 44.4% to the selected peer median
EV/EBITDA is approximately 11.1x. The selected current peer median is approximately 31.3x, resulting in a discount of approximately 64.6%
The unlisted share price declined from approximately INR 390.0 in early July 2026 to INR 378.0 by July 20–21, 2026, representing an observed price range of approximately 3.1%
TOTAL
100%
4.3/5
Weighted Composite Score
Per Share Price
₹395.0
As of 18 Sep 2026
Minimum Investment
₹91,640.0 / 232 shares
Market Cap. (₹ Cr)
Revenue FY’25 (in Cr)
PAT FY’25 (in Cr)
P/E Multiple
Face Value
₹ 10.0Sale Type
UnlistedPAT FY’25 (in Cr)
₹ 202.1 CrPAT Margin (%)
36.6 %P/E Multiple
25.1xCAGR Growth 3Y
53.3 %ROE (FY’25)
22.7 %ROCE (FY’25)
43.0 %Price to Book Value ratio
5.4xDebt/Equity (FY’25)
4.0xMerchant banker appointed
❌ NoCompany Website
https://www.orbisfinancial.in/ Disclaimer: Unlisted shares are unregulated & illiquid. This is NOT investment advice. Please do your own due diligence before investing.
Minimum Investment
₹91,640.0 / 232 sharesShares Lot 1 X 232
Investment amount
₹91,640.0
Overview
Business
Business Model
Geographical Presence
Financial Highlights
Income Statement
Revenue growth with EBITDA and PAT margins
| Financial Metric | FY 2023 | FY 2024 | FY 2025 |
|---|---|---|---|
| Revenue (₹ Cr) | 294.2 | 420.1 | 551.4 |
| Growth (%) | 92.4% | 42.8% | 31.2% |
| EBITDA (₹ Cr) | 161.7 | 246.1 | 372.7 |
| EBITDA Margin (%) | 55.0% | 58.6% | 67.6% |
| PAT (₹ Cr) | 88.2 | 88.2 | 202.0 |
| PAT Margin (%) | 30.0% | 33.1% | 36.6% |
OBSERVATIONS & INSIGHTS
Revenue growth remains substantially above the industry growth rate (~17.5%), suggesting continued market share gains.
Orbis appears to have a highly scalable business model where additional clients and AUC generate significant incremental profitability without proportional cost increases.
Profitability is improving faster than revenue, indicating strong operating leverage and improving business quality.
Earnings compounding is accelerating, which typically commands premium valuations in capital market infrastructure businesses.
Balance Sheet
| Financial Metric | FY 2023 | FY 2024 | FY 2025 |
|---|---|---|---|
| EQUITY & LIABILITIES | ₹ 5,036.8 Cr | ₹ 4,978.4 Cr | ₹ 4,286.3 Cr |
| Net Worth | ₹ 425.9 Cr | ₹ 682.8 Cr | ₹ 891.6 Cr |
| Share Capital | ₹ 113.6 Cr | ₹ 121.7 Cr | ₹ 124.2 Cr |
| Reserves & Surplus | ₹ 312.3 Cr | ₹ 561.1 Cr | ₹ 767.4 Cr |
| Total Liabilities | ₹ 4,610.9 Cr | ₹ 4,295.6 Cr | ₹ 3,394.7 Cr |
| Current Liabilities | ₹ 4,597.1 Cr | ₹ 4,284.8 Cr | ₹ 3,384.4 Cr |
| Borrowings | ₹ 0.0 Cr | ₹ 0.0 Cr | ₹ 0.0 Cr |
| Trade Payables | ₹ 80.3 Cr | ₹ 64.3 Cr | ₹ 77.1 Cr |
| Other Current LiabilitiesThis includes Short term provisions as well | ₹ 4,516.8 Cr | ₹ 4,220.5 Cr | ₹ 3,307.3 Cr |
| Non-Current Liabilities | ₹ 13.8 Cr | ₹ 10.8 Cr | ₹ 10.3 Cr |
| Borrowings | ₹ 0.0 Cr | ₹ 0.0 Cr | ₹ 0.0 Cr |
| Other Non-Current LiabilitiesThis includes Net DTL, OLT Liabilities, Long term provisions | ₹ 13.8 Cr | ₹ 10.8 Cr | ₹ 10.3 Cr |
| ASSETS | ₹ 5,036.9 Cr | ₹ 4,978.5 Cr | ₹ 4,286.5 Cr |
| Current Assets | ₹ 4,647.7 Cr | ₹ 4,872.0 Cr | ₹ 4,182.5 Cr |
| Trade Receivables | ₹ 28.9 Cr | ₹ 32.4 Cr | ₹ 91.2 Cr |
| Inventory | ₹ 79.4 Cr | ₹ 36.4 Cr | ₹ 28.9 Cr |
| Cash & Cash Equivalents | ₹ 4,133.7 Cr | ₹ 4,575.2 Cr | ₹ 3,975.2 Cr |
| Other Current AssetsThis includes Short term Loans & Advances, OCA and Other Current Assets | ₹ 405.7 Cr | ₹ 228.0 Cr | ₹ 87.2 Cr |
| Non-Current Assets | ₹ 389.2 Cr | ₹ 106.5 Cr | ₹ 104.0 Cr |
| Fixed Assets | ₹ 25.8 Cr | ₹ 24.0 Cr | ₹ 32.4 Cr |
| Other Non-Current Assets | ₹ 363.4 Cr | ₹ 82.5 Cr | ₹ 71.6 Cr |
OBSERVATIONS & INSIGHTS
Strong Liquidity Position
The company maintains an exceptionally strong cash balance of ₹3,975 Cr as of FY25, despite a decline from ₹4,575 Cr in FY24.
Cash and cash equivalents constitute approximately 93% of total assets, indicating a highly liquid balance sheet.
Debt-Free Balance Sheet
The company has nil borrowings across FY23–FY25.
Non-current liabilities remain negligible at ₹10–14 Cr, resulting in an extremely conservative capital structure and minimal financial risk.
Healthy Net Worth Growth
Shareholders' equity increased from ₹426 Cr in FY23 to ₹892 Cr in FY25, representing a CAGR of approximately 45%.
The increase indicates sustained profitability and earnings retention.
Reduction in Total Assets
Total assets declined from ₹5,037 Cr in FY23 to ₹4,286 Cr in FY25.
The decline is primarily attributable to lower cash balances and liquidation/redeployment of certain financial assets rather than operational stress.
Improvement in Working Capital Intensity
Trade receivables increased significantly from ₹29 Cr in FY23 to ₹91 Cr in FY25.
While still small relative to total assets, the rise should be monitored to ensure collections remain healthy.
Declining Investment Portfolio
Non-current investments reduced from ₹90 Cr in FY23 to ₹61 Cr in FY25.
This may indicate monetization of investments or redeployment of capital into operations and shareholder returns.
Growth in Intangible Assets
Intangible assets increased materially from ₹0.69 Cr in FY23 to ₹9.73 Cr in FY25.
This suggests investment in technology, software platforms, licenses, intellectual property, or business acquisitions.
Limited Fixed Asset Requirement
Net fixed assets remain modest at ₹32 Cr despite the company's large balance sheet.
This indicates an asset-light business model with low capital expenditure requirements.
Strong Solvency Metrics
Equity represents approximately 21% of total assets in FY25 versus 8% in FY23.
The improvement demonstrates strengthening capitalization and reduced reliance on current liabilities.
Potential Efficiency Focus Area
Current liabilities remain high at ₹3,384 Cr despite the absence of financial debt.
Management should continue focusing on optimizing working capital and reducing dependency on short-term obligations.
Cash Flow
| Financial Metric | FY 2023 | FY 2024 | FY 2025 |
|---|---|---|---|
CFO (₹ Cr) Cash generated from core business operations. | -182.1 Cr | +22.7 Cr | -109.7 Cr |
CFI (₹ Cr) Cash used for investments and long-term assets. | -76.6 Cr | +65.5 Cr | +4.7 Cr |
CFF (₹ Cr) Cash flow related to funding and borrowings. | +67.5 Cr | +27.7 Cr | -107.1 Cr |
Working Capital
| Efficiency Metric | FY 2023 | FY 2024 | FY 2025 |
|---|---|---|---|
Debtor Days Average number of days taken to collect customer payments. | - | - | - |
Creditor Days Average time taken to pay suppliers and vendors. | - | - | - |
Inventory Days Average number of days inventory remains unsold. | - | - | - |
CCC (Cash Conversion Cycle) (Debtor Days + Inventory Days - Creditor Days) | - | - | - |
Financial Ratios
Measures the company’s leverage relative to shareholder equity.
OBSERVATIONS & INSIGHTS
Management is deploying capital efficiently and growth is not coming at the cost of shareholder returns.
Very few financial infrastructure companies sustain ROCE above 40%; this indicates strong competitive positioning.
Balance sheet risk is reducing while profitability improves.
Financing costs are growing with business volume but remain manageable.
The absence of inventory and improving liquidity metrics highlight the efficiency of Orbis' business model and reduce working capital-related risks.
Industry Overview
Industry Drivers
Expansion of Technological Capabilities
Capacity Expansion
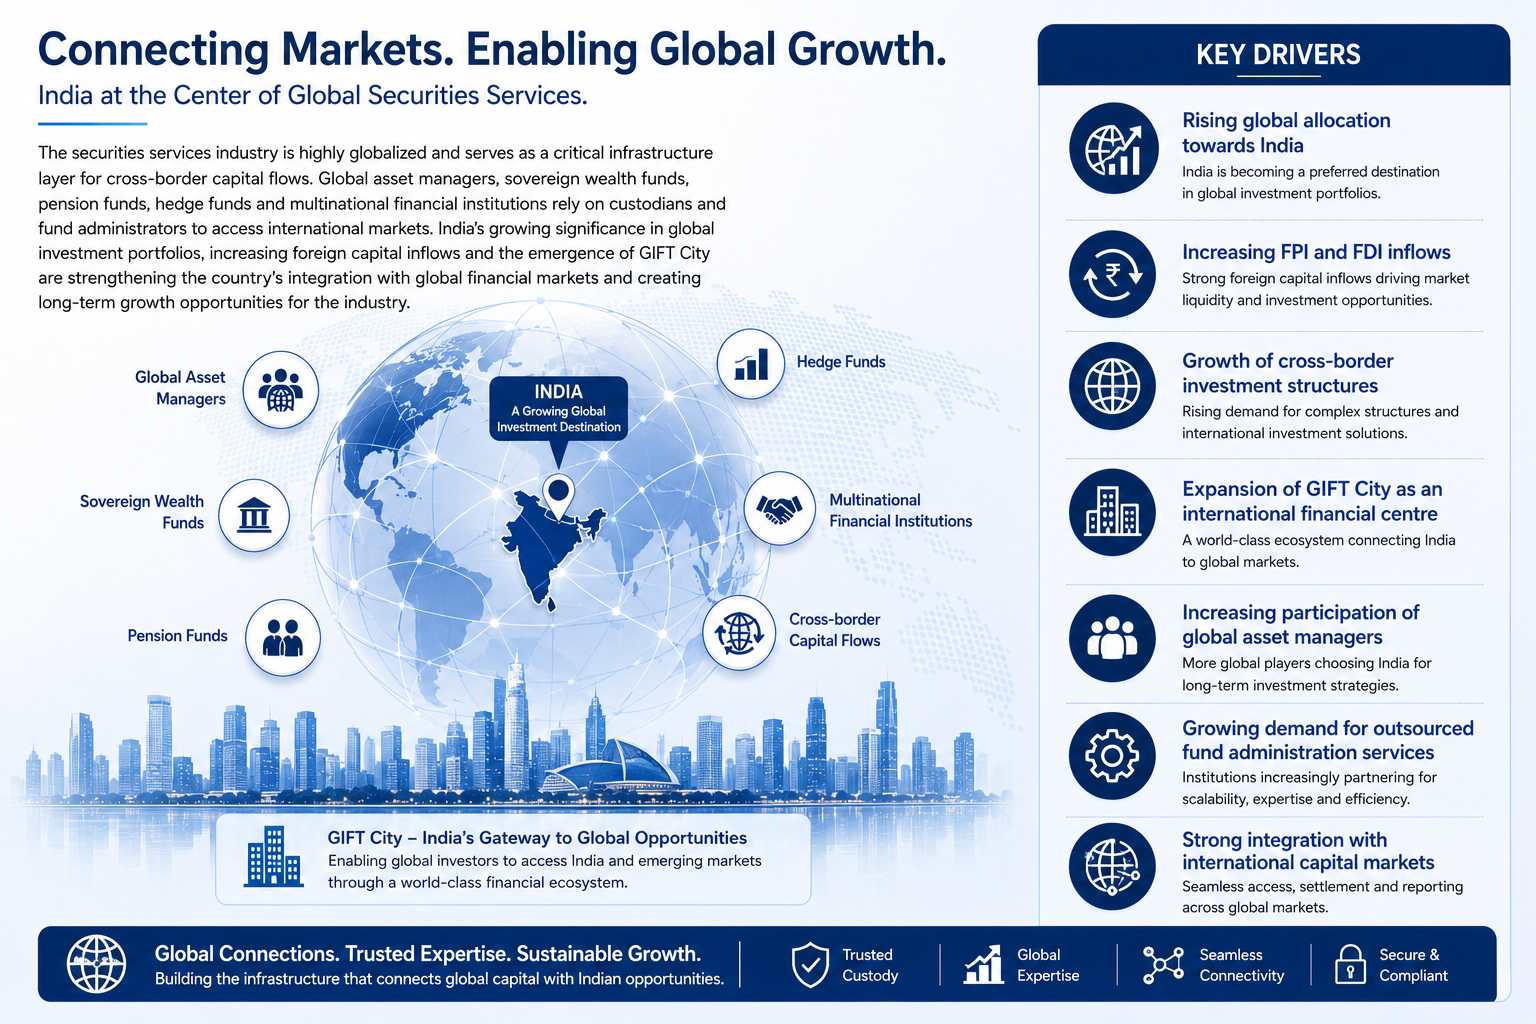
Global Market Penetration
Risks in the Industry
Government Policy Support
No data available
- Overview
- Business
- Financial Highlights
- Industry Overview
- Documentation
Get the Preqt App and keep in touch around the clock!
 Monitor your investments in real-time.
- Receive tailored deal suggestions.
- Get real-time updates and alerts.
