


Orient Cables (India)
Connecting What MattersEngineering Connectivity Forward
IPO Summary (PreQT)
Orient Cables (India) Limited is a B2B wires-and-cables manufacturer focused on networking cables, specialty power and optical-fibre cables, with three manufacturing facilities across Bhiwadi and Bengaluru. FY26 revenue from operations increased 42.0% YoY to INR 1,171.7 Cr, while EBITDA was INR 96.4 Cr and PAT attributable to owners was INR 53.8 Cr. At the announced INR 258-INR 272 price band, the IPO implies a post-issue market capitalisation of approximately INR 2,936.0-INR 3,095.4 Cr and FY26 P/E of 49.0x-51.6x. The investment case combines a 22.9% FY26 networking-cables market share, strong telecom/broadband exposure, capacity expansion and new specialty-cable verticals, offset by high customer concentration, rising leverage/working-capital intensity and negative operating cash flow in FY25-FY26.
IPO Review Rating
Below Avg
MainboardBuilding Reliable Connectivity Through Precision Cable Manufacturing Excellence
Orient Cables presents a strong growth and industry-positioning story, supported by 33.5% FY24–FY26 revenue CAGR, 25.8% FY26 RoE, 22.9% share in India's networking-cables market and exposure to networking and fibre-optic segments projected to grow at 18.7% and 17.3% CAGR, respectively.
The IPO also improves the balance sheet, with ₹155.5 Cr earmarked for debt repayment and ₹91.5 Cr for manufacturing capex. Governance comfort is supported by no promoter pledge and FY26 related-party transactions of only 0.7% of revenue.
However, the issue carries meaningful offsets. FY26 operating cash flow was negative, the top 10 customers contributed 76.5% of revenue, and the IPO contains a sizeable 42.0% OFS. Valuation is also demanding: the post-Issue P/E of ~57.5x is above the ~47.8x peer median, while the historical FY26 P/B is approximately 11.8x.
The business quality and growth outlook are attractive, but the current valuation leaves limited room for execution disappointment. Anchor quality, QIB participation and final subscription levels should be important before forming the final IPO view
PARAMETER
WEIGHT
SCORE
KEY FACTORS
Financial Performance
40.0%
3.0/5
Orient Cables delivers excellent revenue growth and high ROE, with manageable leverage. However, operating margins remain moderate, cash flow was negative in both FY25 and FY26, and customer concentration is substantial, with the top ten contributing over three-fourths of revenue
Show more
Detailed Analysis
FY24–FY26 Revenue CAGR is 33.5%
FY26 EBITDA margin was 8.2%.
FY26 PAT margin was 4.6%.
FY26 Debt/Equity was 0.9x
FY26 ROE was a strong 25.8%.
FY25 and FY26 OCF were both negative
Industry
15.0%
3.0/5
Orient operates in a structurally growing cables market, with particularly strong networking and fibre-optic demand. Its 22.9% networking-cable market share provides meaningful positioning. Regulatory compliance is manageable, although competition, technological change and relatively modest export contribution remain important considerations
Show more
Detailed Analysis
Indian wires & cables market projected at 13.4% CAGR FY26–FY31
BIS/product standards and export/trade regulation create moderate compliance requirements
Exports represented 9.3% of FY26 Revenue; global broadband cables market has ~10.6% projected CAGR
Management
15.0%
4.0/5
Orient benefits from experienced promoters, 50.0% Board independence, no promoter pledge and very low related-party transaction intensity. The principal governance concern is the disclosed wilful-defaulter classification involving a non-operating Promoter Group member, although the underlying loan is reportedly repaid
Show more
Detailed Analysis
Vipul Nagpal has 20+ years of wires-and-cables manufacturing experience
3 of 6 Directors are Independent which is 50.0%
No promoter-share pledge; however, a Promoter Group member remains disclosed on a wilful-defaulter list pending NOC
FY26 aggregate RPTs were only 0.7% of Revenue
Valuation
20.0%
3.0/5
Orient's valuation is demanding relative to most listed cable peers. Post-Issue P/E of 57.5x stands around 20% above the peer median and historical P/B is 11.8x. Strong growth and 25.8% RoNW partly support the premium
Show more
Detailed Analysis
P/E is 57.5x, ~20.2% premium to peer median of 47.8x
P/B is 11.8x using FY26 RHP NAV/share
FY26 ROE is 25.8%
Merchant Banker Track Record
10.0%
4.0/5
IIFL and JM Financial provide substantial mainboard execution capability. Their 2026 mandates average approximately 8.6% listing gains and 39.6x subscription, with about 71.7% positive listings. Strong institutional distribution supports execution, though individual IPO outcomes remain issuer-specificThe combined 2026 mainboard mandates of IIFL Capital Services and JM Financial have delivered an average listing gain of approximately 8.6%
Show more
Detailed Analysis
The combined 2026 mainboard mandates of IIFL Capital Services and JM Financial have delivered an average listing gain of approximately 8.6%
Their 2026 mainboard IPO mandates have recorded an average subscription level of approximately 39.6x
Approximately 71.7% of their tracked 2026 mainboard IPOs have listed above the respective issue price
TOTAL
100%
3.3/5
Weighted Composite Score
Issue Price
₹258.0 to ₹272.0
As of 24 Sep 2026
GMP
₹45.0
As of 24 Sep 2026
Estimated Gain / Loss
+16.5%
Lot Size
55.0 Shares
Grey Market Premium (GMPs) are shared for knowledge purpose only. PrEqt doesn’t promote or execute the trades.
| Issue size | |
|---|---|
| Overall | ₹552.0 Cr |
| Fresh Issue | ₹320.0 Cr |
| Offer for Sale | ₹232.0 Cr |
Minimum Investment
₹14,960.0 / 3,025 shares

Merchant Banker
IIFL Capital Services Ltd., JM Financial Services
IIFL Capital Services Ltd.
JM Financial Services
IPO Document
Offer Start Date
Offer End Date
Valuation
Revenue (FY'26)
PAT (FY'26)
Issue Size
Face Value
₹ 1.0Offer Price
₹ 272.0Lot Size
55.0 sharesSale Type
Fresh capital cum OFSPAT (FY'26)
₹ 53.8 CrPAT Margin (FY'26)
4.6 %P/E Multiple
57.5xEBITDA (FY'26)
₹ 96.4 CrCAGR Growth 2Y
33.5 %ROE (FY'26)
25.8 %ROCE (FY'26)
23.8 %Price to Book Value
11.8xDebt/Equity
0.9xCompany Website
orientcables.inExplore new deals
Overview
Fund Allocation
Total: ₹0 CrSource:Company DRHP
Timeline
IPO Open Date
To Be Announced
IPO Close Date
To Be Announced
Tentative Allotment
To Be Announced
Initiation of Refunds
To Be Announced
Credit of Shares to Demat
To Be Announced
Tentative Listing Date
To Be Announced
Business
Products
Business Model
Geographical Presence
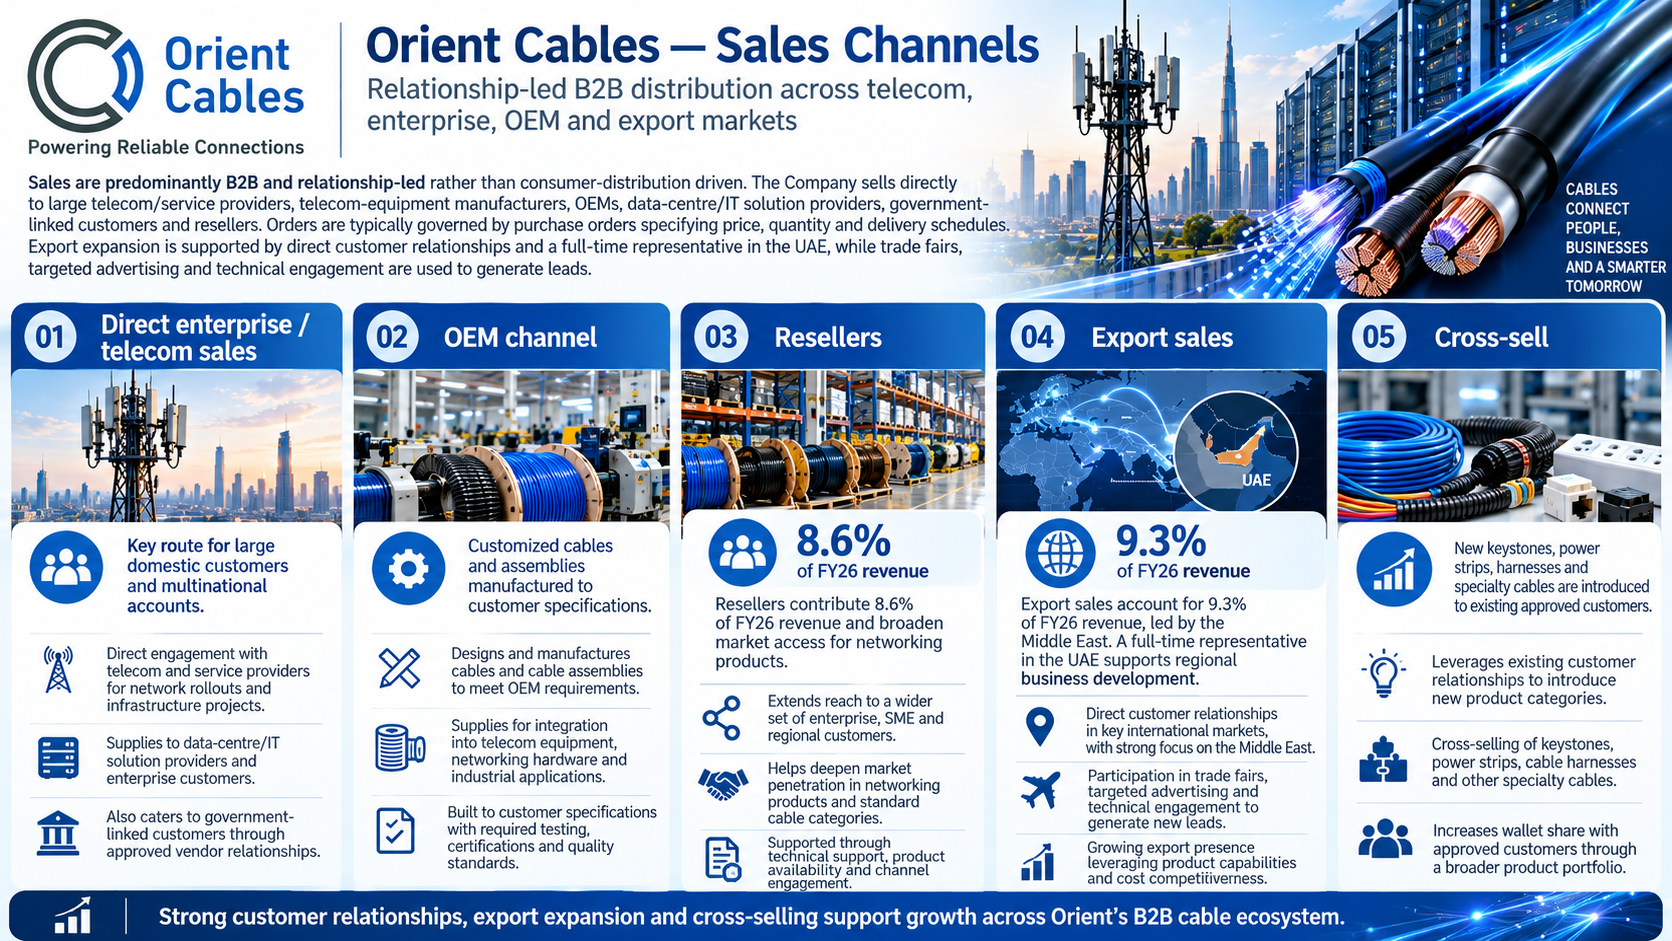
Sales Channel
Key Risk Factor
Financial Highlights
Income Statement
Revenue growth with EBITDA and PAT margins
| Financial Metric | FY 2024 | FY 2025 | FY 2026 |
|---|---|---|---|
| Revenue (₹ Cr) | 665.0 | 831.9 | 1,181.7 |
| Growth (%) | - | 25.4% | 42.0% |
| EBITDA (₹ Cr) | 58.8 | 83.9 | 96.4 |
| EBITDA Margin (%) | 8.9% | 10.2% | 8.2% |
| PAT (₹ Cr) | 40.1 | 53.3 | 53.8 |
| PAT Margin (%) | 6.0% | 6.4% | 4.6% |
OBSERVATIONS & INSIGHTS
Revenue accelerated from 25.4% growth in FY25 to 42.0% in FY26, driven by stronger telecom contribution, capacity additions and continued networking-cable demand
EBITDA grew in absolute terms to INR 96.4 Cr in FY26, but margin declined to 8.2% from 10.2% in FY25, indicating growth with lower operating margin despite scale
PAT was broadly flat at INR 53.8 Cr in FY26 versus INR 53.3 Cr in FY25; PAT margin compressed to 4.6% from 6.4% as finance cost increased and margin normalized
Balance Sheet
| Financial Metric | FY 2024 | FY 2025 | FY 2026 |
|---|---|---|---|
| Net Worth | ₹ 127.5 Cr | ₹ 180.7 Cr | ₹ 235.8 Cr |
| Total Assets | ₹ 293.2 Cr | ₹ 427.2 Cr | ₹ 580.8 Cr |
| Total Borrowing | ₹ 36.7 Cr | ₹ 113.5 Cr | ₹ 234.2 Cr |
| Reserves & Surplus | ₹ 126.5 Cr | ₹ 170.5 Cr | ₹ 224.3 Cr |
OBSERVATIONS & INSIGHTS
Total assets nearly doubled between FY24 and FY26, driven by PPE, inventory and receivables expansion
Borrowings increased from INR 36.7 Cr in FY24 to INR 234.2 Cr in FY26, materially faster than equity growth
Trade payables declined in FY26 even as the business scaled, contributing to higher working-capital funding needs
Cash Flow
| Financial Metric | FY 2024 | FY 2025 | FY 2026 |
|---|---|---|---|
CFO in Cr Cash generated from core business operations. | +42.2 Cr | -9.8 Cr | -26.6 Cr |
CFI in Cr Cash used in / generated from investing activities. | -32.7 Cr | -59.8 Cr | -63.6 Cr |
CFF in Cr Cash from / used in financing activities. | -6.1 Cr | +63.1 Cr | +101.7 Cr |
Working Capital
| Efficiency Metric | FY 2023 | FY 2024 | FY 2025 |
|---|---|---|---|
Debtor Days Average number of days taken to collect customer payments. | - | - | - |
Creditor Days Average time taken to pay suppliers and vendors. | - | - | - |
Inventory Days Average number of days inventory remains unsold. | - | - | - |
CCC (Cash Conversion Cycle) (Debtor Days + Inventory Days - Creditor Days) | - | - | - |
Financial Ratios
Measures the company’s leverage relative to shareholder equity.
OBSERVATIONS & INSIGHTS
Leverage increased materially through FY26 as expansion and working-capital needs were funded partly by debt
Interest coverage remains positive but declined sharply from FY24 as finance costs rose faster than operating profit
Current ratio stayed above 1.0x, though liquidity quality depends heavily on receivables and inventories
ROA and return ratios weakened in FY26 despite strong revenue growth, reflecting a larger asset/capital base and margin compression
Industry Overview
Industry Drivers
Structural Growth in Indian Wires & Cables
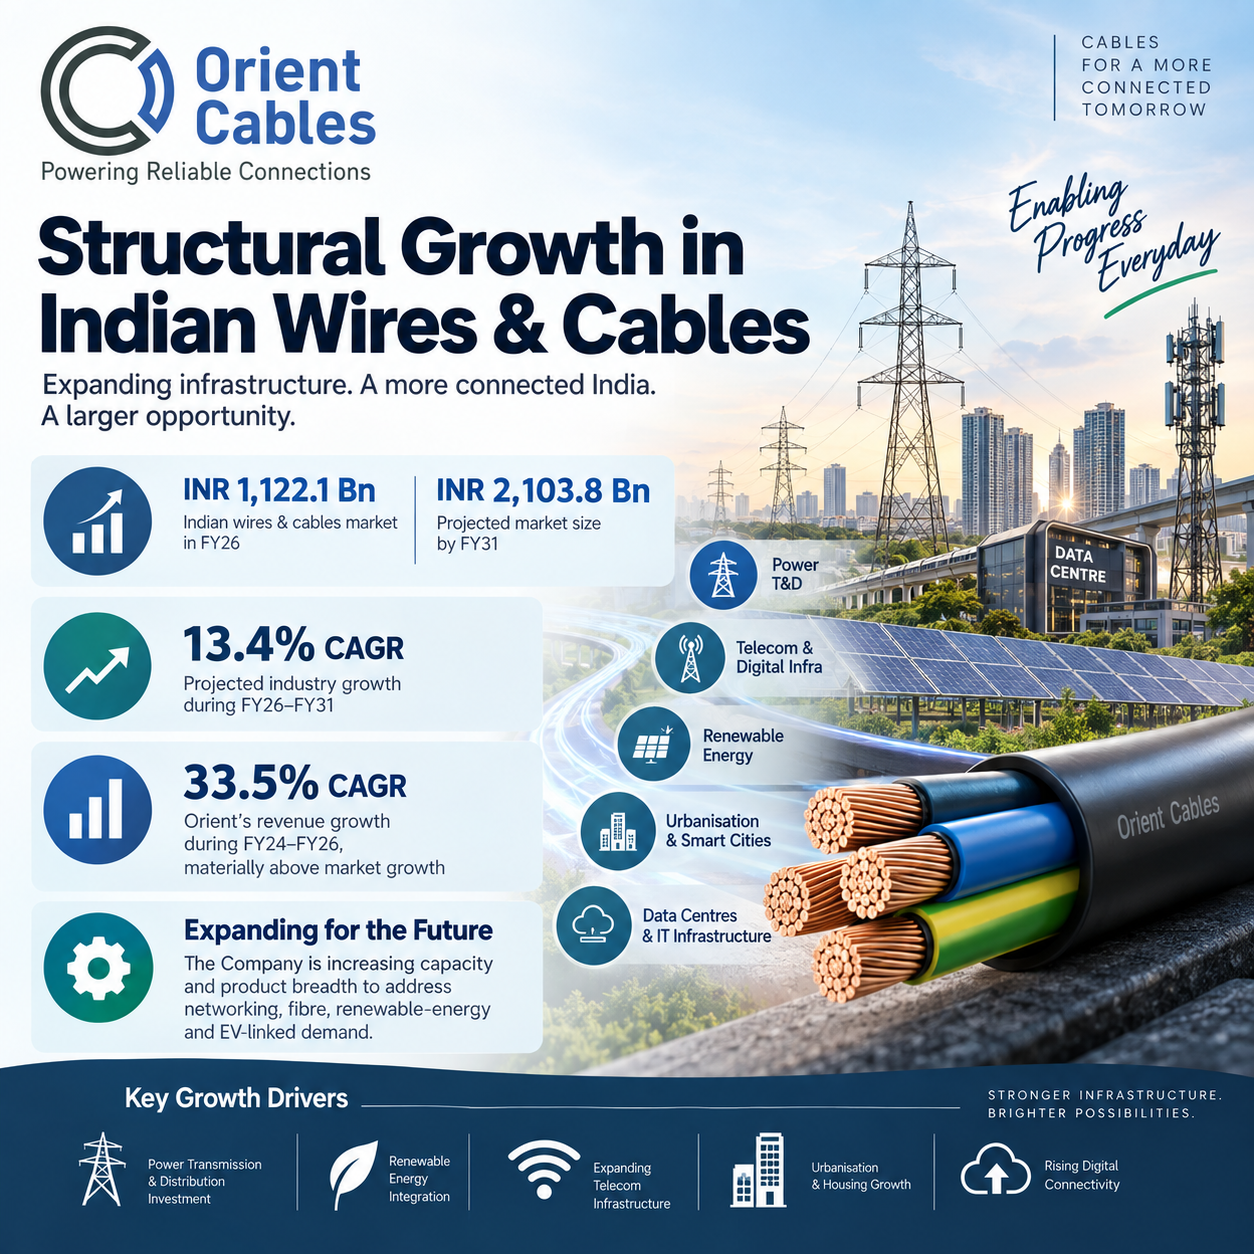
India's wires and cables market reached approximately INR 1,122.1 Bn in FY26 and is projected by 1Lattice to reach approximately INR 2,103.8 Bn by FY31, implying a 13.4% CAGR. Growth is supported by power transmission and distribution investment, renewable-energy integration, telecom infrastructure, urbanisation and rising digital connectivity. Orient participates in several of the faster-growing sub-segments rather than only conventional power cables.
The key points are:
Indian wires & cables market: ~INR 1,122.1 Bn in FY26, projected ~INR 2,103.8 Bn by FY31
Projected FY26-FY31 industry CAGR: ~13.4%
Orient FY24-FY26 revenue CAGR: 33.5%, materially above broader market growth
The Company is expanding capacity and product breadth to address networking, fibre, renewable-energy and EV-linked demand
Broadband, 5G, Data Centres and Networking-Cable Demand
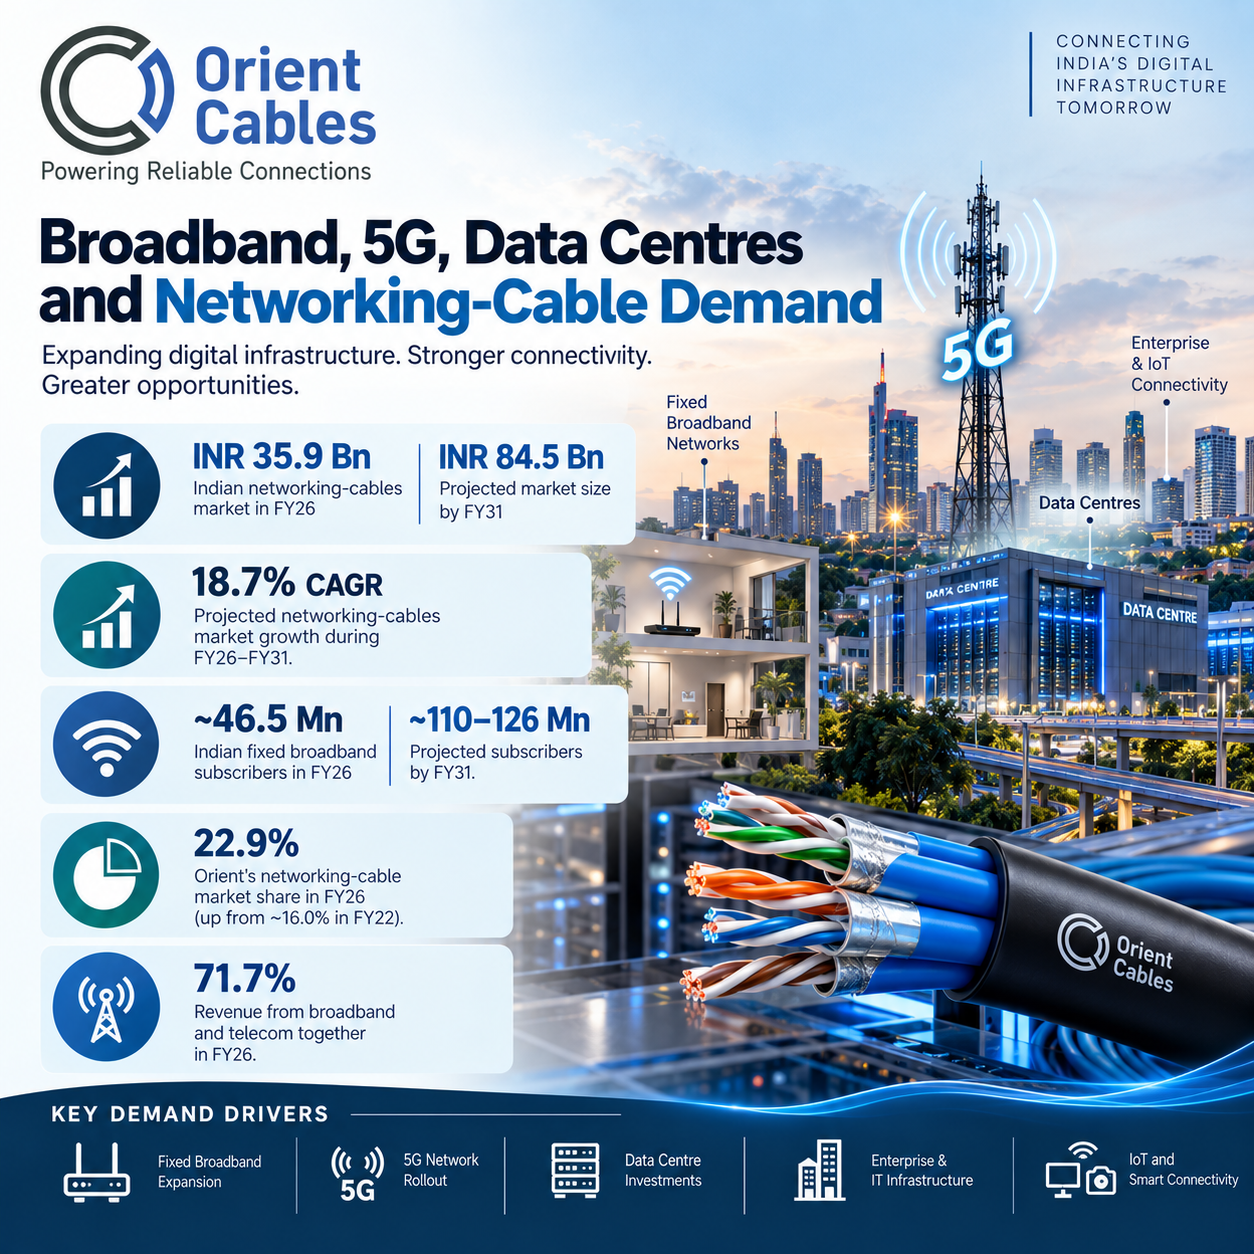
Digital infrastructure is a direct demand driver for Orient's core networking-cable franchise. The Indian networking-cables market was approximately INR 35.9 Bn in FY26 and is projected to reach INR 84.5 Bn by FY31, a CAGR of 18.7%. Fixed broadband penetration remains low relative to developed markets, while data-centre expansion, 5G, IoT and enterprise connectivity increase the need for reliable wired backbones.
The key points are:
Networking-cables market projected to grow at ~18.7% CAGR from FY26 to FY31
Indian fixed broadband subscribers increased to ~46.5 Mn in FY26 and are projected at ~110-126 Mn by FY31
Orient held ~22.9% networking-cable market share in FY26, up from ~16.0% in FY22
Broadband and telecom together contributed 71.7% of FY26 revenue
Optical Fibre, Renewable Energy and E-Beam Specialty Cables
The next leg of industry growth extends beyond LAN cables into fibre and specialized applications. 1Lattice projects India's fibre-optic cable market to grow at approximately 17.3% CAGR through FY31. Renewable-energy buildout also creates demand for higher-performance solar cabling; the Indian solar E-beam market is projected to expand sharply as solar installations scale. Orient has commenced commercial production at its E-beam facility and is pursuing automotive and railway approvals.
The key points are:
Indian fibre-optic cable market projected at ~17.3% CAGR during FY26-FY31
Indian solar E-beam market was ~INR 53.6 Bn in FY26 and is projected at ~INR 266.7 Bn by FY31
Orient's E-beam facility has commenced commercial production with initial focus on solar cables
Specialty power/OFC contribution rose to 21.4% of FY26 revenue from 16.5% in FY24
Risks in the Industry
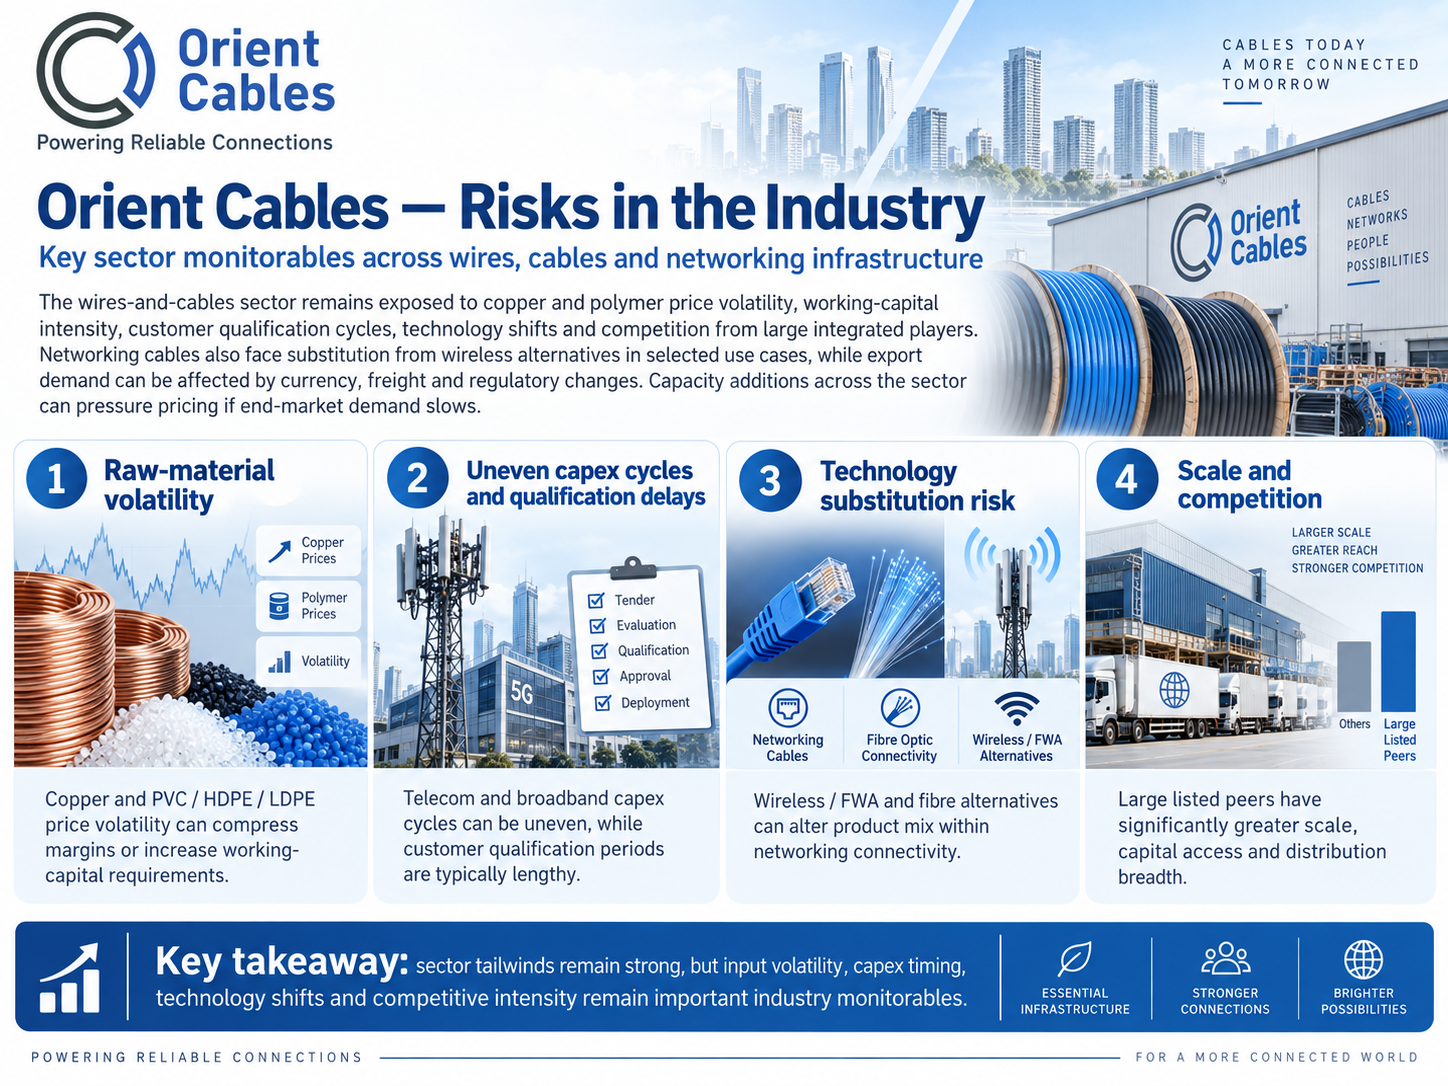
The wires-and-cables sector remains exposed to copper and polymer price volatility, working-capital intensity, customer qualification cycles, technology shifts and competition from large integrated players. Networking cables also face substitution from wireless alternatives in selected use cases, while export demand can be affected by currency, freight and regulatory changes. Capacity additions across the sector can pressure pricing if end-market demand slows.
The key risks are:
Copper/PVC/HDPE/LDPE price volatility can compress margins or increase working-capital requirements
Telecom and broadband capex cycles can be uneven and customer qualification periods are lengthy
Wireless/FWA and fibre alternatives can alter product mix within networking connectivity
Large listed peers have significantly greater scale, capital access and distribution breadth
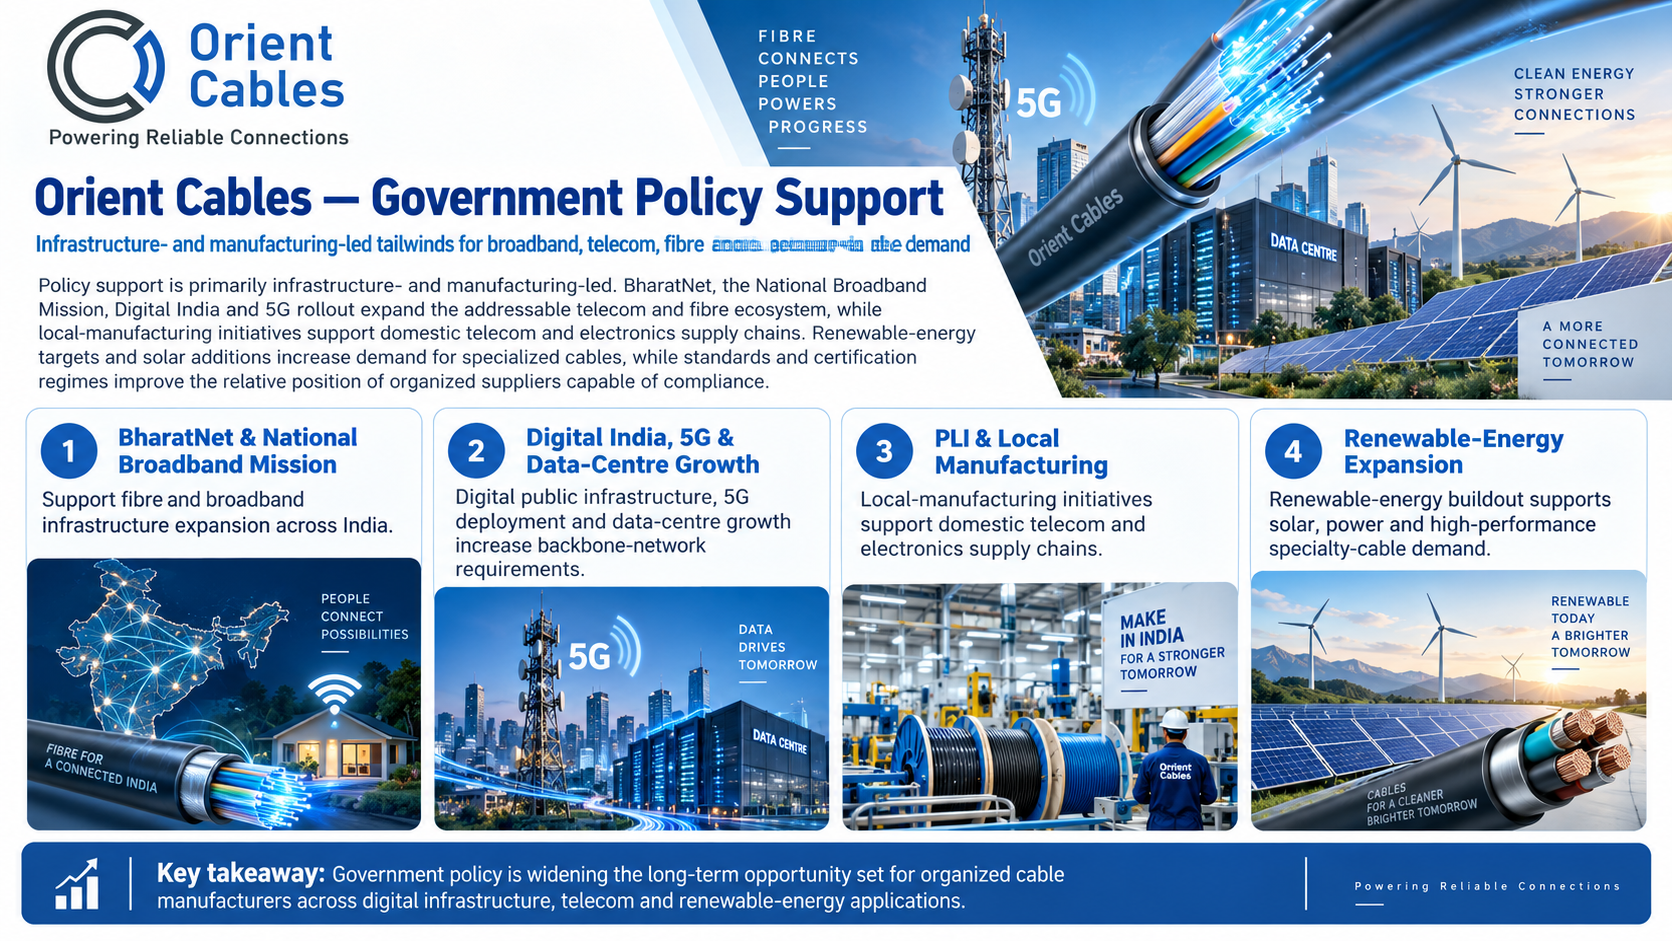
Government Policy Support
Policy support is primarily infrastructure- and manufacturing-led. BharatNet, the National Broadband Mission, Digital India and 5G rollout expand the addressable telecom and fibre ecosystem, while production-linked incentives and domestic-manufacturing policies support local electronics/telecom supply chains. Renewable-energy targets and solar additions increase demand for specialized cables, while standards and certification regimes improve the relative position of organized suppliers capable of compliance.
The key policies are:
BharatNet and National Broadband Mission support fibre and broadband infrastructure expansion
Digital India, 5G deployment and data-centre growth increase backbone-network requirements
PLI/local-manufacturing initiatives support domestic telecom and electronics supply chains
Renewable-energy expansion supports solar, power and high-performance specialty-cable demand
Fundraise/Future Plans
Shareholding
Pre-issue shareholding
Promoter Holding 0.0%
Post-Issue Shareholding
Promoter Holding 0.0%
Category
Pre-Issue%Post-Issue%
Promoters
Vipul Nagpal
24.2%19.6%
Garima Nagpal
5.7%4.6%
Vardaan Nagpal
0.1%0.1%
Promoter Group
70.0%57.9%
Total Promoter Holding
100.0%82.2%
Additional Shareholders
Other Shareholders
0.0%17.3%
Total Additional Holding
0.0%17.3%
Total Shareholding
100.0%99.5%
- Overview
- Business
- Financial Highlights
- Industry Overview
- Fundraise/Future Plans
- Documentation
Get the Preqt App and keep in touch around the clock!
 Monitor your investments in real-time.
- Receive tailored deal suggestions.
- Get real-time updates and alerts.
