


Parag Parikh Financial Advisory Services Ltd. (PPFAS)
Patience Builds WealthValue Beyond Markets
IPO Review and Rating
Strong Buy
Overall Recommendation
Fees and commission income increased at a 58.3% FY23-FY26 3-year CAGR, while FY26 revenue reached INR 601.8 Cr, mechanical EBITDA approximately INR 475.9 Cr with a 79.1% margin, PAT INR 347.6 Cr with a 57.7% margin, D/E approximately 0.1x, ROE 41.9% and OCF INR 350.0 Cr. Group AUM reached INR 1.5 lakh Cr, +39.1% YoY, against industry AUM growth of 12.2%. At the prevailing valuation, PPFAS trades at 47.7x P/E, 32.9x EV/EBITDA, 16.5x P/B and 27.6x P/S, representing a 36.4% P/E premium to the stated industry benchmark
PARAMETER
WEIGHT
SCORE
KEY FACTORS
Financial Performance
25.0%
5.0/5
Fees and commission income recorded a 58.3% 3-year CAGR
Show more
Detailed Analysis
Fees and commission income increased from INR 144.8 Cr in FY23 to INR 212.5 Cr in FY24, INR 375.9 Cr in FY25 and INR 573.7 Cr in FY26, representing a 58.3% FY23-FY26 3-year CAGR
FY26 total revenue from operations increased 40.3% YoY to INR 601.8 Cr
FY26 mechanical EBITDA was approximately INR 475.9 Cr, resulting in an EBITDA margin of 79.1%
PAT increased from INR 246.6 Cr in FY25 to INR 347.6 Cr in FY26, +40.9% YoY; FY26 PAT margin stood at 57.7%
Conventional borrowings were NIL, while FY26 lease liabilities were approximately INR 20.3 Cr against equity of INR 1,009.7 Cr, resulting in an adjusted D/E of approximately 0.1x
FY26 reported ROE stood at 41.91%, compared with 46.69% in FY25, 43% in FY24 and 46.9% in FY23
Consolidated CFO remained positive at INR 198.3 Cr in FY25 and INR 350.0 Cr in FY26, representing 76.5% YoY growth
Industry
25.0%
2.3/5
Indian mutual-fund AUM grew 12.2% in FY26 to INR 73.73 lakh Cr
Show more
Detailed Analysis
Mutual-fund folios increased from 23.50 Cr in FY25 to 27.4 Cr in FY26, while unique investors increased 13.0% to 6.1 Cr
The top five bank-led AMCs held approximately 52.1% of FY26 industry QAAUM, while the largest AMC held 15.3% market share
Asset-management operations are subject to SEBI regulation, AUM-linked management-fee structures and regulatory limits on products and overseas investments
Management
25.0%
3.2/5
Leadership experience stands at approximately 25 years
Show more
Detailed Analysis
Rajeev Thakkar joined PPFAS in 2001 and currently serves as CIO/Director, representing approximately 25 years of investment-management experience with the Group by FY26
FY26 Board comprised 7 Directors with 1 Independent Director, resulting in 14.3% independent representation
0 material regulatory/court/tribunal orders affecting going concern were reported
Recurring FY26 external/KMP RPTs were approximately INR 30.9 Cr, equivalent to approximately 5.1% of FY26 revenue, excluding dividend payments and capital transactions
Valuation Metrics
25.0%
3.0/5
The company is valued at 47.7x P/E
Show more
Detailed Analysis
The Company is valued at 47.7x P/E against the stated industry P/E of 35.0x, representing a 36.4% premium
Estimated adjusted EV is approximately INR 15,650.5 Cr against mechanical FY26 EBITDA of INR 475.9 Cr, resulting in 32.9x EV/EBITDA. The selected listed-AMC median is approximately 22.2x, placing PPFAS at a 48.4% premium
The Company is valued at 16.5x P/B, based on market capitalisation of INR 16,609.8 Cr against FY26 equity of approximately INR 1,009.7 Cr
TOTAL
100%
3.4/5
Weighted Composite Score
Per Share Price
₹18750.0
As of 14 Oct 2026
Lot Size
10.0 Shares
Minimum Investment
₹1,87,500.0 / 10 shares
Market Cap. (₹ Cr)
Revenue FY’26
PAT FY’26
P/E Multiple
Face Value
₹ 10.0Lot Size
10.0 sharesPAT FY’26
₹ 347.6 CrPAT Margin (%)
57.7 %P/E Multiple
47.7xCAGR Growth 3Y
58.3 %ROE (FY’26)
41.9 %ROCE (FY’26)
55.4 %Price to Book Value ratio
16.5xDebt/Equity (FY’26)
0.0xMerchant banker appointed
❌ NoCompany Website
www.ppfas.comDisclaimer: Unlisted shares are unregulated & illiquid. This is NOT investment advice. Please do your own due diligence before investing.
Minimum Investment
₹1,87,500.0 / 10 sharesShares Lot 10 X 1
Investment amount
₹1,87,500.0
Overview
Business
Business Model
Geographical Presence
Sales Channel
Financial Highlights
Income Statement
Revenue growth with EBITDA and PAT margins
| Financial Metric | FY 2024 | FY 2025 | FY 2026 |
|---|---|---|---|
| Revenue (₹ Cr) | 286.3 | 428.8 | 601.8 |
| Growth (%) | 46.0% | 49.8% | 40.3% |
| EBITDA (₹ Cr) | 220.0 | 341.9 | 475.9 |
| EBITDA Margin (%) | 76.9% | 79.7% | 79.1% |
| PAT (₹ Cr) | 171.0 | 246.6 | 347.6 |
| PAT Margin (%) | 59.7% | 57.5% | 57.7% |
OBSERVATIONS & INSIGHTS
Revenue from operations increased from INR 286.3 Cr in FY24 to INR 601.8 Cr in FY26, while fees and commission income increased from INR 212.5 Cr to INR 573.7 Cr
The shift reflects rapid AUM growth and stronger fee generation from the core AMC franchise
PAT increased from INR 171.0 Cr in FY24 to INR 347.6 Cr in FY26. FY26 PAT growth was 40.9%, broadly tracking the 40.3% increase in revenue from operations
The 58.3% three-year revenue CAGR is mathematically strong but should be read with the accounting-basis caveat: the Group adopted Ind AS effective FY25, so long-period comparability is not perfectly like-for-like
Balance Sheet
| Financial Metric | FY 2024 | FY 2025 | FY 2026 |
|---|---|---|---|
| EQUITY & LIABILITIES | ₹ 434.8 Cr | ₹ 702.0 Cr | ₹ 1,072.2 Cr |
| Net Worth | ₹ 407.5 Cr | ₹ 648.8 Cr | ₹ 1,009.7 Cr |
| Share Capital | ₹ 7.7 Cr | ₹ 7.7 Cr | ₹ 7.9 Cr |
| Reserves & Surplus | ₹ 399.8 Cr | ₹ 641.1 Cr | ₹ 1,001.8 Cr |
| Total Liabilities | ₹ 27.3 Cr | ₹ 53.2 Cr | ₹ 62.5 Cr |
| Current Liabilities | ₹ 2.9 Cr | ₹ 12.4 Cr | ₹ 22.8 Cr |
| Lease liabilities | ₹ 1.8 Cr | ₹ 10.5 Cr | ₹ 20.3 Cr |
| Trade Payables | ₹ 1.1 Cr | ₹ 1.6 Cr | ₹ 2.3 Cr |
| Other Current Liabilities | ₹ 0.0 Cr | ₹ 0.3 Cr | ₹ 0.2 Cr |
| Non-Current Liabilities | ₹ 24.4 Cr | ₹ 40.8 Cr | ₹ 39.7 Cr |
| Borrowings | ₹ 0.0 Cr | ₹ 0.0 Cr | ₹ 0.0 Cr |
| Other Non-Current Liabilities | ₹ 24.4 Cr | ₹ 40.8 Cr | ₹ 39.7 Cr |
| ASSETS | ₹ 434.6 Cr | ₹ 702.2 Cr | ₹ 1,072.2 Cr |
| Current Assets | ₹ 406.0 Cr | ₹ 653.9 Cr | ₹ 1,002.7 Cr |
| Trade Receivables | ₹ 24.2 Cr | ₹ 43.5 Cr | ₹ 18.4 Cr |
| Investments | ₹ 376.2 Cr | ₹ 604.9 Cr | ₹ 963.0 Cr |
| Cash & Cash Equivalents | ₹ 3.2 Cr | ₹ 2.4 Cr | ₹ 16.6 Cr |
| Other Current Assets | ₹ 2.4 Cr | ₹ 3.1 Cr | ₹ 4.7 Cr |
| Non-Current Assets | ₹ 28.6 Cr | ₹ 48.3 Cr | ₹ 69.5 Cr |
| Fixed Assets | ₹ 25.4 Cr | ₹ 45.8 Cr | ₹ 63.1 Cr |
| Other Non-Current Assets | ₹ 3.2 Cr | ₹ 2.5 Cr | ₹ 6.4 Cr |
OBSERVATIONS & INSIGHTS
Total assets increased from INR 434.7 Cr in FY24 to INR 1,072.1 Cr in FY26, driven primarily by a substantial increase in the Group's investment portfolio.
Investments increased to INR 963.0 Cr in FY26 from INR 376.2 Cr in FY24 and represent approximately 89.8% of total assets
Balance sheet value is therefore meaningfully exposed to the composition and mark-to-market performance of financial investments
Net worth increased from INR 407.5 Cr in FY24 to INR 1,009.7 Cr in FY26, supported by retained profitability and share issuance. This provides a strong capital buffer relative to operating liabilities
Trade receivables fell from INR 43.5 Cr in FY25 to INR 18.4 Cr in FY26 despite strong fee-income growth, materially improving working-capital efficiency
Lease liabilities increased to INR 20.3 Cr in FY26 from INR 1.8 Cr in FY24 as the Group expanded offices / operational infrastructure
These are accounting lease obligations rather than conventional financial debt
Cash Flow
| Financial Metric | FY 2024 | FY 2025 | FY 2026 |
|---|---|---|---|
CFO (₹ Cr) Cash generated from core business operations. | +102.6 Cr | +198.3 Cr | +350 Cr |
CFI (₹ Cr) Cash used for investments and long-term assets. | -96.7 Cr | -190 Cr | -354.2 Cr |
CFF (₹ Cr) Cash flow related to funding and borrowings. | -5.1 Cr | -9.2 Cr | +6.7 Cr |
Financial Ratios
Measures the company’s leverage relative to shareholder equity.
OBSERVATIONS & INSIGHTS
The Group remains debt-free, which materially reduces balance-sheet and refinancing risk. FY26 finance cost of INR 1.3 Cr is predominantly an Ind AS 116 lease-accounting charge rather than interest on financial borrowings
ROE remained very strong at 41.9% in FY26 despite declining from 46.7% in FY25
Management attributes the moderation to faster growth in average net worth as retained earnings accumulated
ROCE remained high at approximately 55.4% in FY26, although it declined as the equity base expanded faster than EBIT
ROA moderated from approximately 49.5% in FY24 to 39.2% in FY26 because the asset base expanded rapidly, particularly treasury / investment assets
Absolute profitability nevertheless continued to grow strongly
Industry Overview
Industry Drivers
Expansion of Technological Capabilities
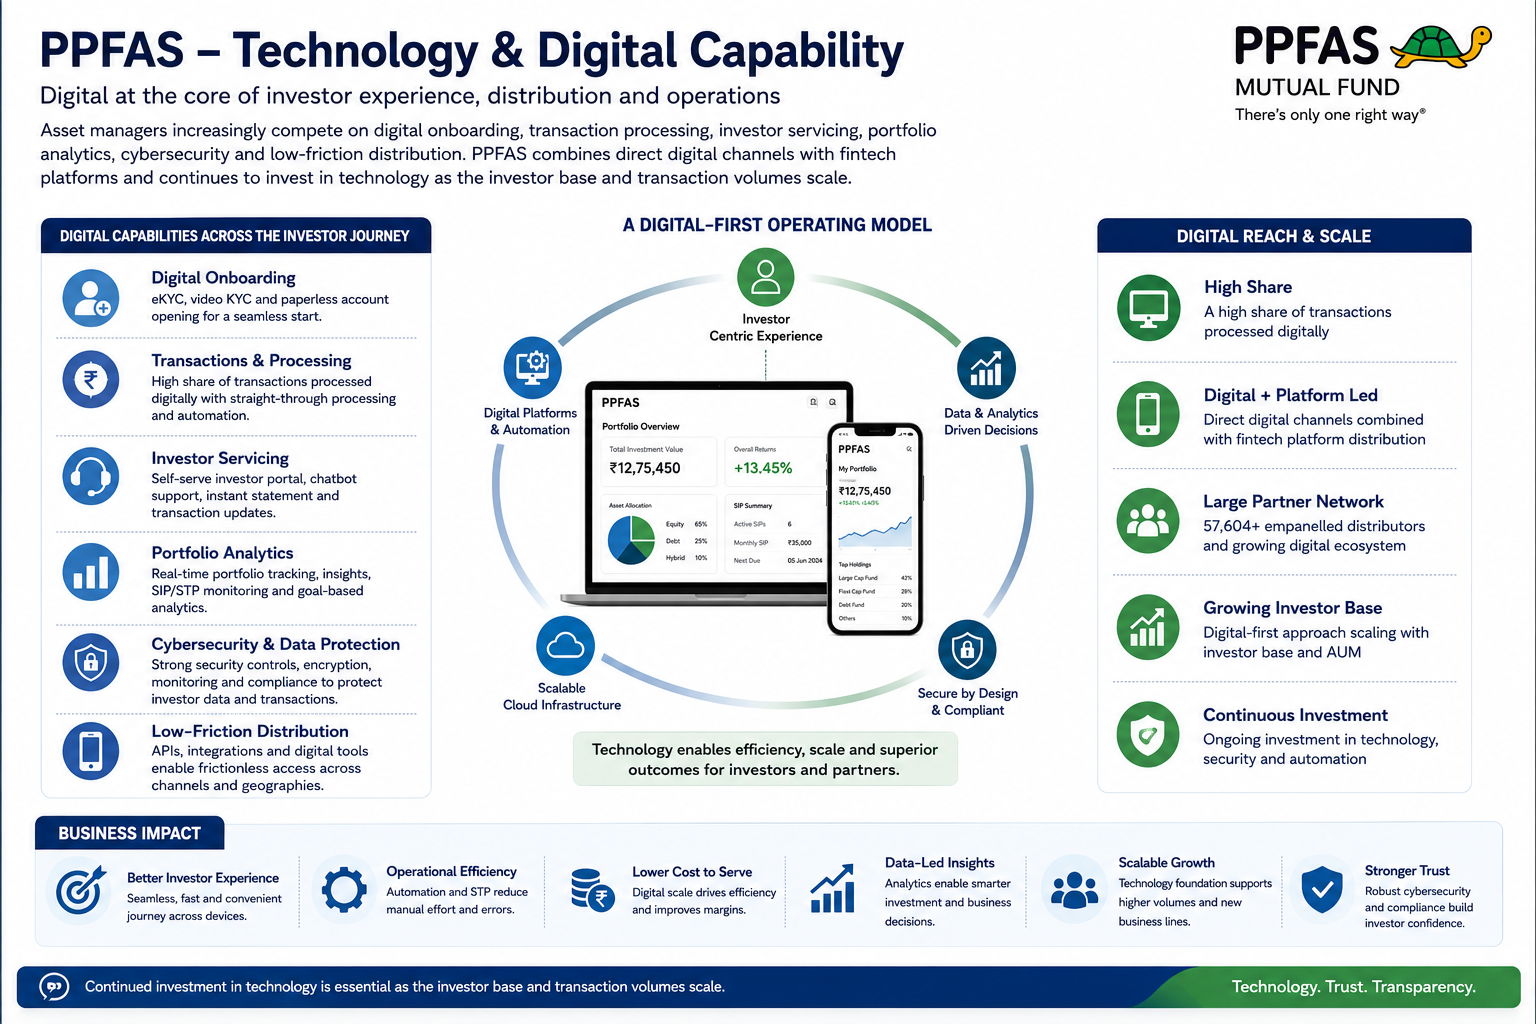
Asset managers increasingly compete on digital onboarding, transaction processing, investor servicing, portfolio analytics, cybersecurity and low-friction distribution
A high share of transactions is processed digitally and combines direct digital channels with fintech-platform distribution
Continued investment in technology is necessary as the investor base and transaction volumes scale
Capacity Expansion
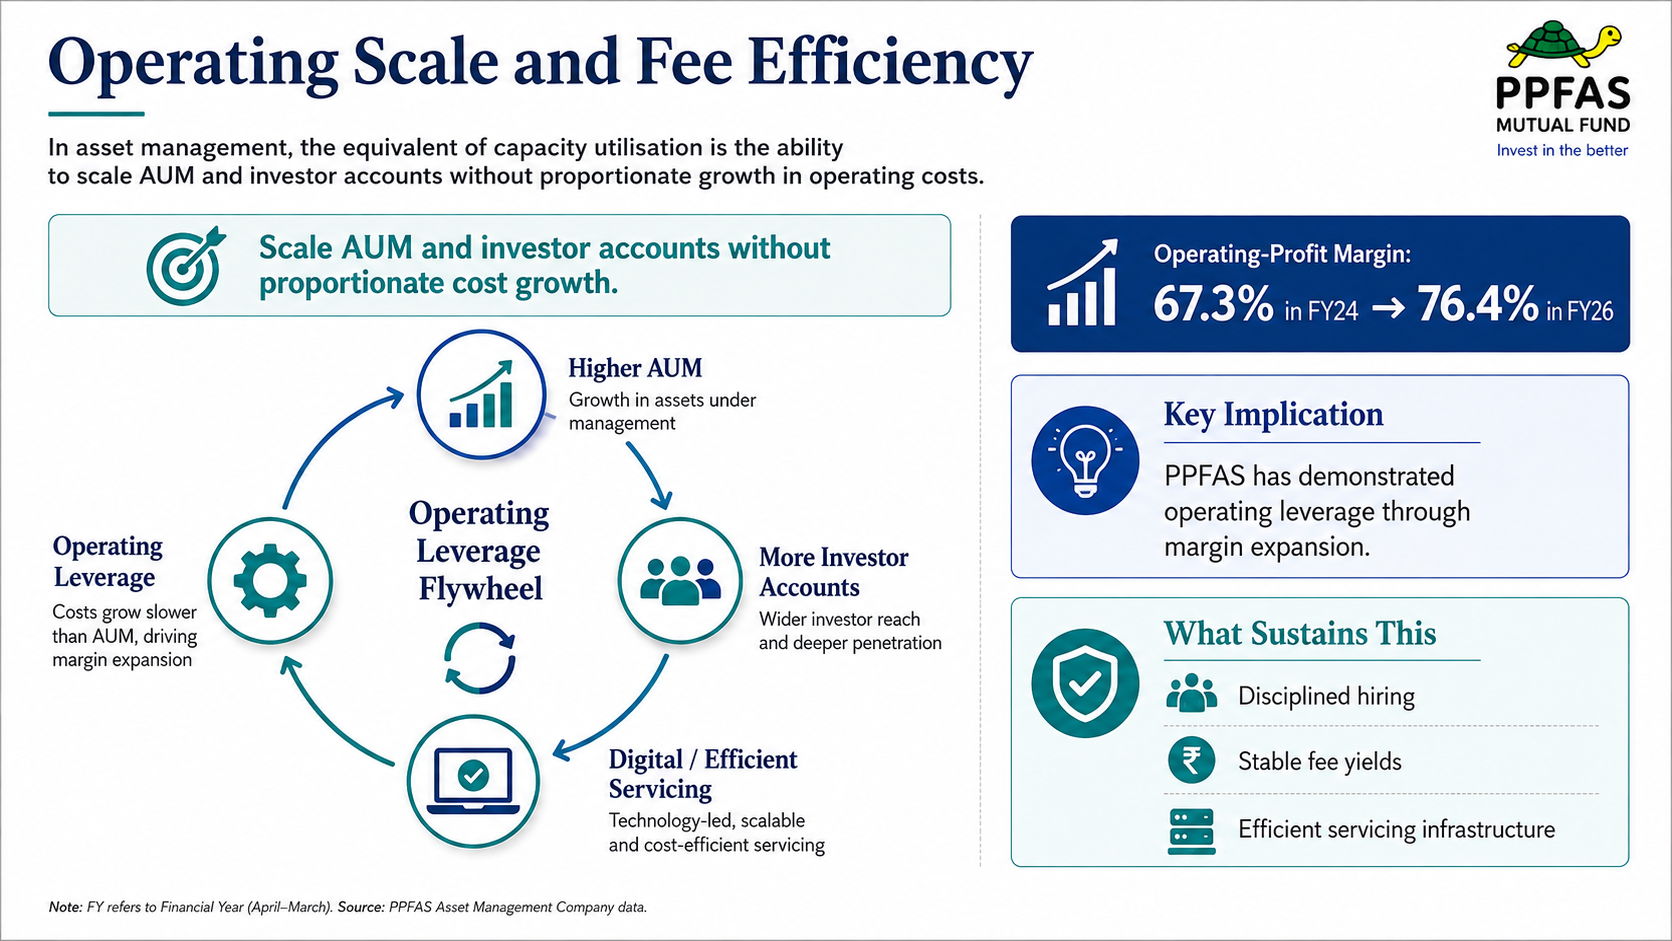
The equivalent of capacity utilisation in asset management is the ability to scale AUM and investor accounts without proportionate growth in operating costs
PPFAS has demonstrated this through expansion of operating-profit margin from 67.3% in FY24 to 76.4% in FY26
Sustaining this requires disciplined hiring, stable fee yields and efficient servicing infrastructure
Investor Relationships and Distribution Depth
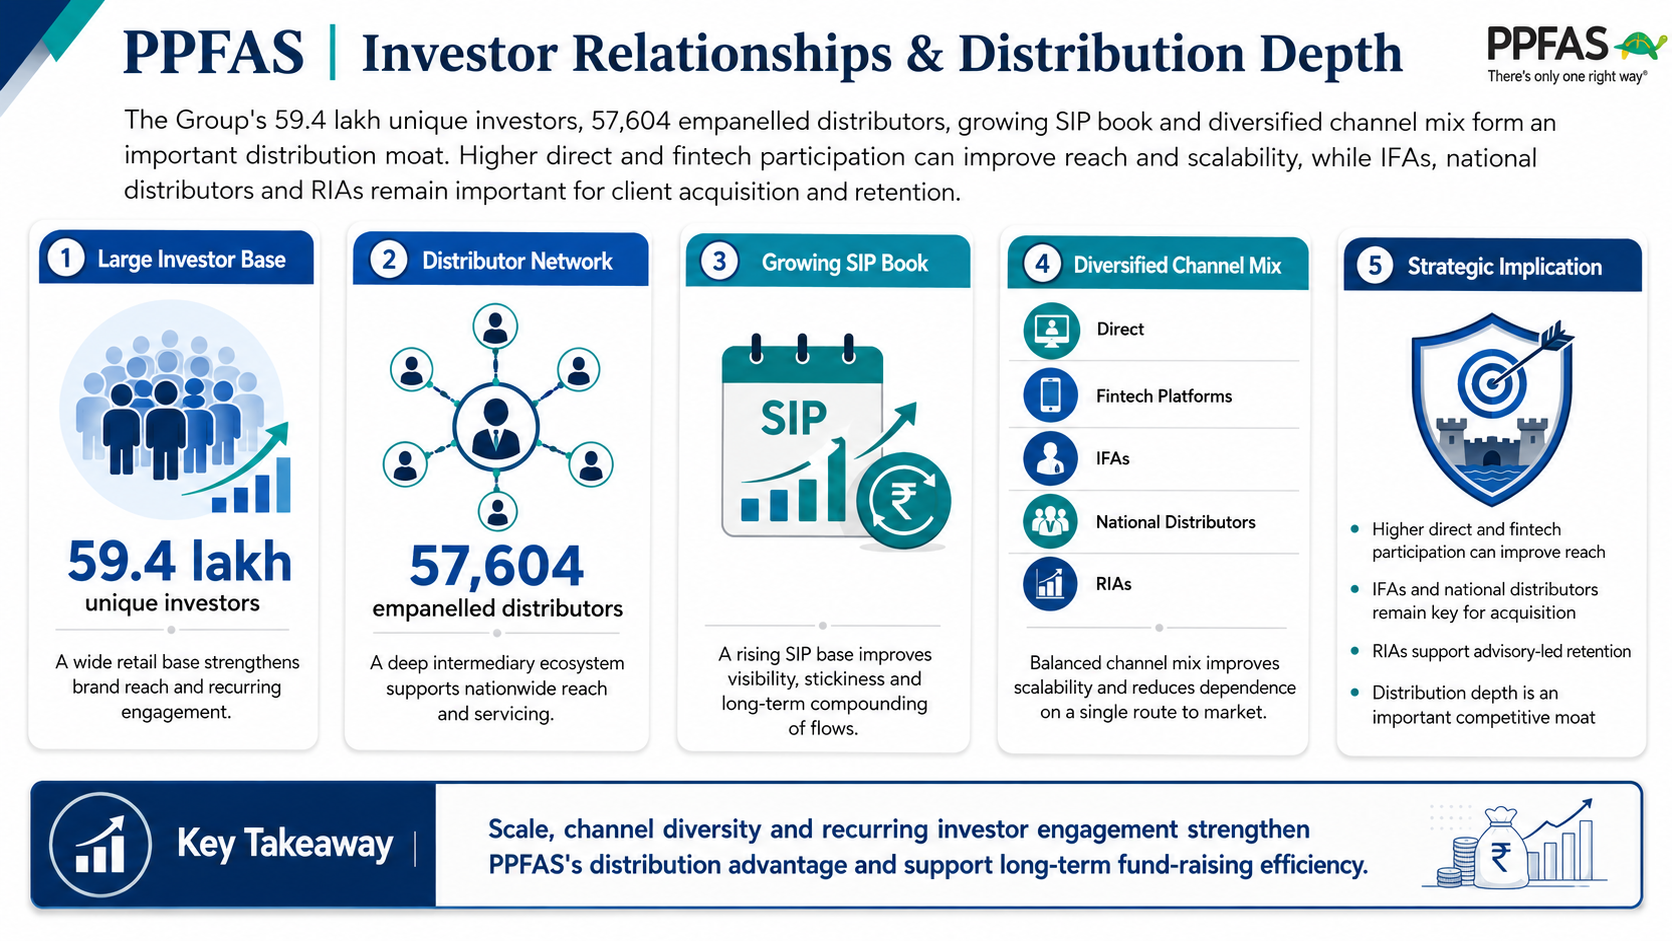
The Group's 59.4 lakh unique investors, 57,604 empanelled distributors, growing SIP book and diversified channel mix form an important distribution moat
Higher direct and fintech participation can improve reach and scalability, while IFAs, national distributors and RIAs remain important for client acquisition and retention
Government Policy Support
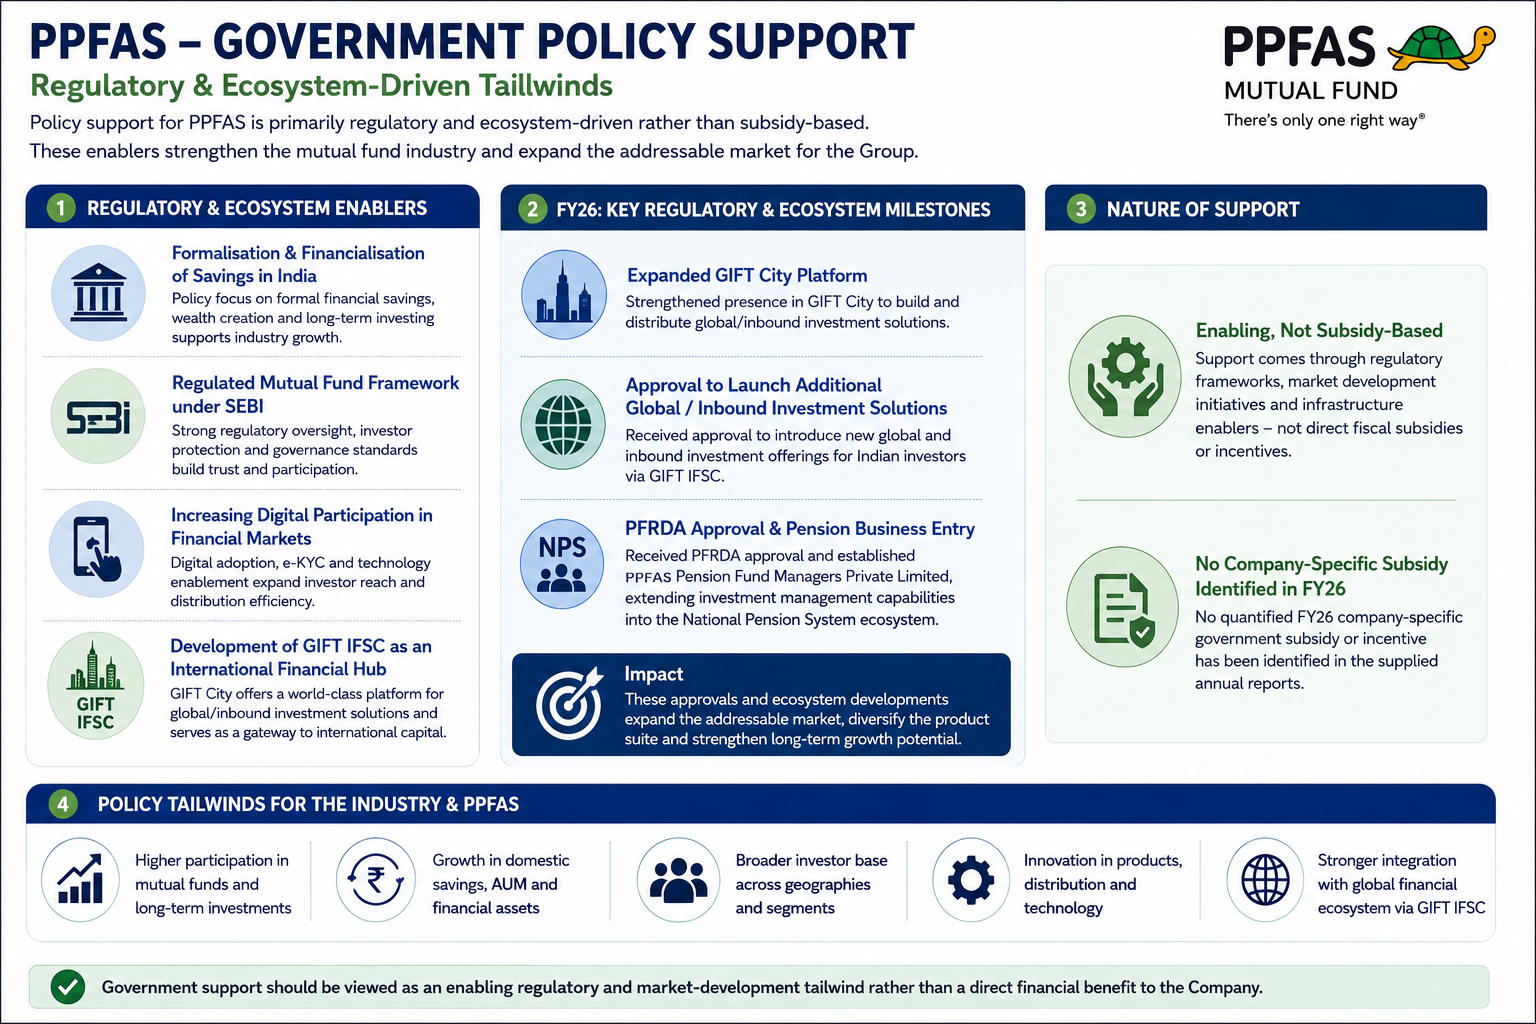
Policy support for PPFAS is primarily regulatory and ecosystem-driven rather than subsidy-based
The Group benefits from India's formalisation and financialisation of savings, the regulated mutual-fund framework under SEBI, increasing digital participation in financial markets and the continued development of GIFT IFSC as an international financial-services hub
During FY26, PPFAS expanded its GIFT City platform and received approval to launch additional global / inbound investment solutions
The Group also received PFRDA approval and established PPFAS Pension Fund Managers Private Limited, extending its investment management capabilities into the National Pension System ecosystem
- Overview
- Business
- Financial Highlights
- Industry Overview
- Documentation
Get the Preqt App and keep in touch around the clock!
 Monitor your investments in real-time.
- Receive tailored deal suggestions.
- Get real-time updates and alerts.
