

Paras Healthcare
Expertise That HealsHealing Through Excellence
IPO Summary (PreQT)
Paras Healthcare Limited operates eight multispecialty hospitals across North and East India, with 2,211 total beds and 1,502 operational beds at March 2026. The group grew FY26 revenue by 24.1% to INR 1,606.0 Cr, supported by higher patient volumes, improving bed occupancy and the maturation of recently commissioned hospitals. Reported EBITDA increased from INR 156.5 Cr in FY25 to INR 335.6 Cr in FY26, while PAT turned positive at INR 43.8 Cr after losses in FY24 and FY25.
However, the business remains capital intensive and leveraged, and government schemes and PSUs represented 41.3% of FY26 revenue and approximately 82.9% of gross receivables. At the cap price of INR 693, the post-IPO market value is approximately INR 7,498.3 Cr and the cap-price P/E based on reported FY26 EPS is 171.2x, materially higher than the RHP peer-average P/E of 67.8x. The improving clinical operating trajectory is credible, but elevated valuation, reimbursement exposure and substantial debt call for a cautious approach, with sustained earnings and cash conversion required to justify pricing.
IPO Review Rating
Below Avg
MainboardProviding Comprehensive Healthcare with Trust, Expertise, and Compassion
Paras Healthcare presents a strong operating turnaround within an attractive structural healthcare sector. Revenue increased from INR 1,129.0 Cr in FY24 to INR 1,606.0 Cr in FY26, EBITDA margin expanded from 13.4% to 20.6%, and operating cash flow improved to INR 163.5 Cr in FY26. The company also returned to profitability in FY26 with INR 43.8 Cr PAT, after reporting losses in the preceding two years. Its network of eight hospitals and 2,211 beds across North India, Bihar and Jharkhand provides a meaningful regional franchise, while planned expansion in Gurugram and Ludhiana provides additional growth potential. The presence of institutional investors such as Creador, 360 ONE and Axis AIF, together with JM Financial, BofA Securities and Nuvama as BRLMs, also strengthens the overall institutional profile.
The principal concerns are high leverage, a relatively short profitability track record, meaningful litigation exposure and demanding valuation. At the upper price band of INR 693/share, the Company is valued at approximately 171.2x FY26 earnings and 15.7x book value, substantially above the peer-group P/E average.
Although EV/EBITDA becomes more reasonable after the proposed debt repayment, only INR 500.0 Cr of the INR 1,450.0 Cr IPO is fresh capital, while INR 950.0 Cr is OFS. Overall, the improving earnings profile, attractive hospital-sector outlook, regional positioning and expected deleveraging support participation, but the premium valuation leaves limited room for execution disappointment.
PARAMETER
WEIGHT
SCORE
KEY FACTORS
Financial Performance
40.0%
3.0/5
Paras has delivered strong revenue growth, significant EBITDA-margin expansion and a meaningful profitability turnaround, supported by positive operating cash flow. However, high leverage and the relatively short history of consolidated profitability continue to constrain the financial score
Show more
Detailed Analysis
Revenue from operations increased from INR 1,129.0 Cr in FY24 to INR 1,294.1 Cr in FY25 and INR 1,606.0 Cr in FY26, representing an FY24-FY26 CAGR of approximately 19.3%. FY26 revenue growth accelerated to 24.1%
EBITDA increased from INR 154.4 Cr in FY24 to INR 335.6 Cr in FY26, while EBITDA margin expanded from 13.4% to 20.6%. Q1 FY27 margin improved further to 23.7%, reflecting strong operating leverage
Paras reported losses of INR 15.3 Cr in FY24 and INR 58.0 Cr in FY25, before turning profitable with INR 43.8 Cr PAT in FY26. FY26 PAT margin remained modest at 2.7%, although Q1 FY27 improved to 10.4%
FY26 borrowings-based Debt/Equity was 2.2x, while the RHP-reported ratio including lease liabilities was 3.5x. IPO-funded debt repayment is expected to reduce the borrowings-based ratio materially to approximately 1.2x
ROE improved from negative levels in FY24 and FY25 to 13.0% in FY26. The turnaround is encouraging, although returns remain below several stronger hospital peers and the profitable track record is still limited
Operating cash flow remained positive throughout the period, increasing from INR 92.5 Cr in FY24 to INR 163.5 Cr in FY26. This provides meaningful support to the earnings turnaround and demonstrates actual operating cash generation
No single external customer contributes 10.0% or more of group revenue. However, government schemes and PSUs contributed 41.3% of FY26 revenue, creating exposure to reimbursement cycles and government-payment delays
Industry
15.0%
3.0/5
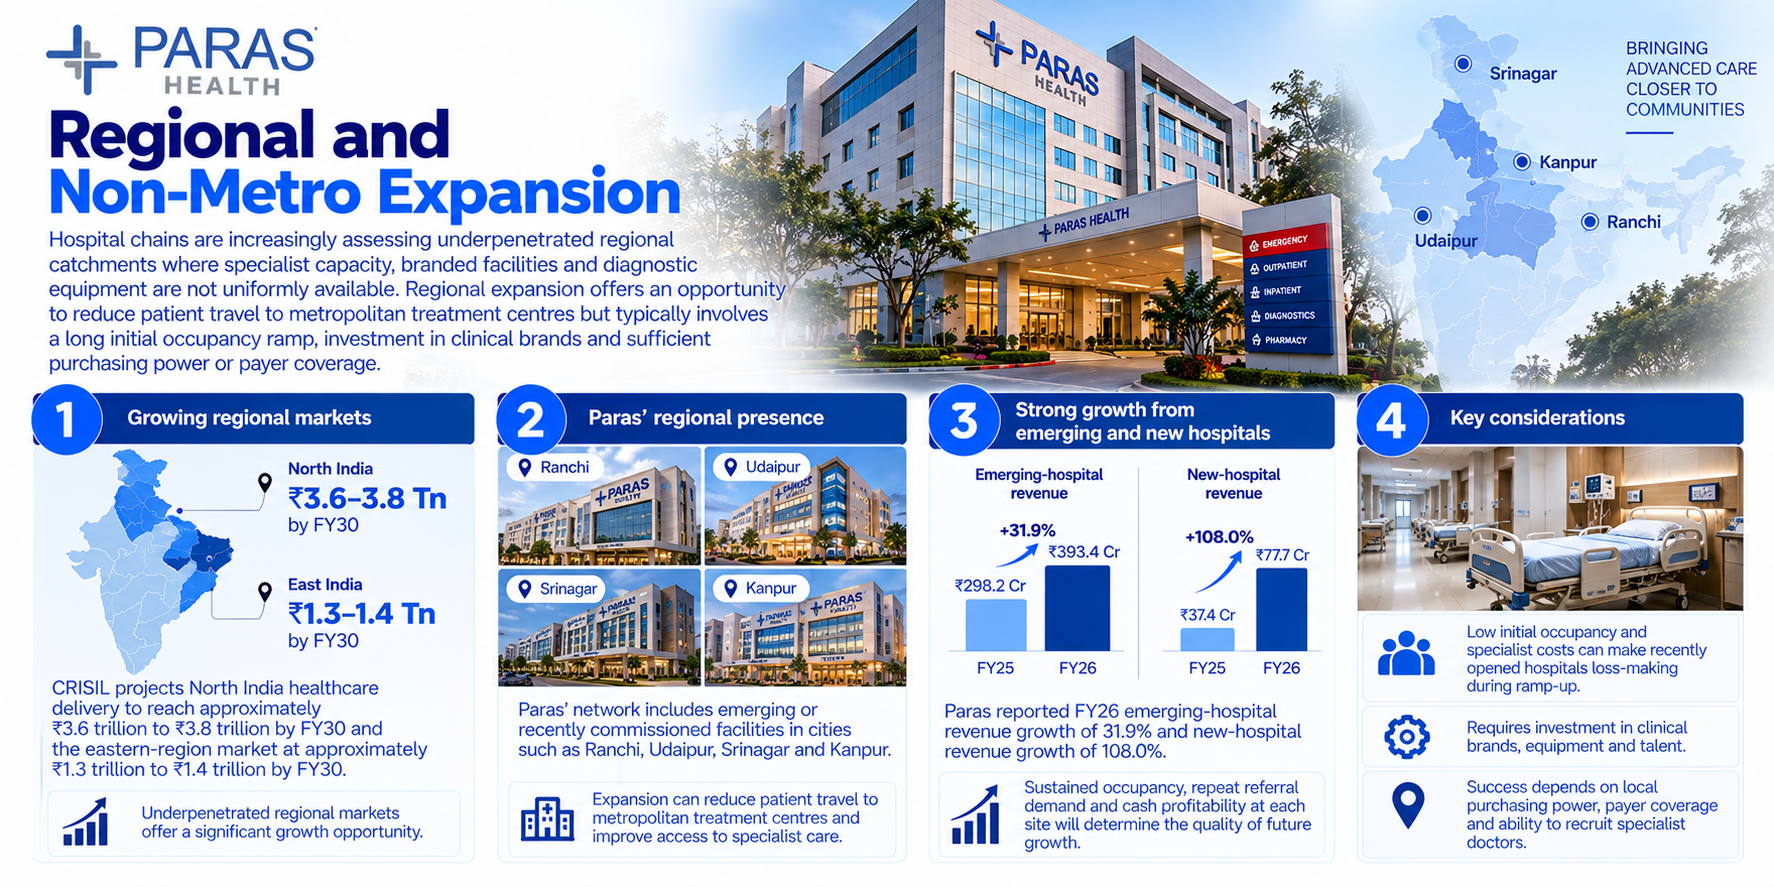
Paras operates in an attractive structural growth sector, particularly across relatively underpenetrated North and East Indian markets. Its regional positioning and expansion pipeline are strong, although its scale remains considerably smaller than India's largest listed hospital chains
Show more
Detailed Analysis
India's healthcare delivery market is expected to grow at 10.0% to 12.0% CAGR between FY25 and FY30, reaching approximately INR 11.2 trillion to INR 12.2 trillion, supported by rising incomes, chronic diseases and higher healthcare penetration
Hospital healthcare is an established industry, but organised hospital chains remain structurally underpenetrated, particularly in Tier II markets. Rising insurance penetration, government healthcare schemes and demand for tertiary and quaternary care provide a long growth runway
Hospitals face substantial clinical, licensing, patient-safety, pricing, government-scheme and medical-negligence risks. Paras has also faced notices and restrictions relating to government healthcare scheme empanelments, warranting a regulatory-risk deduction
Management
15.0%
4.0/5
Paras benefits from an experienced healthcare promoter, credible institutional investors, no promoter pledge and adequate Board independence. The principal governance concern is the significant number of ongoing legal, regulatory and tax proceedings involving the company and promoter
Show more
Detailed Analysis
Promoter and Managing Director Dr. Dharminder Kumar Nagar has more than 22 years of healthcare-sector experience and has led the commissioning and scaling of the Paras hospital network over approximately two decades
Paras has seven Directors, of whom three are Independent Directors, representing approximately 42.9% Board independence. Governance structures are adequate, although independent representation is not particularly high
No promoter shares are pledged. However, the company and promoter are involved in multiple criminal, tax, regulatory and material civil proceedings, creating a meaningful legal and governance overhang
Operating related-party exposure appears relatively limited. FY26 repair, maintenance and power/fuel transactions with Paras RE Facilities Management amounted to only approximately INR 0.9 Cr, or 0.06% of revenue
The promoter owns 72.8% pre-IPO and is expected to retain substantial ownership after the issue. However, the promoter is selling approximately INR 300.0 Cr of shares through the OFS, warranting some deduction
Valuation
20.0%
2.0/5
Valuation is the weakest component of the IPO. Paras is being offered at a very high trailing P/E and P/B despite only recently returning to profitability. EV/EBITDA is considerably more reasonable after adjusting for the proposed debt repayment
Show more
Detailed Analysis
At INR 693, Paras is valued at approximately 171.2x FY26 earnings, materially above the peer average of 67.8x and even above the highest peer P/E of 116.4x. The trailing earnings valuation is therefore expensive
After considering the proposed debt repayment, illustrative post-issue EV/EBITDA is approximately 23.8x, below the listed-peer average of 33.1x. This provides considerably better valuation support than the company's P/E multiple
The INR 693 cap price represents approximately 15.7x the June 2026 NAV of INR 44.1/share, which is expensive even after considering the company's growth and hospital asset base. Adding the ₹500 Cr fresh capital produces an illustrative post-issue book multiple of roughly 7.9x before issue expenses, which is more reasonable
FY26 RoNW of 13.0% is respectable but remains below stronger peers such as Apollo, Narayana and Global Health. Paras also reported negative return ratios during FY24 and FY25
Merchant Banker Track Record
10.0%
5.0/5
Paras has a high-quality banking syndicate comprising JM Financial, BofA Securities and Nuvama. Their institutional distribution, Mainboard IPO experience and execution capabilities provide meaningful comfort regarding issue marketing, price discovery and placement
Show more
Detailed Analysis
The three BRLMs collectively have significant recent Mainboard IPO experience, with a meaningful proportion of historical transactions trading above their respective issue prices after 30 days
Complete and directly comparable historical subscription data across previous transactions handled by all three BRLMs is not disclosed consistently in the RHP
JM Financial, BofA Securities and Nuvama have executed numerous sizeable Mainboard offerings across multiple sectors with substantial domestic and institutional investor participation
TOTAL
100%
3.1/5
Weighted Composite Score
Issue Price
₹660.0 to ₹693.0
As of 24 Oct 2026
GMP
₹95.0
As of 24 Oct 2026
Estimated Gain / Loss
+13.7%
Lot Size
21.0 Shares
Grey Market Premium (GMPs) are shared for knowledge purpose only. PrEqt doesn’t promote or execute the trades.
| Issue size | |
|---|---|
| Overall | ₹1,450.0 Cr |
| Fresh Issue | ₹500.0 Cr |
| Offer for Sale | ₹950.0 Cr |
Minimum Investment
₹14,553.0 / - shares

Merchant Banker
JM Financial Ltd., BofA Securities, Nuvama Wealth Management Limited
JM Financial Ltd.
BofA Securities
Nuvama Wealth Management Limited
IPO Document
Offer Start Date
Offer End Date
Valuation
Revenue (FY'26)
PAT (FY'26)
Issue Size
Face Value
₹ 1.0Offer Price
₹ 693.0Lot Size
21.0 sharesSale Type
Fresh capital cum OFSPAT (FY'26)
₹ 43.8 CrPAT Margin (FY'26)
2.7 %P/E Multiple
171.2xEBITDA (FY'26)
₹ 335.6 CrCAGR Growth 2Y
19.3 %ROE (FY'26)
13.0 %ROCE (FY'26)
10.8 %Price to Book Value
7.9xDebt/Equity
2.2xCompany Website
www.parashospitals.comExplore new deals
Overview
Fund Allocation
Total: ₹0 CrSource:Company DRHP
Timeline
IPO Open Date
To Be Announced
IPO Close Date
To Be Announced
Tentative Allotment
To Be Announced
Initiation of Refunds
To Be Announced
Credit of Shares to Demat
To Be Announced
Tentative Listing Date
To Be Announced
Business
Business Model
Geographical Presence
Sales Channel
Key Risk Factor
Financial Highlights
Income Statement
Revenue growth with EBITDA and PAT margins
| Financial Metric | FY 2024 | FY 2025 | FY 2026 |
|---|---|---|---|
| Revenue (₹ Cr) | 1,129.0 | 1,294.1 | 1,606.0 |
| Growth (%) | - | 14.6% | 24.1% |
| EBITDA (₹ Cr) | 154.4 | 156.5 | 335.6 |
| EBITDA Margin (%) | 13.4% | 11.9% | 20.6% |
| PAT (₹ Cr) | -15.3 | -58.0 | 43.8 |
| PAT Margin (%) | -1.3% | -4.4% | 2.7% |
OBSERVATIONS & INSIGHTS
Revenue grew from INR 1,129.0 Cr in FY24 to INR 1,294.1 Cr in FY25, up 14.6%. The RHP attributes growth to higher volumes in key specialties, additional doctors and a full year of operating contribution from Kanpur and Srinagar. FY26 revenue rose another 24.1% to INR 1,606.0 Cr, supported by 22.2% in-patient growth, 31.4% out-patient growth, and significantly higher patient throughput at emerging and new hospitals
EBITDA rose marginally from INR 154.4 Cr in FY24 to INR 156.5 Cr in FY25 despite double-digit revenue growth. New hospitals required upfront staff, maintenance, marketing and depreciation-related support, limiting operating leverage. FY26 EBITDA then grew to INR 335.6 Cr as occupancy improved, more procedures were performed, and fixed costs were spread over a larger volume of patient activity. EBITDA margin fell from 13.4% in FY24 to 11.9% in FY25 as incremental revenue was offset by ramp-up costs, higher consulting expenses and other operating costs. Margin increased to 20.6% in FY26 following higher occupancy, improved scale absorption and a reduction in outsourced medical expenses after the acquisition of previously outsourced radiology activities
PAT moved from a loss of INR 15.3 Cr in FY24 to a loss of INR 58.0 Cr in FY25 even though EBITDA was stable. Finance costs increased by INR 23.9 Cr, depreciation by INR 34.9 Cr, and the FY24 financial instrument fair value gain of INR 13.4 Cr did not recur. PAT recovered to a positive INR 43.8 Cr in FY26 because operating earnings expanded substantially despite further increases in finance costs and depreciation. PAT margin deteriorated from negative 1.3% in FY24 to negative 4.4% in FY25 because losses widened faster than total income grew. It improved to positive 2.7% in FY26 as the company achieved operating leverage and reduced operating losses at newly established hospitals
Balance Sheet
| Financial Metric | FY 2024 | FY 2025 | FY 2026 |
|---|---|---|---|
| Net Worth | ₹ 338.5 Cr | ₹ 280.5 Cr | ₹ 394.9 Cr |
| Total Assets | ₹ 1,477.7 Cr | ₹ 1,810.5 Cr | ₹ 2,071.1 Cr |
| Total Borrowing | ₹ 923.9 Cr | ₹ 1,232.1 Cr | ₹ 1,393.9 Cr |
| Reserves & Surplus | ₹ 328.8 Cr | ₹ 270.7 Cr | ₹ 384.8 Cr |
OBSERVATIONS & INSIGHTS
Net Worth decreased from INR 338.5 Cr in FY24 to INR 280.5 Cr in FY25, reflecting the loss recognised during FY25. It increased to INR 394.9 Cr in FY26, supported by the INR 80.0 Cr preferential equity infusion and positive annual PAT, partially offset by equity and reserve movements
Reserves and Surplus fell from INR 328.8 Cr in FY24 to INR 270.7 Cr in FY25 as losses reduced accumulated reserves. Other equity increased to INR 384.8 Cr in FY26 due to fresh securities premium and retained earnings from FY26 profits
Non-lease borrowings rose from INR 547.5 Cr in FY24 to INR 727.9 Cr in FY25 and INR 854.1 Cr in FY26, reflecting borrowings for hospital development, equipment and working-capital needs. This raised the absolute burden even though equity funding improved the adjusted debt-to-equity ratio in FY26. Lease liabilities increased from INR 376.4 Cr in FY24 to INR 504.2 Cr in FY25 and INR 539.8 Cr in FY26, reflecting additional contractual facility commitments. They are distinct from bank and institutional borrowings but remain debt-like financial obligations
Assets rose from INR 1,477.7 Cr in FY24 to INR 1,810.5 Cr in FY25, driven by equipment investment, more right-of-use leased assets and growing trade receivables. The balance further rose to INR 2,071.1 Cr in FY26 due to higher receivables, bank deposits and medical capital expenditure
Cash Flow
| Financial Metric | FY 2024 | FY 2025 | FY 2026 |
|---|---|---|---|
CFO (₹ Cr) Cash generated from core business operations. | +92.5 Cr | +86.2 Cr | +163.5 Cr |
CFI (₹ Cr) Cash used for investments and long-term assets. | -194.1 Cr | -147.3 Cr | -239.4 Cr |
CFF (₹ Cr) Cash flow related to funding and borrowings. | +94.0 Cr | +82.8 Cr | +85.9 Cr |
Working Capital
| Efficiency Metric | FY 2023 | FY 2024 | FY 2025 |
|---|---|---|---|
Debtor Days Average number of days taken to collect customer payments. | - | - | - |
Creditor Days Average time taken to pay suppliers and vendors. | - | - | - |
Inventory Days Average number of days inventory remains unsold. | - | - | - |
CCC (Cash Conversion Cycle) (Debtor Days + Inventory Days - Creditor Days) | - | - | - |
Financial Ratios
Measures the company’s leverage relative to shareholder equity.
OBSERVATIONS & INSIGHTS
ROE deteriorated from negative 8.3% in FY24 to negative 18.7% in FY25 because PAT loss widened and average equity remained under pressure. It improved to positive 13.0% in FY26 as PAT turned positive at INR 43.8 Cr, assisted by operational improvement and the higher equity base following private placement
ROCE declined from 5.9% in FY24 to 2.7% in FY25 as EBIT weakened while new hospital infrastructure increased capital employed. It recovered to 10.8% in FY26 as EBIT expanded with higher occupancy and operating leverage
D/E worsened from 2.7x in FY24 to 4.4x in FY25 because borrowings and lease commitments increased while equity fell with losses. It improved to 3.5x in FY26 because the company raised private capital and generated profit, although absolute borrowings and lease liabilities remained high
The current ratio decreased from 0.9x in FY24 to 0.8x in FY25 because current liabilities rose faster than current assets. It increased to 1.1x in FY26 as bank balances and receivables expanded, but the liquid quality of those assets is limited by the concentration of slow-paying government reimbursements
Interest Coverage fell from 1.1x in FY24 to 0.4x in FY25 because higher interest and depreciation overwhelmed operating profitability. It improved to 1.7x in FY26 as EBIT expanded significantly, but remained sensitive to borrowing costs and a decline in bed utilisation
The return on average assets was negative 3.5% in FY25 and positive 2.3% in FY26. The improvement reflects recovery in profitability as hospitals generated higher volumes from an expanding asset base, though capital intensity continues to limit asset returns
Industry Overview
Industry Drivers
Supply constraints and demand for specialist beds
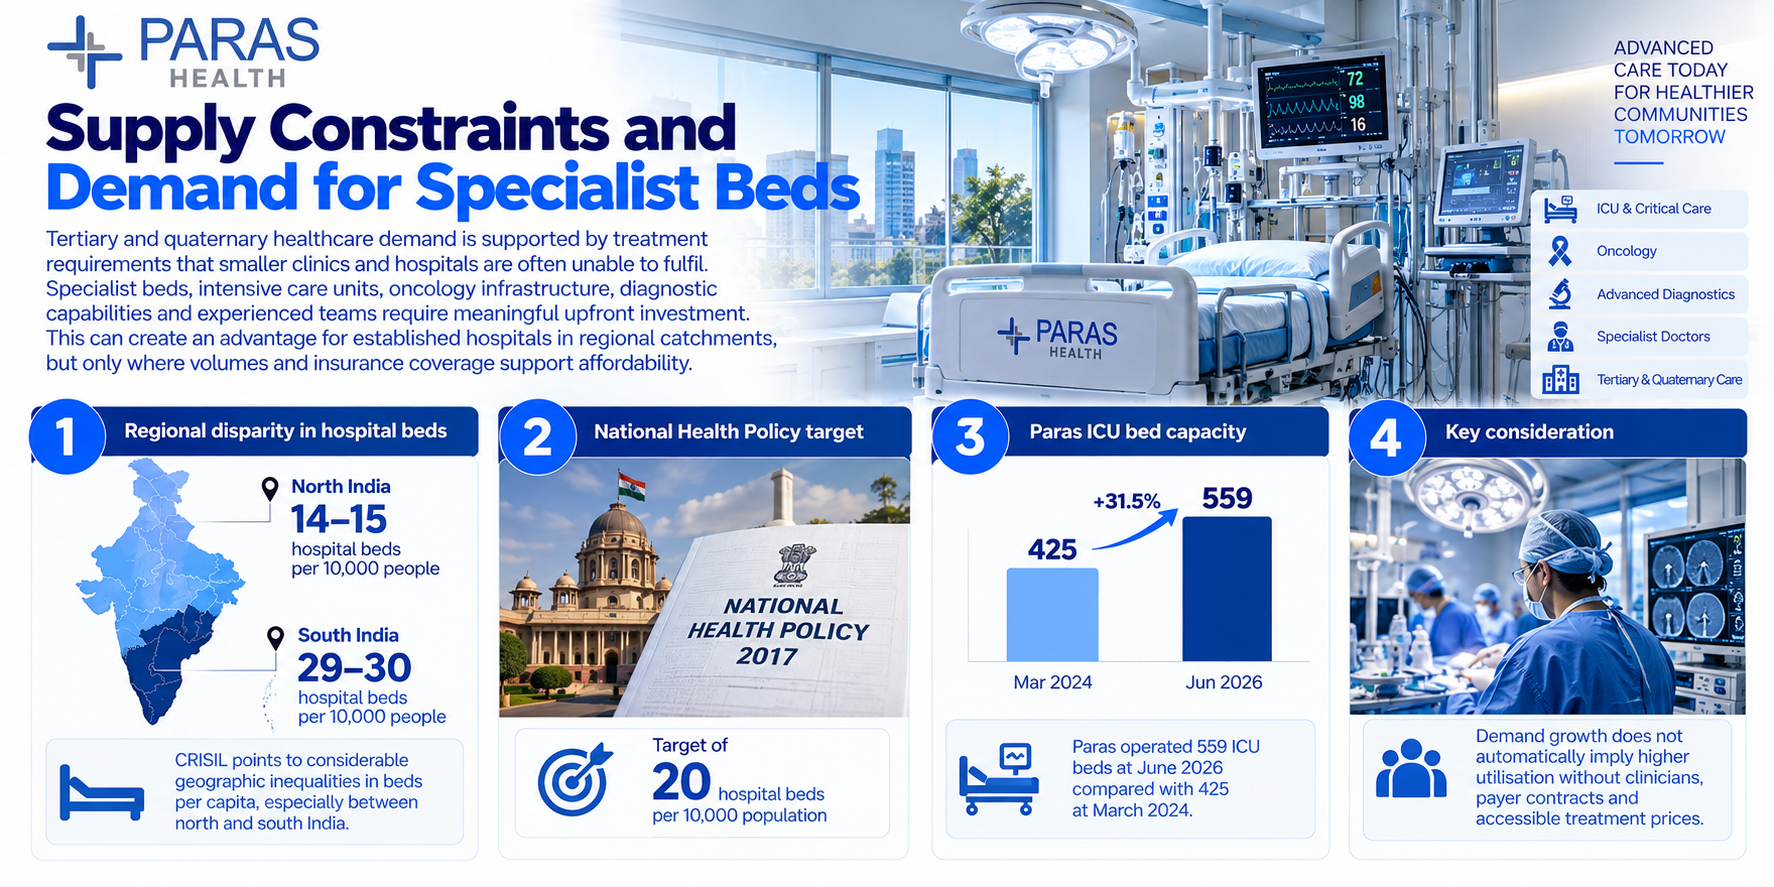
India's hospital infrastructure remains unevenly distributed, creating a substantial gap between demand for advanced healthcare and the availability of operational hospital beds. According to CRISIL Intelligence, selected North and East Indian states had approximately 750,000 to 760,000 hospital beds for a combined population of 592.0 million in FY22. Applying the National Health Policy benchmark of 20 beds per 10,000 people implies a requirement of approximately 1.2 million beds. This infrastructure shortage creates potential opportunities for organised multispecialty hospitals, particularly those offering advanced diagnostics, intensive care, oncology and other specialised treatments.
The key drivers are:
Regional Disparities in Bed Availability: North India had approximately 14 to 15 beds per 10,000 people, compared with 29 to 30 in South India. This disparity highlights unequal healthcare access and significant unmet infrastructure requirements in northern markets
Gap Between Existing and Required Capacity: Selected North and East Indian states faced an estimated shortage of approximately 425,000 operational hospital beds against the National Health Policy benchmark in FY22. This indicates substantial infrastructure requirements, particularly outside established metropolitan healthcare centres
Limited Availability of Specialised Treatment Facilities: Advanced specialties such as oncology, cardiology, neurology and critical care require expensive equipment, trained specialists and multidisciplinary support. These requirements restrict the ability of smaller hospitals to offer complex treatment services
Projected Growth in Northern Healthcare Markets: CRISIL projects North India's healthcare delivery market to reach approximately ₹3.6 trillion to ₹3.8 trillion by FY30. However, converting this market opportunity into hospital revenue will depend on affordability, specialist availability and sustained patient occupancy
Rising Health Insurance Penetration and Government Healthcare Coverage
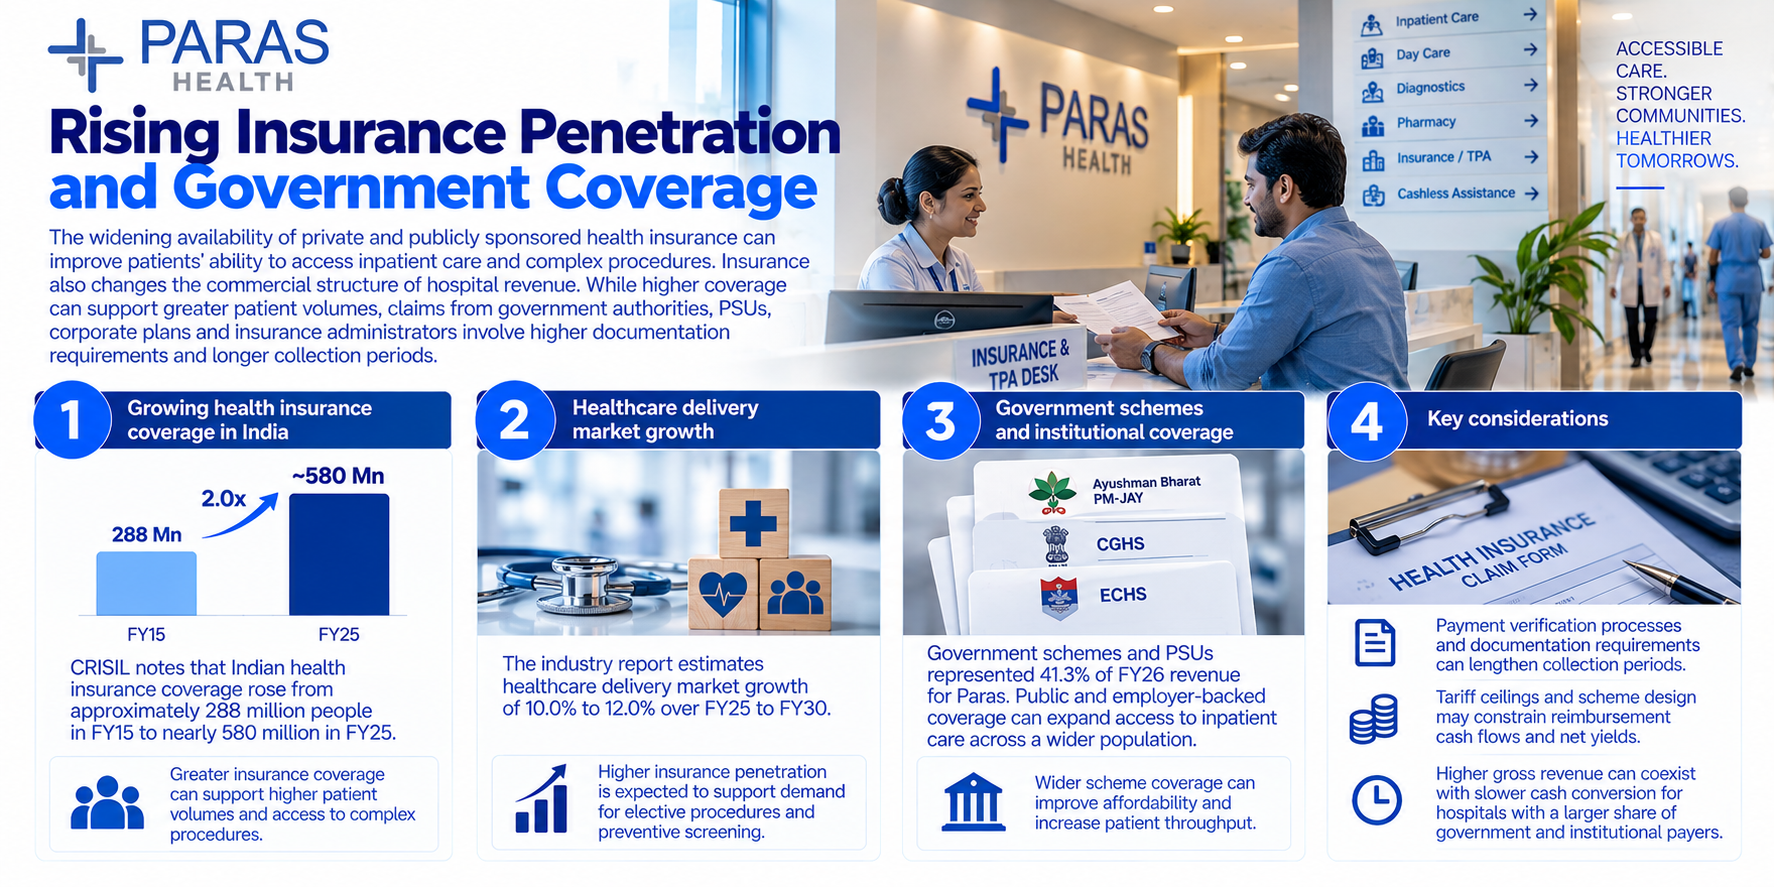
Increasing health insurance coverage is improving access to organised healthcare services and gradually reducing dependence on direct patient payments. According to CRISIL Intelligence, approximately 580.0 million people had health insurance coverage in FY25, compared with 288.0 million in FY15. Insurance penetration increased from 35.0% in FY19 to 41.0% in FY25, supported by private insurance adoption, employer-sponsored policies and government healthcare schemes. The expansion of cashless treatment facilities can encourage patients to undergo planned surgeries, specialised treatment and hospitalisation that might otherwise be postponed due to affordability constraints, thereby supporting demand for private healthcare services.
The key drivers are:
Expansion of the Insured Population: The number of people covered by health insurance approximately doubled between FY15 and FY25. This expanding insured population increases the potential patient base for private hospitals, particularly for elective surgeries and high-value treatments
Government Schemes Improving Healthcare Accessibility: AB-PMJAY and various state-sponsored insurance programmes provide eligible beneficiaries with access to defined inpatient treatment packages. These schemes can increase hospital utilisation in underserved regions where affordability has historically restricted access to private healthcare
Cashless Hospitalisation Supporting Patient Volumes: Cashless insurance arrangements reduce the requirement for patients to arrange substantial upfront funds before treatment. This can encourage greater utilisation of planned surgeries, diagnostic procedures and specialist services, particularly among middle-income households
Increasing Institutional Participation in Healthcare Financing: Greater insurance adoption strengthens the role of insurers, employers and third-party administrators in hospital payments. These arrangements can support patient acquisition and treatment access, although negotiated tariffs and reimbursement conditions influence realised hospital revenue
Ageing Population and Rising Demand for Specialised Medical Treatments
India's changing demographic profile and increasing incidence of chronic diseases are expected to create sustained demand for hospital-based medical services. According to CRISIL Intelligence, the proportion of India's population aged 60 years and above is projected to increase from 10.5% in 2023 to 12.6% by 2030. Age-related conditions, including cardiovascular diseases, cancer, diabetes and orthopaedic disorders, often require repeated consultations, diagnostic testing, surgical interventions and long-term medical supervision. Consequently, demand is expected to increase across outpatient departments, specialised treatment centres, critical care facilities and inpatient services, supporting the expansion of organised hospital networks.
The key drivers are:
Growth in the Elderly Population: The rising proportion of elderly individuals is expected to increase hospital visits, chronic disease management and demand for geriatric care. Older patients frequently require multiple consultations, diagnostic procedures and periodic hospitalisation
Increasing Requirement for Chronic Disease Management: Conditions such as diabetes, hypertension, cardiovascular diseases and cancer require continuous medical monitoring and specialised treatment. This creates recurring demand for diagnostic services, outpatient consultations, medication management and inpatient interventions
Higher Revenue Contribution from Inpatient Services: Inpatient services accounted for approximately 71.0% to 72.0% of India's healthcare delivery market in FY25. Increasing demand for complex procedures and hospitalisation can therefore materially influence healthcare industry revenue growth
Growing Demand for Advanced Diagnostics and Specialised Procedures: Increased detection of lifestyle-related diseases supports demand for MRI, CT scans, pathology, cardiac interventions and cancer treatment. Hospitals offering integrated diagnostic and treatment services can address multiple stages of patient care
Key Industry Risks
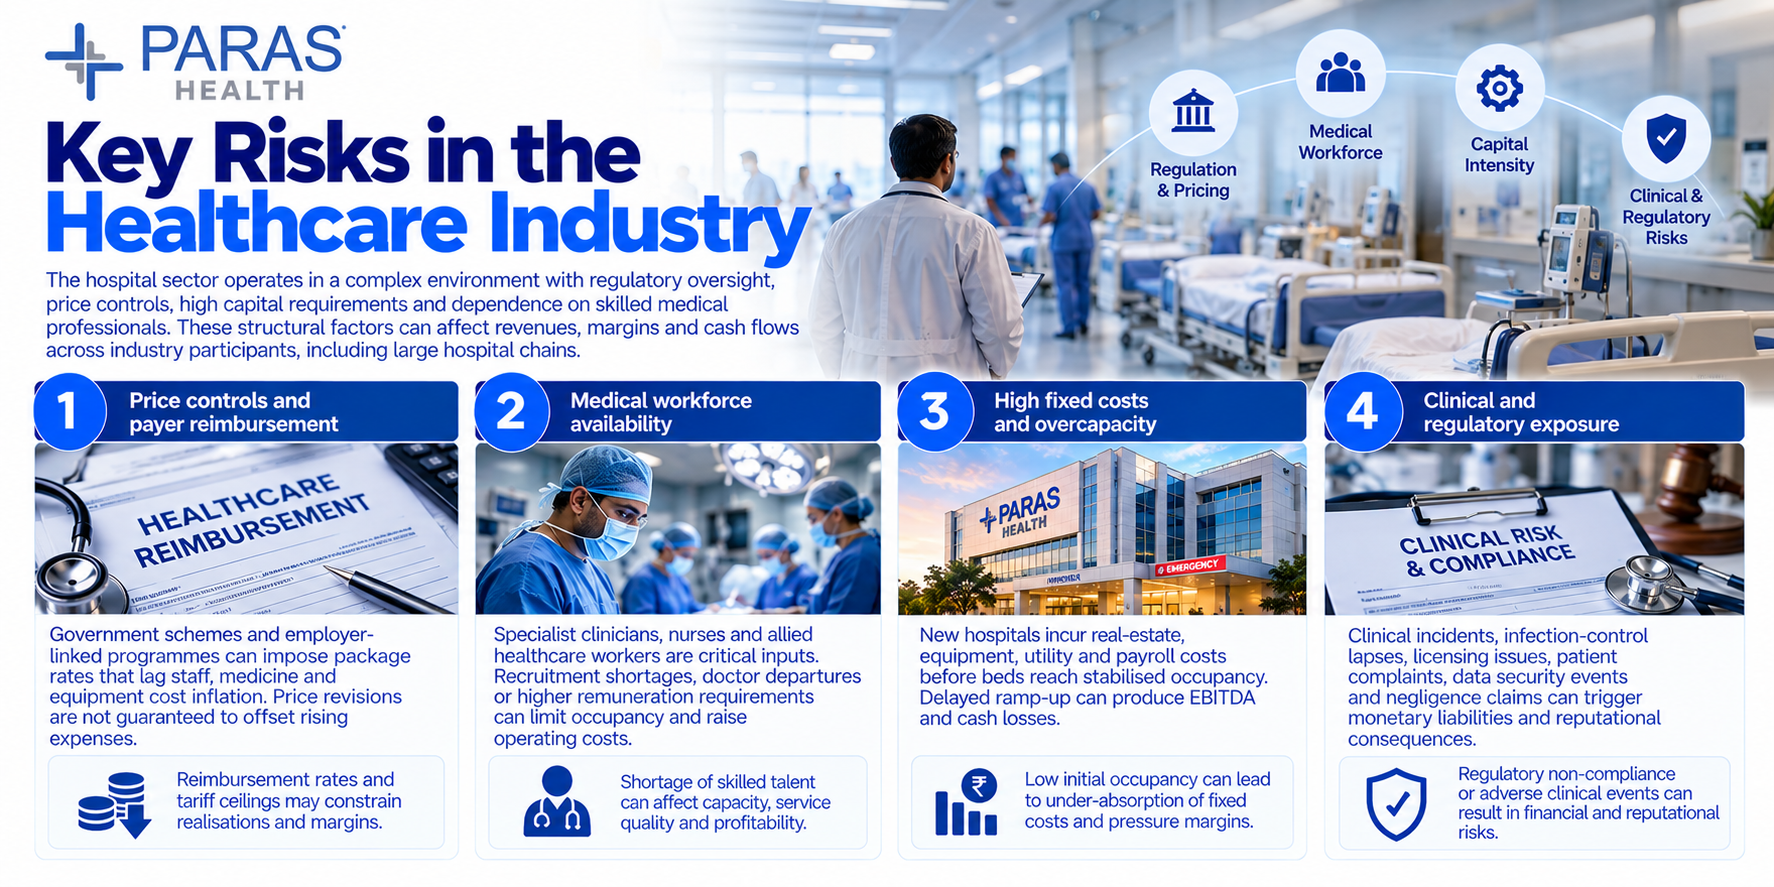
The Indian healthcare delivery industry faces significant financial and operational challenges arising from regulated treatment pricing, shortages of specialised medical professionals, high infrastructure costs and increasing regulatory requirements. According to CRISIL Intelligence, approximately 44.0% of healthcare expenditure is financed directly by patients, highlighting persistent affordability constraints. Hospitals also face delayed reimbursements from government schemes and insurers, which can weaken cash flows despite increasing patient volumes. Additionally, the capital-intensive nature of hospital operations, combined with clinical liability and cybersecurity risks, can adversely affect profitability, capacity utilisation and long-term financial sustainability.
The key risks are:
Government Price Controls and Delayed Reimbursements: Government schemes such as CGHS, ECHS and AB-PMJAY prescribe treatment reimbursement rates that may not keep pace with rising operating costs. Delayed insurance claims and government payments further increase receivables, weakening hospital liquidity.
Shortage of Specialised Medical Professionals: Limited availability of experienced doctors, nurses and technicians, particularly outside metropolitan cities, restricts hospital capacity utilisation and specialised treatment offerings. Competition for medical talent also increases remuneration expenses, recruitment costs and employee attrition.
High Capital Intensity and Prolonged Hospital Stabilisation: Establishing multispecialty hospitals requires substantial upfront investment in infrastructure, medical equipment and clinical personnel. Newly commissioned facilities may experience prolonged operating losses when patient occupancy remains insufficient to absorb fixed expenses and financing costs.
Clinical, Regulatory and Cybersecurity Risks: Hospitals face exposure to medical negligence claims, infection-control failures, licensing requirements and patient safety incidents. Increasing reliance on electronic medical records and connected equipment also creates cybersecurity vulnerabilities, potential data breaches and operational disruption risks.
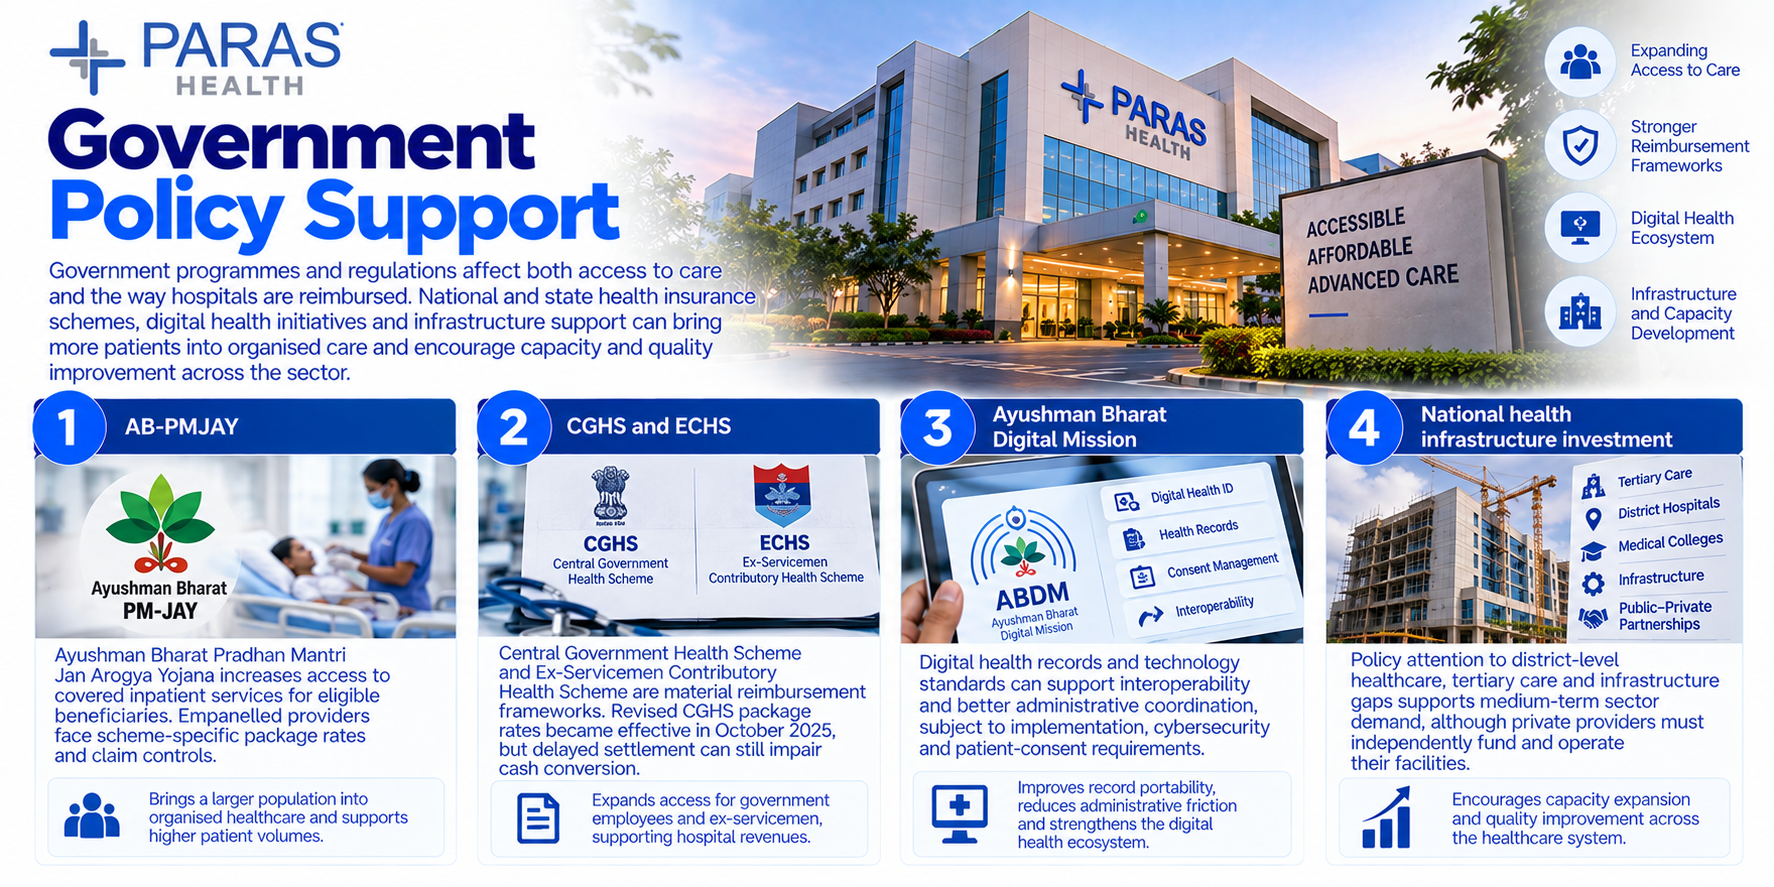
Government Policy Support
Government programmes and regulations affect both access to care and the way hospitals are reimbursed. National and state health insurance schemes can bring previously underserved patients into organised care, while digital health initiatives can improve record portability and administrative coordination. The government also encourages capacity and quality improvement through healthcare infrastructure schemes and public-private partnerships. These sector-wide measures do not guarantee Paras any specific tariff, subsidy, contract or timely collection. Investors must assess eligibility and the company’s actual scheme exposure rather than treating general public support as issuer revenue.
The key policies are:
AB-PMJAY. Ayushman Bharat Pradhan Mantri Jan Arogya Yojana increases access to covered inpatient services for eligible beneficiaries, but empanelled providers face scheme-specific package rates and claim controls
CGHS and ECHS. Central Government Health Scheme and Ex-Servicemen Contributory Health Scheme are material reimbursement frameworks. Revised CGHS package rates became effective in October 2025, but delayed settlement can still impair cash conversion
Ayushman Bharat Digital Mission. Digital health records and technology standards can support interoperability, subject to implementation, cybersecurity and patient-consent requirements
National health infrastructure investment. Policy attention to district-level healthcare, tertiary care and infrastructure gaps supports medium-term sector demand, although private providers must independently fund and operate their facilities
Fundraise/Future Plans
Shareholding
Pre-issue shareholding
Promoter Holding 0.0%
Post-Issue Shareholding
Promoter Holding 0.0%
Category
Pre-Issue%Post-Issue%
Promoters
Dr. Dharminder Kumar
72.8%63.9%
Total Promoter Holding
72.8%63.9%
Additional Shareholders
Other Shareholders
17.2%36.1%
Total Additional Holding
17.2%36.1%
Total Shareholding
90.0%100.0%
- Overview
- Business
- Financial Highlights
- Industry Overview
- Fundraise/Future Plans
- Documentation
Get the Preqt App and keep in touch around the clock!
 Monitor your investments in real-time.
- Receive tailored deal suggestions.
- Get real-time updates and alerts.