


Philips India Limited
Smarter Care, Better LivesAdvancing Health Through Technology
IPO Review and Rating
Watchlist
Overall Recommendation
Philips India offers strong global parentage, healthy ROE, positive operating cash flow, substantial export exposure and an apparently attractive P/E discount. However, FY22–FY24 revenue CAGR was only 4.6%, PAT declined slightly, core margins remain modest, cash flow was working-capital aided, and related-party dependence is exceptionally high. The INR 1,247.7 crore contingent demands, unlisted-share illiquidity and absence of a recurring dividend further reduce the margin of safety
PARAMETER
WEIGHT
SCORE
KEY FACTORS
Financial Performance
25.0%
2.9/5
Cash generation and ROE remain healthy, but low revenue growth, declining PAT, modest margins and lease liabilities constrain quality
Show more
Detailed Analysis
Revenue increased from INR 5,481.4 crore in FY22 to INR 6,000.4 crore in FY24, representing only 4.6% CAGR
Core FY24 EBITDA was approximately INR 447.4 crore, producing a modest 7.5% operating margin
FY24 PAT of INR 257.5 crore represented a 4.3% margin, slightly below FY23’s 4.5%
Conventional borrowings were nil, but INR 400.7 crore lease liabilities produce a conservative lease-adjusted D/E of 0.27×
Reported FY24 ROE was a healthy 18.9%, supported partly by the reduced equity base following the special dividend
Industry
25.0%
3.0/5
Medtech enjoys structural growth and export demand, but regulation and intense multinational competition limit industry attractiveness.
Show more
Detailed Analysis
India’s medical-devices market is projected to grow at approximately 16.4% CAGR through 2030
Indian medtech remains in the growth stage, driven by hospital investment, diagnostics, localisation and digital healthcare adoption
The market contains numerous multinational and domestic competitors
Medical equipment is highly regulated through product approvals, quality standards, pricing rules and post-market compliance requirements
Approximately 52.2% of FY24 customer-contract revenue came from outside India, demonstrating strong international demand
Management
25.0%
3.5/5
Experienced parentage supports governance, but board independence, large tax contingencies and substantial group transactions warrant close monitoring
Show more
Detailed Analysis
The Company is 96.13% owned by Koninklijke Philips N.V., providing extensive global healthcare-technology experience and operating expertise
Two of five directors listed at the report date were independent, giving 40% board independence
No promoter pledge was disclosed, but disputed tax and provident-fund demands total approximately INR 1,247.7 crore
Related-party purchases exceeded 30% of revenue, while group sales and services exceeded 50%, creating substantial parent-group dependence
Valuation Metrics
25.0%
3.3/5
Headline P/E appears discounted, but EV/EBITDA, book-value premium, stale inputs and unlisted liquidity reduce the apparent bargain
Show more
Detailed Analysis
FY24-adjusted P/E is approximately 25.1× versus the 51× industry P/E, representing a 50.7% discount
Lease-adjusted EV/EBITDA is approximately 14.7×, above the roughly 10.8× FY24 median of Siemens Healthineers and GE HealthCare
FY24-adjusted P/B is approximately 4.3×
TOTAL
100%
3.2/5
Weighted Composite Score
Per Share Price
₹1199.0
As of 14 Oct 2026
Lot Size
10.0 Shares
Minimum Investment
₹11,990.0 / 10 shares
Market Cap. (₹ Cr)
Revenue FY’24
PAT FY’24
P/E Multiple
Face Value
₹ 10.0Lot Size
10.0 sharesPAT FY’24
₹ 257.5 CrPAT Margin (%)
4.3 %P/E Multiple
25.1xCAGR Growth 2Y
4.6 %ROE (FY’24)
18.9 %ROCE (FY’24)
22.5 %Price to Book Value ratio
4.3xDebt/Equity (FY’24)
0.3xMerchant banker appointed
❌ NoCompany Website
www.philips.co.inDisclaimer: Unlisted shares are unregulated & illiquid. This is NOT investment advice. Please do your own due diligence before investing.
Minimum Investment
₹11,990.0 / 10 sharesShares Lot 10 X 1
Investment amount
₹11,990.0
Overview
Business
Products
Business Model
Geographical Presence
Sales Channel
Financial Highlights
Income Statement
Revenue growth with EBITDA and PAT margins
| Financial Metric | FY 2022 | FY 2023 | FY 2024 |
|---|---|---|---|
| Revenue (₹ Cr) | 5,481.4 | 5,743.0 | 6,000.4 |
| Growth (%) | 13.2% | 4.6% | 4.6% |
| EBITDA (₹ Cr) | 334.1 | 403.8 | 447.4 |
| EBITDA Margin (%) | 6.1% | 7.0% | 7.5% |
| PAT (₹ Cr) | 265.9 | 260.0 | 257.5 |
| PAT Margin (%) | 4.9% | 4.5% | 4.3% |
OBSERVATIONS & INSIGHTS
Revenue growth slowed from 13.2% in FY22 to 4.6% in both FY23 and FY24, producing a 4.6% two-year CAGR
Analytical EBITDA increased 33.9% across the period and the margin expanded by 1.4 percentage points to 7.5%
PAT declined from ₹265.9 Cr to ₹257.5 Cr and EPS eased to ₹44.8 despite better EBITDA, reflecting depreciation, finance cost, tax and other-income movements
FY22 profit included a ₹130.9 Cr exceptional gain and a small discontinued-operation contribution; the analytical EBITDA deliberately excludes the gain
Balance Sheet
| Financial Metric | FY 2023 | FY 2024 | FY 2025 |
|---|---|---|---|
| EQUITY & LIABILITIES | ₹ 3,200.6 Cr | ₹ 3,915.7 Cr | ₹ 0.0 Cr |
| Net Worth | ₹ 1,234.3 Cr | ₹ 1,489.6 Cr | ₹ 0.0 Cr |
| Share Capital | ₹ 57.5 Cr | ₹ 57.5 Cr | ₹ 0.0 Cr |
| Reserves & Surplus | ₹ 1,176.8 Cr | ₹ 1,432.1 Cr | ₹ 0.0 Cr |
| Total Liabilities | ₹ 1,966.3 Cr | ₹ 2,426.1 Cr | ₹ 0.0 Cr |
| Current Liabilities | ₹ 1,500.6 Cr | ₹ 1,567.5 Cr | ₹ 0.0 Cr |
| Borrowings | ₹ 0.0 Cr | ₹ 0.0 Cr | ₹ 0.0 Cr |
| Trade Payables | ₹ 695.3 Cr | ₹ 720.5 Cr | ₹ 0.0 Cr |
| Other Current Liabilities | ₹ 805.3 Cr | ₹ 847.0 Cr | ₹ 0.0 Cr |
| Non-Current Liabilities | ₹ 465.7 Cr | ₹ 858.6 Cr | ₹ 0.0 Cr |
| Borrowings | ₹ 0.0 Cr | ₹ 0.0 Cr | ₹ 0.0 Cr |
| Other Non-Current Liabilities | ₹ 465.7 Cr | ₹ 858.6 Cr | ₹ 0.0 Cr |
| ASSETS | ₹ 3,200.6 Cr | ₹ 3,915.7 Cr | ₹ 0.0 Cr |
| Current Assets | ₹ 2,120.8 Cr | ₹ 2,353.9 Cr | ₹ 0.0 Cr |
| Trade Receivables | ₹ 740.1 Cr | ₹ 917.1 Cr | ₹ 0.0 Cr |
| Inventory | ₹ 718.4 Cr | ₹ 824.0 Cr | ₹ 0.0 Cr |
| Cash & Cash Equivalents | ₹ 211.8 Cr | ₹ 272.8 Cr | ₹ 0.0 Cr |
| Other Current Assets | ₹ 450.5 Cr | ₹ 340.0 Cr | ₹ 0.0 Cr |
| Non-Current Assets | ₹ 1,079.8 Cr | ₹ 1,561.8 Cr | ₹ 0.0 Cr |
| Fixed Assets | ₹ 501.8 Cr | ₹ 968.0 Cr | ₹ 0.0 Cr |
| Other Non-Current Assets | ₹ 578.0 Cr | ₹ 593.8 Cr | ₹ 0.0 Cr |
OBSERVATIONS & INSIGHTS
Shareholders' wealth fell sharply in FY23 following the large dividend and recovered to ₹1,489.6 Cr in FY24 through retained earnings
Fixed assets nearly doubled to ₹968.0 Cr in FY24, consistent with investment in the Pune and Bengaluru operating footprint
Trade receivables reached ₹917.1 Cr in FY24, increasing the importance of customer acceptance, collections and credit control
Other non-current liabilities increased to ₹858.6 Cr, driven substantially by long-term lease and related obligations rather than conventional borrowing
Cash Flow
| Financial Metric | FY 2022 | FY 2023 | FY 2024 |
|---|---|---|---|
CFO (₹ Cr) Cash generated from core business operations. | +131.7 Cr | +341.3 Cr | +735.5 Cr |
CFI (₹ Cr) Cash used for investments and long-term assets. | +368.2 Cr | -52.9 Cr | -582.9 Cr |
CFF (₹ Cr) Cash flow related to funding and borrowings. | -115.3 Cr | -1,392.5 Cr | -91.7 Cr |
Financial Ratios
Measures the company’s leverage relative to shareholder equity.
OBSERVATIONS & INSIGHTS
ROE rose to 18.9% and ROCE to 22.5%, assisted by improving EBIT and the lower average equity base after the FY23 dividend
Year-end financial borrowings were nil in all three years, although lease liabilities increased materially in FY24 and remain economic obligations
Interest coverage fell to 9.4x as finance cost increased, but it remained comfortable and should be read together with lease commitments
The current ratio recovered slightly to 1.5x in FY24 after the FY23 dividend-driven decline, remaining above 1.0
Industry Overview
Industry Drivers
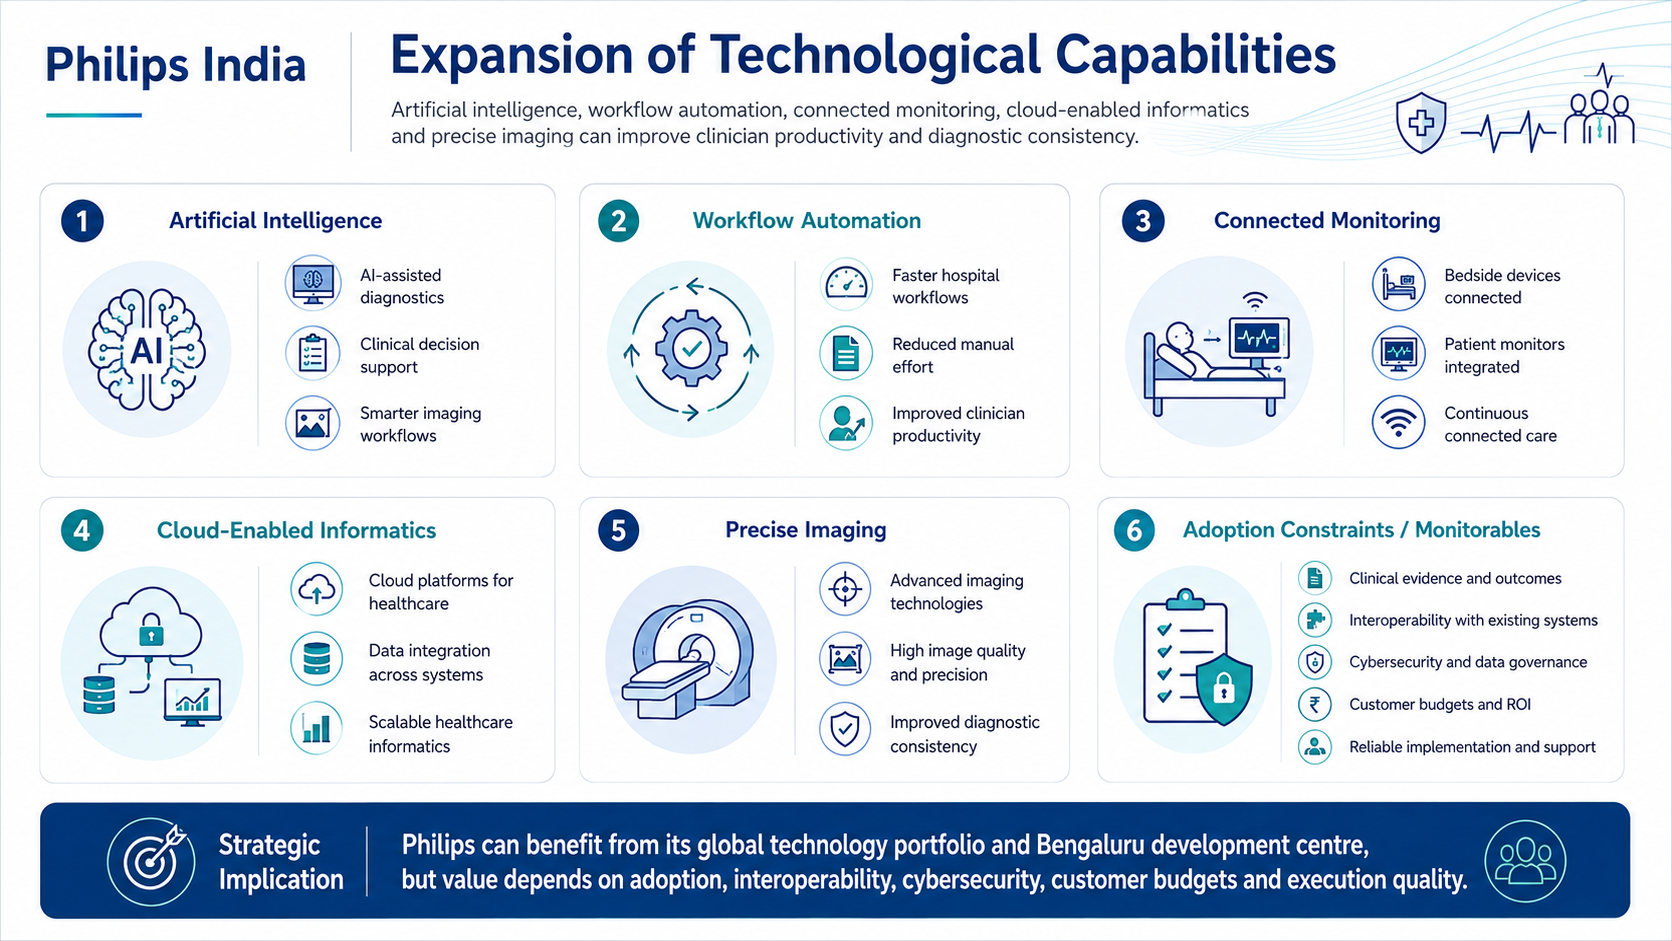
Expansion of Technological Capabilities
Artificial intelligence, workflow automation, connected monitoring, cloud-enabled informatics and more precise imaging can improve clinician productivity and diagnostic consistency
Philips can benefit through its global technology portfolio and Bengaluru development centre, but adoption depends on clinical evidence, interoperability, cybersecurity, data governance, customer budgets and reliable implementation
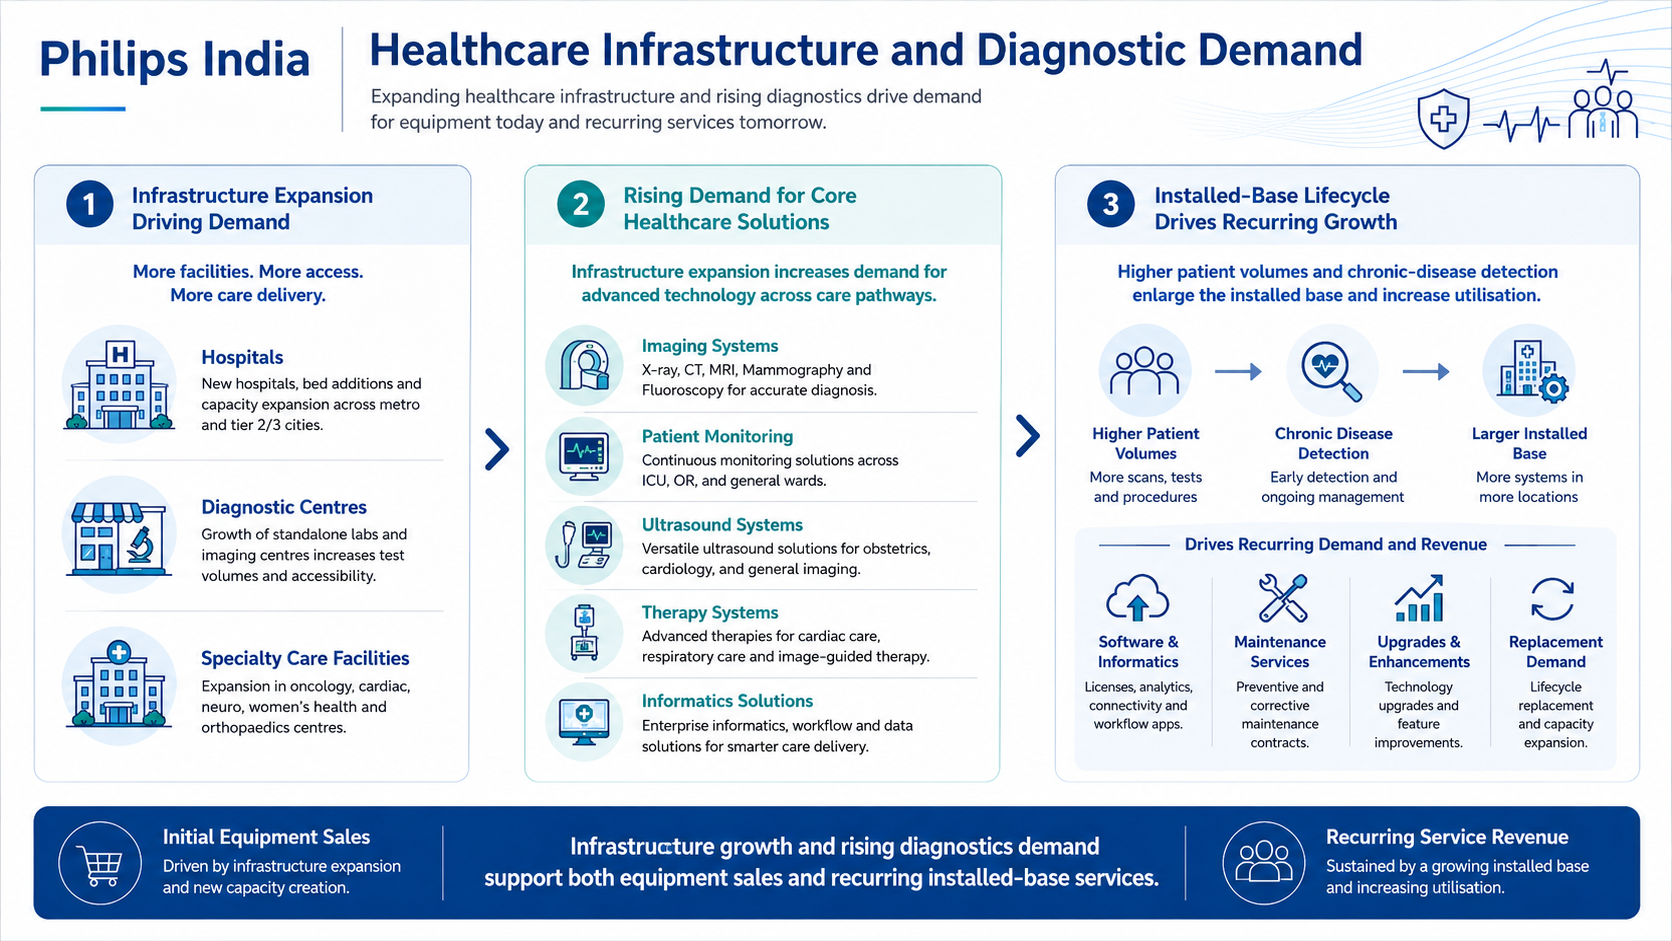
Healthcare Infrastructure and Diagnostic Demand
Expansion of hospitals, diagnostic centres and specialty-care capacity increases demand for imaging, monitoring, ultrasound, therapy and informatics systems
Higher patient volumes and chronic-disease detection also enlarge the installed base that requires software, maintenance, upgrades and replacement, supporting both initial equipment sales and recurring service revenue
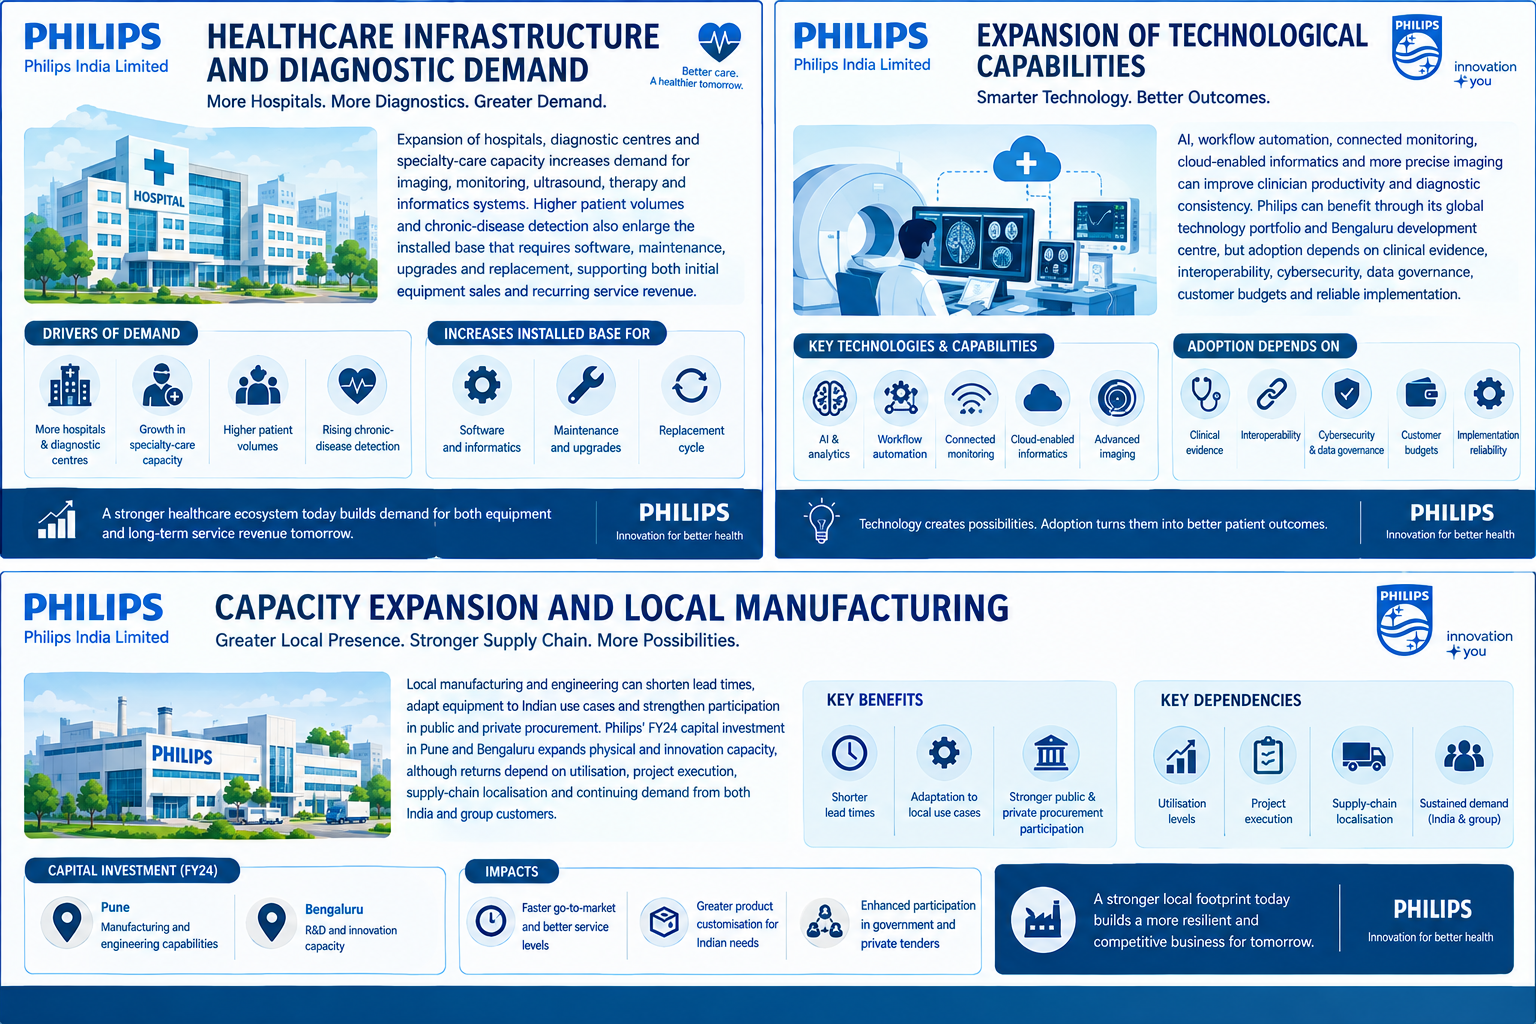
Capacity Expansion and Local Manufacturing
Local manufacturing and engineering can shorten lead times, adapt equipment to Indian use cases and strengthen participation in public and private procurement
Philips' FY24 capital investment in Pune and Bengaluru expands physical and innovation capacity, although returns depend on utilisation, project execution, supply-chain localisation and continuing demand from both India and group customers
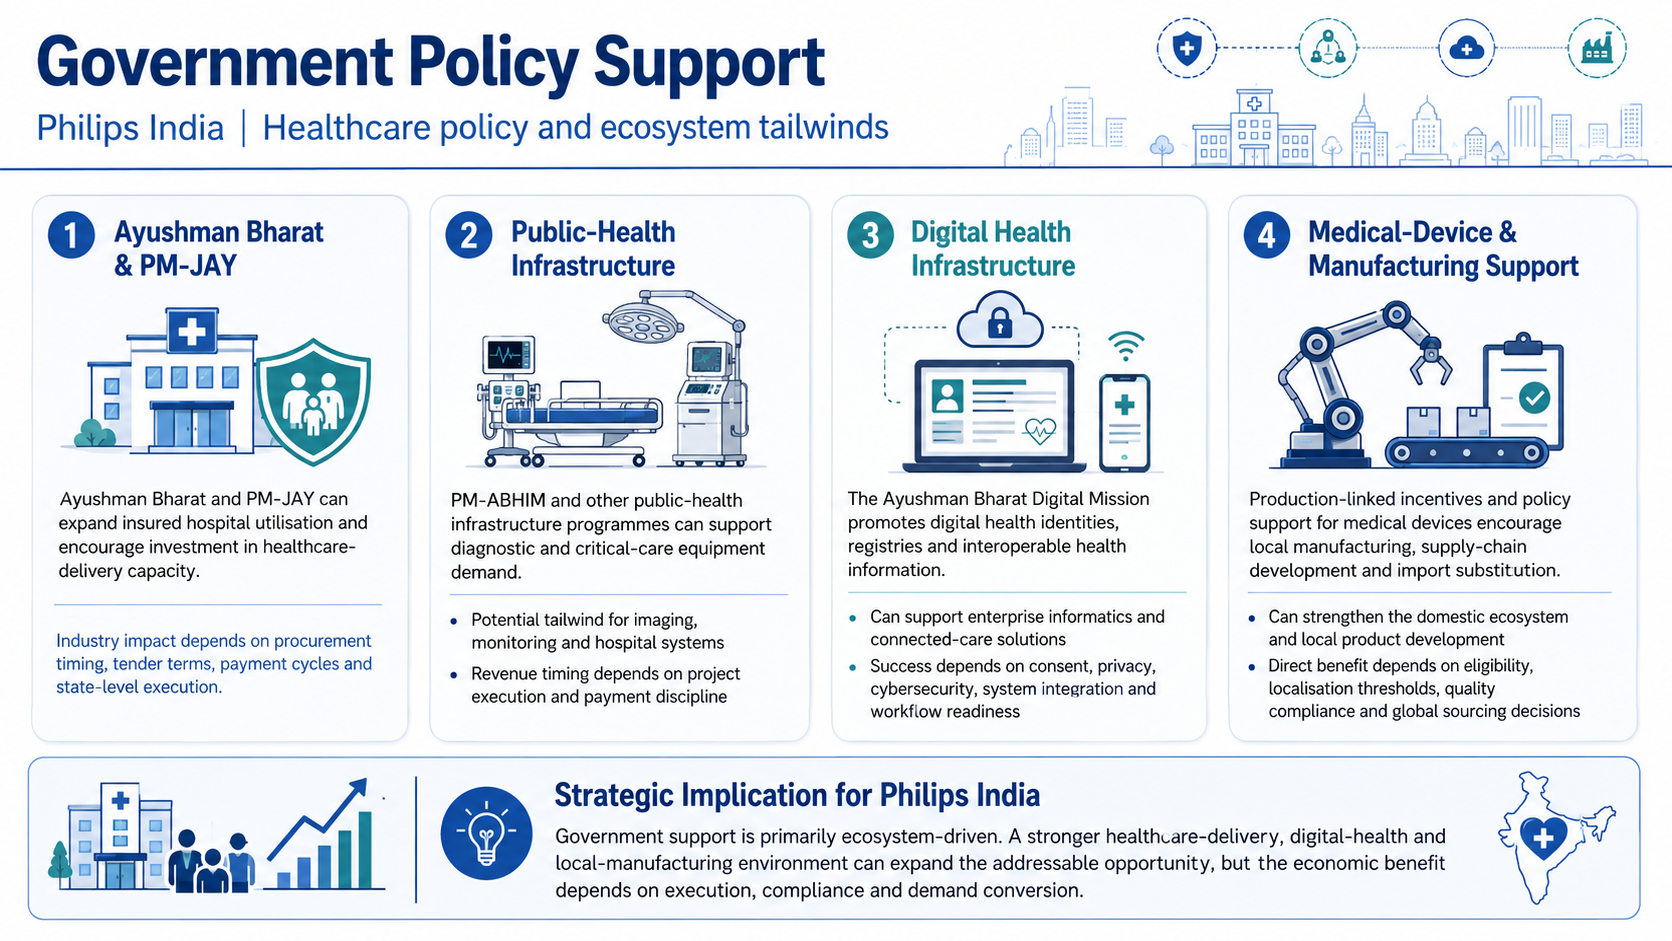
Government Policy Support
Ayushman Bharat and PM-JAY can expand insured hospital utilisation and encourage investment in healthcare delivery capacity
PM-ABHIM and other public-health infrastructure programmes can support diagnostic and critical-care equipment demand, although procurement timing, tender terms, payment cycles and state-level execution determine when industry revenue is realised
The Ayushman Bharat Digital Mission promotes digital health identities, registries and interoperable health information
Greater digitisation can support enterprise informatics and connected-care solutions, but providers must address consent, privacy, cybersecurity, integration with existing systems and the practical readiness of clinical workflows
Production-linked incentives and policy support for medical devices encourage local manufacturing, supply-chain development and import substitution
Philips can benefit from a deeper domestic ecosystem and local product development, while programme eligibility, localisation thresholds, quality compliance and global sourcing decisions will determine the direct economic effect
- Overview
- Business
- Financial Highlights
- Industry Overview
- Documentation
Get the Preqt App and keep in touch around the clock!
 Monitor your investments in real-time.
- Receive tailored deal suggestions.
- Get real-time updates and alerts.
