

Polymatech Electronics
Precision in SemiconductorsMade in India
Unlisted Review and Rating
Strong Buy
DRHP Not Filed Engineering High-Performance Semiconductor Solutions for a Connected Future.
Polymatech Electronics scores 4.3/5.0. Revenue increased from INR 649.0 Cr in FY23 to INR 1,902.9 Cr in FY25, representing a 71.2% 2-year CAGR, while FY25 EBITDA stood at approximately INR 496.3 Cr with a 26.1% margin and audited PAT at INR 375.6 Cr with a 19.7% margin. Conventional financial D/E is approximately 0.1x, estimated ROE is 37.1%, and operating cash flow increased 73.0% to INR 439.2 Cr. India's semiconductor demand is projected to grow at 15.0% CAGR, domestic wafer capacity remains only approximately 0.1% of the global total, and Polymatech generated INR 711.5 Cr of foreign-exchange earnings, equivalent to 37.4% of consolidated revenue. Management metrics include 30+ years of promoter experience, 33.3% Board independence, 0 pending FY25 litigation and RPTs of approximately 0.3% of revenue. At the stated valuation, the Company trades at 5.2x P/E, 3.1x EV/EBITDA, 1.6x P/B and 0.98x P/S, representing a 79.3% P/E discount to the stated industry benchmark and approximately 93.0% EV/EBITDA discount to the selected listed-peer median.
PARAMETER
WEIGHT
SCORE
KEY FACTORS
Financial Performance
25.0%
5.0/5
Revenue recorded a 71.2% 2-year CAGR, with FY25 growth of 55.9%. FY25 EBITDA margin stood at 26.1%, PAT margin at 19.7%, conventional D/E at approximately 0.1x, estimated ROE at 37.1%, and OCF increased 73.0% to INR 439.2 C
Show more
Detailed Analysis
Revenue increased from INR 649.0 Cr in FY23 to INR 1,220.7 Cr in FY24 and INR 1,902.9 Cr in FY25, representing a 71.2% FY23-FY25 2-year CAGR and 55.9% FY25 YoY growth
FY25 mechanical EBITDA stood at approximately INR 496.3 Cr, based on PBT of INR 444.5 Cr, finance cost of INR 0.3 Cr and D&A of INR 51.5 Cr, resulting in a 26.1% EBITDA margin
Audited consolidated PAT stood at INR 375.6 Cr, representing a 19.7% PAT margin and 56.4% YoY growth from FY24 PAT of INR 240.1 Cr
Financial borrowings plus lease liabilities were approximately INR 60.4 Cr against consolidated equity of approximately INR 1,172.1 Cr, resulting in conventional D/E of approximately 0.1x
FY25 PAT attributable to owners of INR 361.4 Cr against estimated average owner equity of approximately INR 975.1 Cr resulted in estimated ROE of 37.1%
Operating cash flow remained positive at INR 253.9 Cr in FY24 and INR 439.2 Cr in FY25, representing 73.0% YoY growth
Industry
25.0%
4.0/5
India's semiconductor demand is projected to grow at 15.0% CAGR to USD 108.0 Bn by 2030. Domestic semiconductor manufacturing remains Emerging, with India representing only approximately 0.1% of global wafer capacity. Industry concentration is assessed as Medium
Show more
Detailed Analysis
India's semiconductor end-demand revenue is projected to increase from approximately USD 54.0 Bn in 2025 to USD 108.0 Bn by 2030, representing a 15.0% CAGR
Semiconductor fabs and ATMP/OSAT units can receive up to 50.0% capital-expenditure support, while projects remain dependent on scheme approvals, environmental clearances, infrastructure and technology-related regulations
Management
25.0%
4.0/5
Leadership experience exceeds 30 years, FY25 Board independence stood at approximately 33.3%, the latest specifically disclosed promoter pledge was 0.0%, FY25 pending litigation was 0, and disclosed RPTs were approximately INR 5.0 Cr or 0.3% of consolidated revenue.
Show more
Detailed Analysis
Managing Director Eswara Rao Nandam has 30+ years of experience in electronics, components manufacturing, assembly, automation and manufacturing operations
Board comprised approximately 6 Directors with 2 Independent Directors, resulting in 33.3% independent representation.
The 2023 DRHP disclosed 0.0% promoter-share pledge, while FY25 consolidated notes disclose 0 pending litigation. No subsequent promoter pledge was identified in the reviewed FY25 disclosures
The 2023 DRHP disclosed 0.0% promoter-share pledge, while FY25 consolidated notes disclose 0 pending litigation. No subsequent promoter pledge was identified in the reviewed FY25 disclosures
Valuation Metrics
25.0%
4.0/5
The Company is valued at 5.18x P/E, 3.1x EV/EBITDA, approximately 1.6x P/B and 0.98x P/S. P/E represents a 79.3% discount to the stated 25.0x industry P/E, while EV/EBITDA represents a 93.0% discount to the selected 44.5x listed-peer median.
Show more
Detailed Analysis
The valuation of the Company is 5.2x P/E against the stated industry P/E of 25.0x, representing a 79.3% discount
Estimated enterprise value of approximately INR 1,538.1 Cr against FY25 EBITDA of INR 496.3 Cr results in 3.1x EV/EBITDA, versus a selected listed-peer median of approximately 44.5x, representing a 93.0% discount
The valuation of the Company is approximately 1.6x P/B, supported by market cap of INR 1,872.7 Cr against owner-attributable equity of approximately INR 1,157.8 Cr
Indicative unlisted price was INR 50.84/share as of August 8, 2026, against a 52-week range of INR 50.0-INR 87.0, representing a 42.5% peak-to-trough range
TOTAL
100%
4.3/5
Weighted Composite Score
Per Share Price
₹46.0
As of 14 Oct 2026
Lot Size
1,000.0 Shares
Minimum Investment
₹46,000.0 / 1,000 shares
Market Cap. (₹ Cr)
Revenue FY’25
PAT FY’25
P/E Multiple
Face Value
₹ 2.0Lot Size
1,000.0 sharesPAT FY’25
₹ 375.6 CrPAT Margin (%)
19.7 %P/E Multiple
6.0xCAGR Growth 2Y
147.3 %ROE (FY’25)
4.5 %ROCE (FY’25)
38.0 %Price to Book Value ratio
1.6xDebt/Equity (FY’25)
1.6xMerchant banker appointed
❌ NoCompany Website
www.polymatechworld.comDisclaimer: Unlisted shares are unregulated & illiquid. This is NOT investment advice. Please do your own due diligence before investing.
Minimum Investment
₹46,000.0 / 1,000 sharesShares Lot 1000 X 1
Investment amount
₹46,000.0
Overview
Business
Business Model
Geographical Presence
Sales Channel
Financial Highlights
Income Statement
Revenue growth with EBITDA and PAT margins
| Financial Metric | FY 2023 | FY 2024 | FY 2025 |
|---|---|---|---|
| Revenue (₹ Cr) | 649.0 | 1,220.7 | 1,902.9 |
| Growth (%) | - | 88.1% | 55.9% |
| EBITDA (₹ Cr) | 188.0 | 320.3 | 496.3 |
| EBITDA Margin (%) | 29.0% | 26.2% | 26.1% |
| PAT (₹ Cr) | 167.8 | 240.1 | 361.4 |
| PAT Margin (%) | 25.8% | 19.7% | 19.0% |
OBSERVATIONS & INSIGHTS
Revenue from operations increased from INR 649.0 Cr in FY23 to INR 1,220.7 Cr in FY24 and INR 1,902.9 Cr in FY25. The apparent 71.2% FY23-FY25 CAGR is not organic like-for-like growth because FY25 includes newly acquired overseas subsidiaries
The underlying parent trend weakened sharply in FY25: standalone revenue fell approximately 41.3% to INR 716.6 Cr and standalone PAT fell approximately 60.2% to INR 95.5 Cr versus FY24. The group nevertheless reported INR 1,902.9 Cr revenue and INR 361.4 Cr owner-attributable PAT because the consolidated perimeter had expanded
Analytical EBITDA margin moderated from 29.0% in FY23 to 26.2% in FY24 and 26.1% in FY25, while owner-PAT margin moderated from approximately 25.8% to 19.0%. Profitability remains high, but the change in business mix and consolidation scope must be separated from operating efficiency
The user snapshot labels INR 379.76 Cr as PAT. In the audited FY25 consolidated statements, INR 379.76 Cr is total comprehensive income; PAT is INR 375.59 Cr, including INR 361.37 Cr attributable to owners. The supplied EPS of INR 9.07 and P/E of 5.18x align with owner-attributable earnings
Balance Sheet
| Financial Metric | FY 2023 | FY 2024 | FY 2025 |
|---|---|---|---|
| EQUITY & LIABILITIES | ₹ 387.8 Cr | ₹ 1,616.0 Cr | ₹ 3,081.4 Cr |
| Net Worth | ₹ 324.5 Cr | ₹ 792.4 Cr | ₹ 1,172.1 Cr |
| Share Capital | ₹ 71.9 Cr | ₹ 79.7 Cr | ₹ 79.7 Cr |
| Reserves & Surplus | ₹ 252.6 Cr | ₹ 712.7 Cr | ₹ 1,092.4 Cr |
| Total Liabilities | ₹ 63.3 Cr | ₹ 823.6 Cr | ₹ 1,909.3 Cr |
| Current Liabilities | ₹ 26.0 Cr | ₹ 772.4 Cr | ₹ 1,825.3 Cr |
| Borrowings | ₹ 6.2 Cr | ₹ 0.0 Cr | ₹ 0.2 Cr |
| Trade Payables | ₹ 19.7 Cr | ₹ 275.9 Cr | ₹ 695.9 Cr |
| Other Current Liabilities | ₹ 0.1 Cr | ₹ 496.5 Cr | ₹ 1,129.2 Cr |
| Non-Current Liabilities | ₹ 37.3 Cr | ₹ 51.2 Cr | ₹ 84.0 Cr |
| Borrowings | ₹ 37.3 Cr | ₹ 21.1 Cr | ₹ 53.4 Cr |
| Other Non-Current Liabilities | ₹ 0.0 Cr | ₹ 30.1 Cr | ₹ 30.6 Cr |
| ASSETS | ₹ 387.7 Cr | ₹ 1,616.1 Cr | ₹ 3,081.6 Cr |
| Current Assets | ₹ 233.1 Cr | ₹ 1,169.8 Cr | ₹ 2,451.1 Cr |
| Trade Receivables | ₹ 133.3 Cr | ₹ 519.7 Cr | ₹ 1,252.2 Cr |
| Inventory | ₹ 36.2 Cr | ₹ 267.3 Cr | ₹ 731.6 Cr |
| Cash & Cash Equivalents | ₹ 41.3 Cr | ₹ 22.1 Cr | ₹ 392.3 Cr |
| Other Current Assets | ₹ 22.3 Cr | ₹ 360.7 Cr | ₹ 75.0 Cr |
| Non-Current Assets | ₹ 154.6 Cr | ₹ 446.3 Cr | ₹ 630.5 Cr |
| Fixed Assets | ₹ 154.6 Cr | ₹ 446.3 Cr | ₹ 609.4 Cr |
| Other Non-Current Assets | ₹ 0.0 Cr | ₹ 0.0 Cr | ₹ 21.1 Cr |
OBSERVATIONS & INSIGHTS
Total assets expanded from INR 387.8 Cr in FY23 to INR 1,616.0 Cr in FY24 and INR 3,081.5 Cr in FY25, reflecting both heavy investment and the addition of overseas subsidiaries to the group reporting perimeter
Total equity increased from INR 324.5 Cr in FY23 to INR 792.4 Cr in FY24 and INR 1,172.1 Cr in FY25. Gross borrowings remained modest at approximately INR 53.6 Cr in FY25, leaving the group in a substantial net-cash position based on cash / bank and current investments
Trade receivables increased to INR 1,252.2 Cr and inventory to INR 731.6 Cr in FY25. Together they represent approximately 64.4% of group assets, making working-capital quality more important than headline debt leverage
Current liabilities increased to INR 1,825.3 Cr in FY25, including INR 695.9 Cr of trade payables and a large residual of other current liabilities. The mix and contractual nature of customer advances / other obligations should be understood entity by entity
FY25 owner equity is high relative to borrowings, but the subsequent AGM notice proposed conversion of INR 204.0 Cr of promoter loans into 3.4 Cr shares at INR 60 per share and also sought approval for promoter loans up to INR 500.0 Cr with a conversion option. These are post-FY25 capital-structure monitorables and should be verified for completion status
Cash Flow
| Financial Metric | FY 2023 | FY 2024 | FY 2025 |
|---|---|---|---|
CFO (₹ Cr) Cash generated from core business operations. | +47.5 Cr | +253.9 Cr | +439.2 Cr |
CFI (₹ Cr) Cash used for investments and long-term assets. | -80.3 Cr | +477.2 Cr | -102.2 Cr |
CFF (₹ Cr) Cash flow related to funding and borrowings. | +74.1 Cr | +204.1 Cr | +33.1 Cr |
Working Capital
| Efficiency Metric | FY 2023 | FY 2024 | FY 2025 |
|---|---|---|---|
Debtor Days Average number of days taken to collect customer payments. | - | - | - |
Creditor Days Average time taken to pay suppliers and vendors. | - | - | - |
Inventory Days Average number of days inventory remains unsold. | - | - | - |
CCC (Cash Conversion Cycle) (Debtor Days + Inventory Days - Creditor Days) | - | - | - |
Financial Ratios
Measures the company’s leverage relative to shareholder equity.
OBSERVATIONS & INSIGHTS
Debt-servicing capacity is exceptionally strong. Interest coverage improved from an already comfortable 52.5x in FY23 to 2,054.0x in FY24, remaining extremely high at 1,689.3x in FY25. The unusually high ratios are driven primarily by negligible finance costs rather than simply very high EBIT.
ROA has moderated as the balance sheet expanded rapidly. ROA declined from 63.5% in FY23 to 24.0% in FY24 and 16.0% in FY25. While the decline appears sharp, the asset base expanded from INR 387.8 Cr in FY23 to more than INR 3,081.5 Cr in FY25, partly due to acquisitions and international expansion. A mid-teens FY25 ROA remains healthy for a manufacturing business.
Capital efficiency remains strong despite expansion. FY25 consolidated ROCE was reported at 38.0%, indicating strong operating returns on the enlarged capital base. However, FY25 is not fully comparable with prior years because the consolidation perimeter changed materially during the year.
Liquidity has become more working-capital intensive. The current ratio compressed substantially from the unusually high FY23 level as inventory, receivables, trade payables and other current liabilities expanded with scale. Liquidity remains adequate, but the balance sheet is structurally more working-capital intensive than before.
Low financial leverage is a key strength. Conventional financial borrowings remain modest relative to the equity and asset base, which explains the extremely high interest coverage and reduces refinancing risk. The reported FY25 debt/equity ratio should, however, be read carefully because the Company's disclosed ratio definition is broader than conventional borrowings-to-equity.
Industry Overview
Industry Drivers
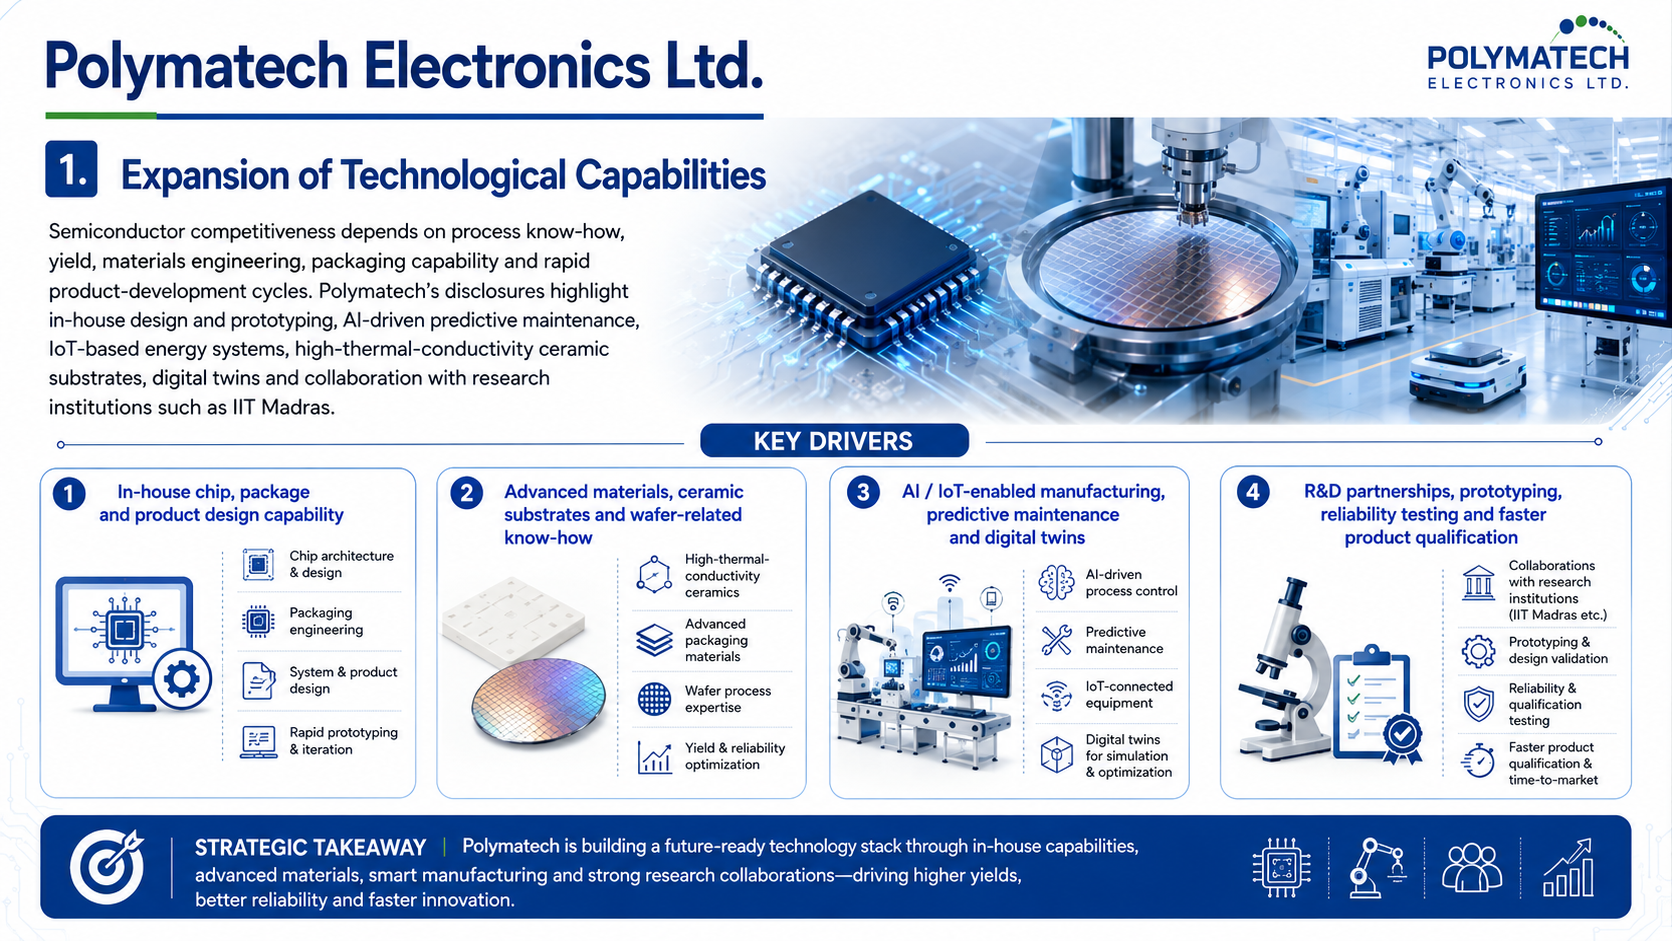
Expansion of Technological Capabilities
Semiconductor competitiveness depends on process know-how, yield, materials engineering, packaging capability and rapid product-development cycles
Polymatech's disclosures highlight in-house design / prototyping, AI-driven predictive maintenance, IoT-based energy systems, high-thermal-conductivity ceramic substrates, digital twins and collaboration with research institutions such as IIT Madras
Key Drivers
In-house chip, package and product design capability
Advanced materials, ceramic substrates and wafer-related know-how
AI / IoT-enabled manufacturing, predictive maintenance and digital twins
R&D partnerships, prototyping, reliability testing and faster product qualification
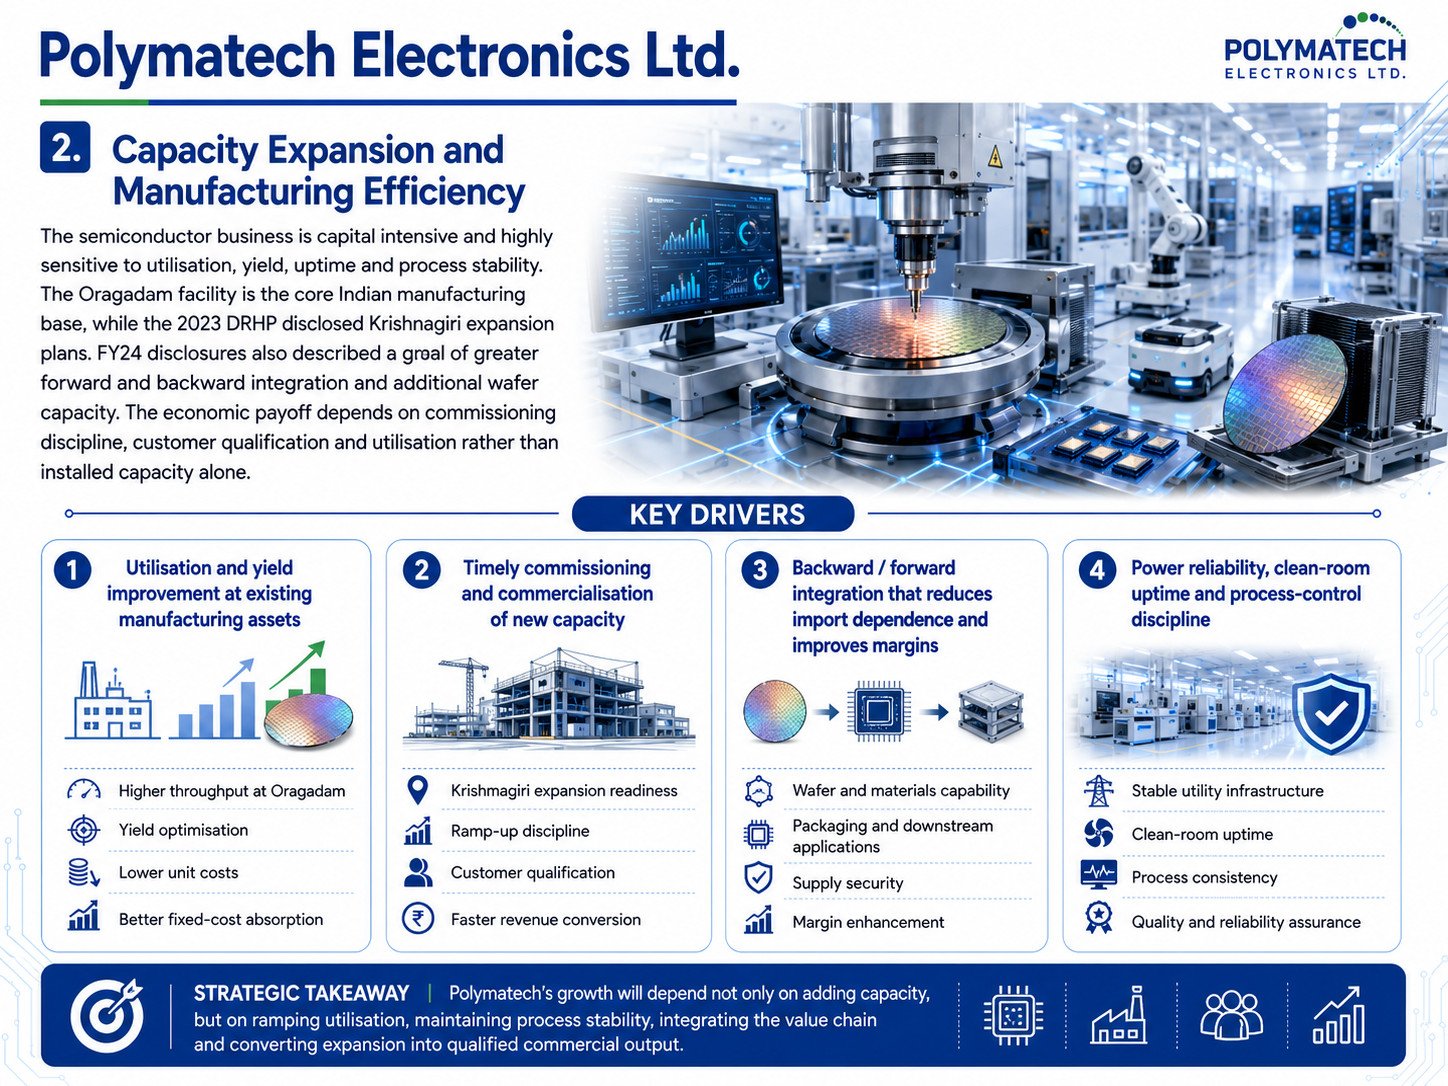
Capacity Expansion
The semiconductor business is capital intensive and highly sensitive to utilisation, yield, uptime and process stability. The Oragadam facility is the core Indian manufacturing base, while the 2023 DRHP disclosed Krishnagiri expansion plans
FY24 disclosures also described a goal of greater forward / backward integration and additional wafer capacity. The economic payoff depends on commissioning discipline, customer qualification and utilisation rather than installed capacity alone
Key Drivers
Utilisation and yield improvement at existing manufacturing assets
Timely commissioning and commercialisation of new capacity
Backward / forward integration that reduces import dependence and improves margins
Power reliability, clean-room uptime and process-control discipline
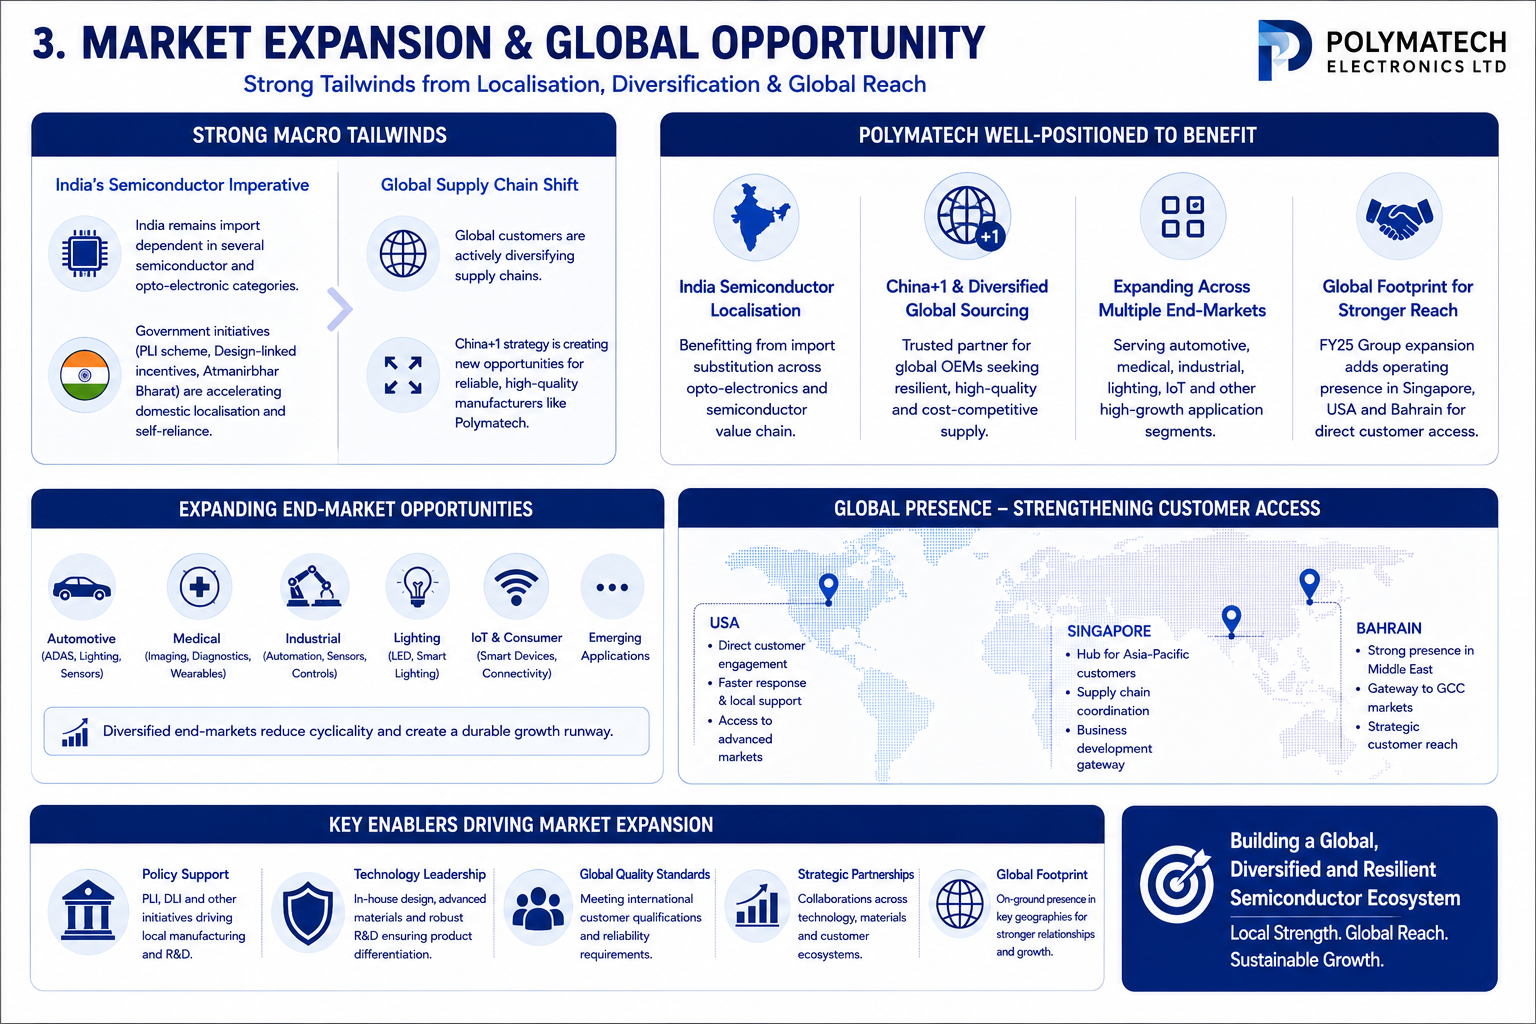
Global Market Penetration
India remains import dependent in several semiconductor and opto-electronic categories, while global customers are diversifying supply chains. Polymatech can potentially benefit from domestic localisation and China+1 strategies, and its FY25 group adds direct operating footprints in Singapore, the United States and Bahrain
Key Drivers
India semiconductor localisation and import substitution
China+1 and diversified global supply-chain sourcing
Expansion across automotive, medical, industrial, lighting and IoT end-markets
Cross-selling through Singapore, US and Middle East group entities
Underlying Industry Risks
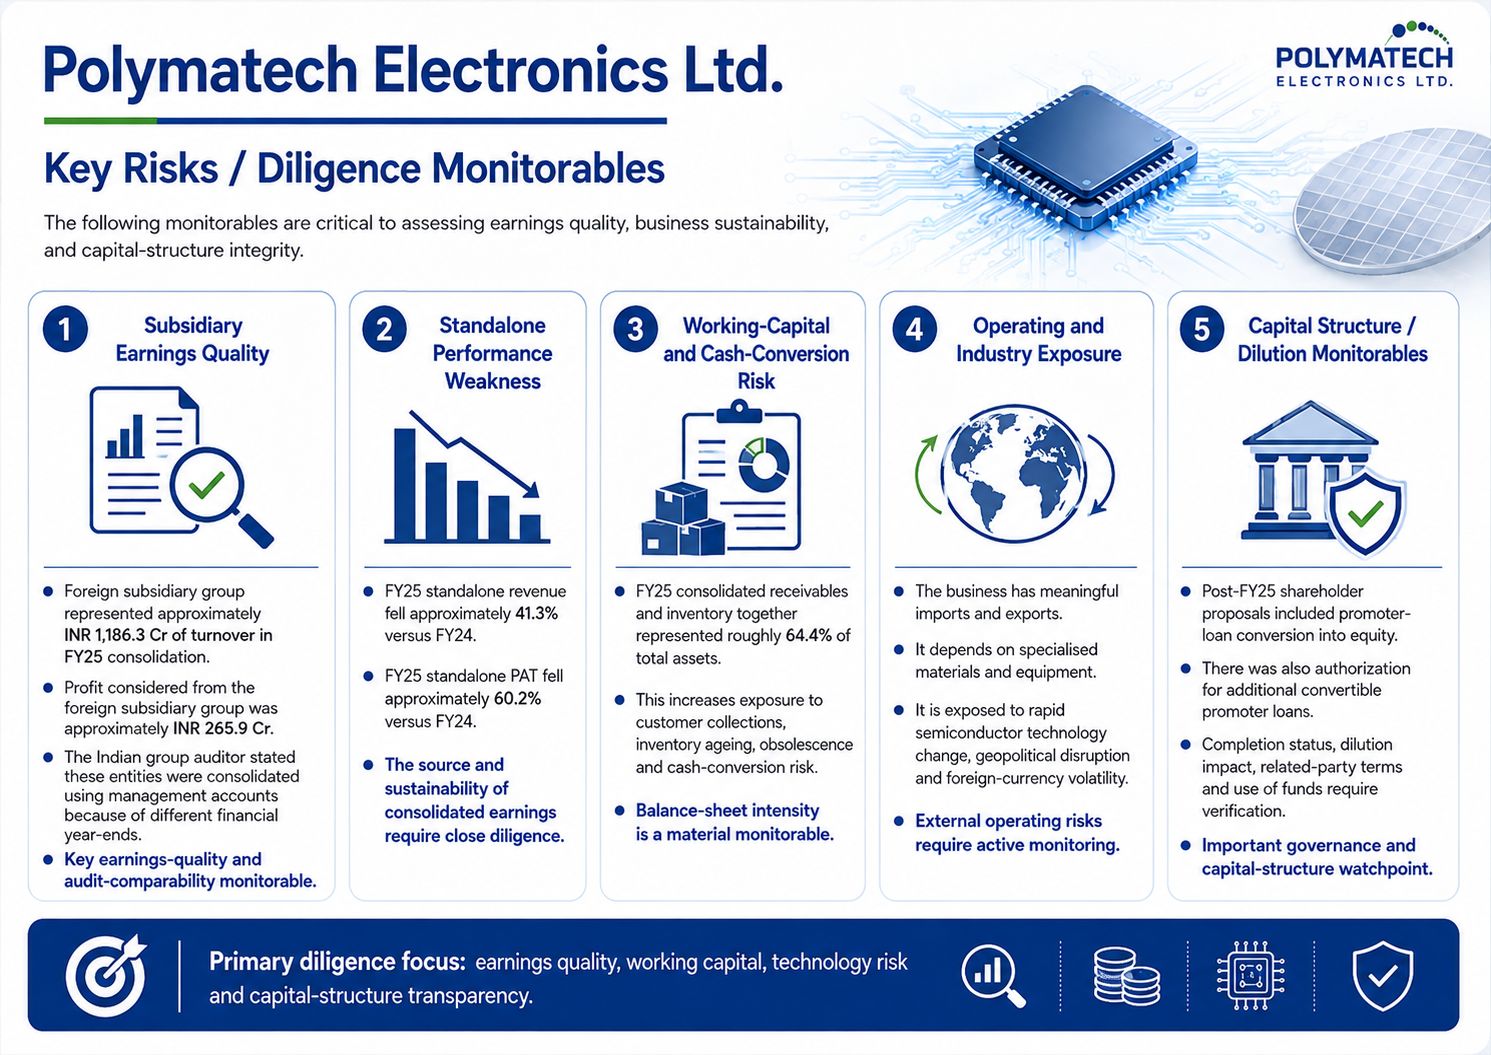
The foreign subsidiary group represented approximately INR 1,186.3 Cr of turnover and INR 265.9 Cr of profit considered in FY25 consolidation, but the Indian group auditor states those entities were consolidated using management accounts because of different financial year-ends
FY25 standalone revenue fell approximately 41.3% and PAT fell approximately 60.2% versus FY24, making the source and sustainability of consolidated earnings a core diligence issue
FY25 consolidated receivables and inventory together represented roughly 64.4% of total assets, increasing exposure to customer collections, inventory ageing, obsolescence and cash-conversion risk
The business has meaningful imports and exports, specialised materials and equipment requirements, and exposure to rapid semiconductor technology change, geopolitical disruption and foreign-currency volatility
Post-FY25 shareholder proposals included promoter-loan conversion into equity and authorisation for additional convertible promoter loans. Completion status, dilution, related-party terms and use of funds require verification
Government Policy Support
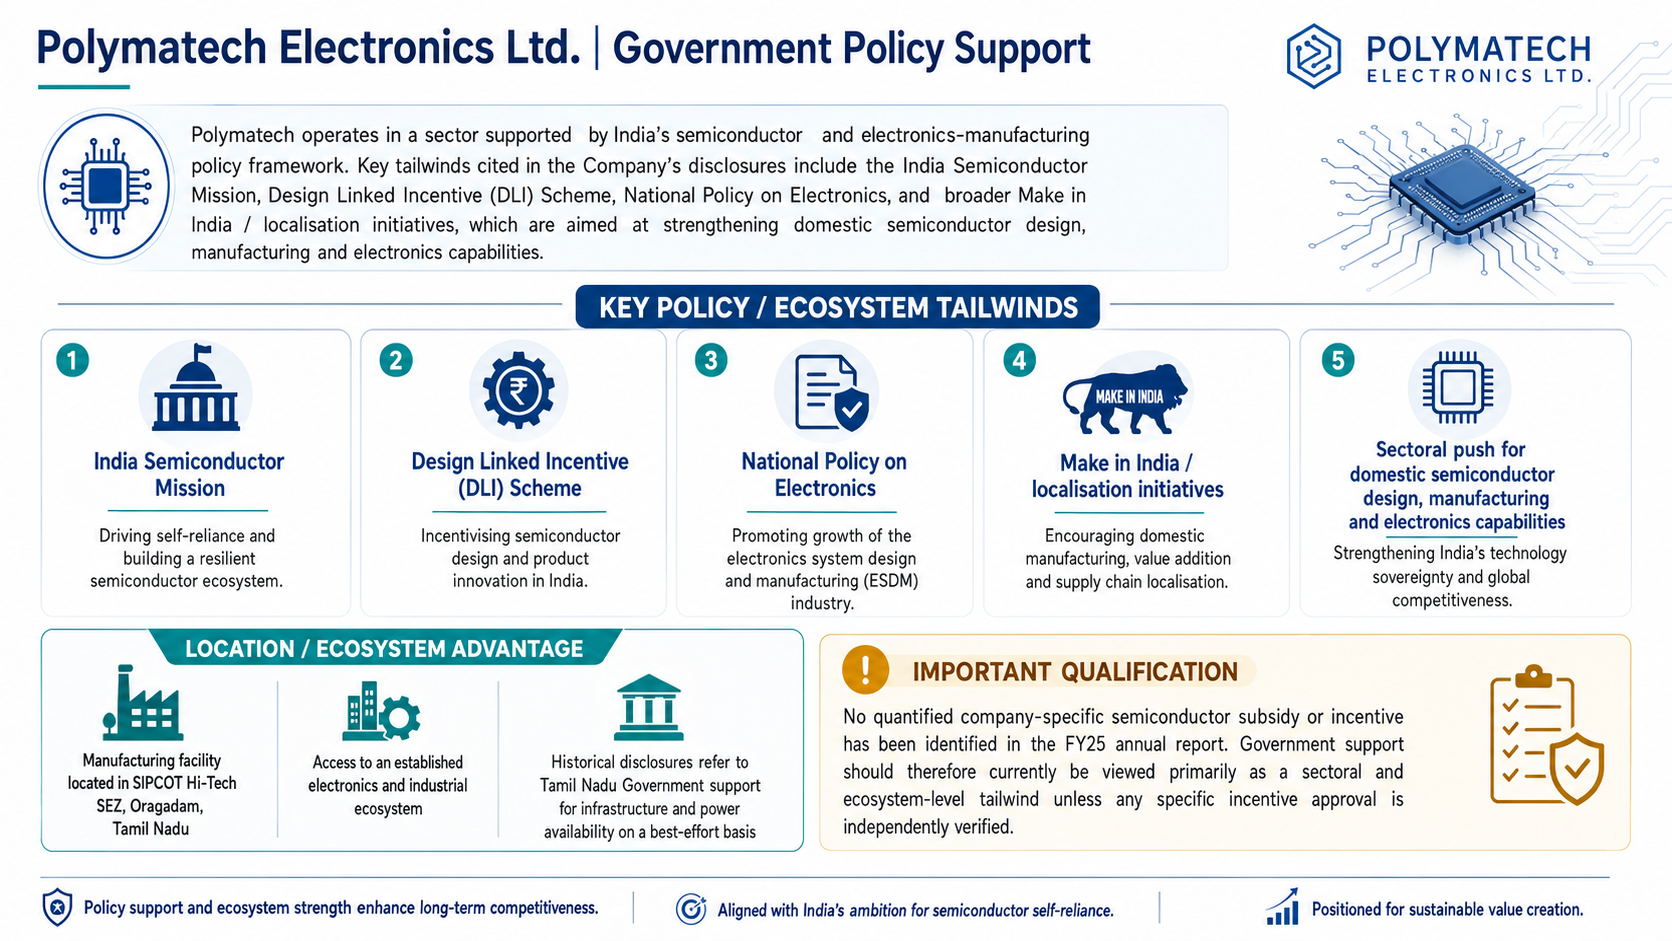
Polymatech operates in a sector supported by the Government of India’s semiconductor and electronics-manufacturing policy framework. Key tailwinds cited in the Company’s disclosures include the India Semiconductor Mission, Design Linked Incentive (DLI) Scheme, National Policy on Electronics, and broader Make in India / localisation initiatives, which are aimed at strengthening domestic semiconductor design, manufacturing and electronics capabilities.
The Company’s manufacturing facility is located in the SIPCOT Hi-Tech SEZ, Oragadam, Tamil Nadu, providing access to an established electronics and industrial ecosystem. Historical disclosures also refer to support from the Tamil Nadu Government for infrastructure and power availability on a best-effort basis.
However, no quantified company-specific semiconductor subsidy or incentive has been identified in the FY25 annual report. Accordingly, government support should currently be viewed primarily as a sectoral and ecosystem-level tailwind, unless any specific incentive approval is independently verified.
- Overview
- Business
- Financial Highlights
- Industry Overview
- Documentation
Get the Preqt App and keep in touch around the clock!
 Monitor your investments in real-time.
- Receive tailored deal suggestions.
- Get real-time updates and alerts.
