


Power Exchange India Ltd. (PXIL)
Creating Transparent Price Discovery
Unlisted Review and Rating
Speculative
DRHP Not FiledOverall Recommendation
PXIL has delivered excellent revenue growth, high margins, strong ROE, negligible debt and credible institutional governance. Market coupling could materially improve its ability to compete with IEX. Nevertheless, the implied valuation of 84.4x earnings, 37.9x sales, 24.8x book and at least 55x EBITDA assumes substantial future market-share gains. FY25 operating cash flow was negative, part of reported profitability comes from investment income, and unlisted-share liquidity remains limited. The Company becomes more attractive if market coupling produces measurable volume migration and earnings growth or if the entry valuation falls materially.
PARAMETER
WEIGHT
SCORE
KEY FACTORS
Financial Performance
25.0%
5.0/5
Strong revenue growth, margins, ROE and zero debt are tempered by volatile settlement-driven operating cash flow and investment income
Show more
Detailed Analysis
Operating revenue increased from INR 48.2 crore in FY23 to INR 77.0 crore in FY25, a strong 26.5% CAGR
Core EBITDA excluding other income was approximately INR34 crore, producing an excellent 44.1% operating margin
FY25 PAT of INR 34.5 crore represented a very strong 44.8% margin on operating revenue
The Company had no conventional borrowings; reported finance costs primarily represented lease-related obligations
PAT on average FY24-FY25 equity produced an excellent ROE of approximately 33.0%
Industry
25.0%
3.0/5
Rising exchange volumes and market coupling support growth, but IEX dominance, regulation and domestic concentration remain material constraints
Show more
Detailed Analysis
Indian power-exchange volumes increased 18.3% from 121.5 BU in FY24 to 143.8 BU in FY25
Products, transaction fees, ownership, price discovery and market coupling remain subject to extensive CERC oversight
PXIL facilitates power trading within India and presently has negligible direct exposure to global demand
Management
25.0%
4.0/5
Experienced institutional promoters, adequate board independence and limited litigation are offset by RPTs slightly above the lowest-risk band.
Show more
Detailed Analysis
NSE Investments and NCDEX provide several decades of institutional experience in regulated exchange operations and market infrastructure
Four of ten directors were independent as of March 2025, representing 40.0% of the Board
Total disclosed RPTs were approximately INR 3.9 crore, marginally exceeding 5.0% of FY25 operating revenue
Valuation Metrics
25.0%
2.0/5
PXIL’s extreme P/E, EV/EBITDA, P/S and P/B multiples outweigh the benefit of trading near its yearly low.
Show more
Detailed Analysis
The supplied 84.4x P/E represents a 24.9% premium to the supplied industry multiple of 67.6x
PXIL’s estimated 55–86x EV/EBITDA materially exceeds IEX’s current multiple of approximately 13.6x
The P/B Ratio is 24.9
TOTAL
100%
3.5/5
Weighted Composite Score
Per Share Price
₹509.0
As of 14 Oct 2026
Lot Size
100.0 Shares
Minimum Investment
₹50,900.0 / 100 shares
Market Cap. (₹ Cr)
Revenue FY’25
PAT FY’25
P/E Multiple
Face Value
₹ 10.0Lot Size
100.0 sharesSale Type
Secondary SalePAT FY’25
₹ 34.5 CrPAT Margin (%)
44.8 %P/E Multiple
84.4xCAGR Growth 3Y
26.5 %ROE (FY’25)
33.0 %Price to Book Value ratio
24.8xDebt/Equity (FY’25)
0.0xMerchant banker appointed
❌ NoCompany Website
www.powerexindia.inDisclaimer: Unlisted shares are unregulated & illiquid. This is NOT investment advice. Please do your own due diligence before investing.
Minimum Investment
₹50,900.0 / 100 sharesShares Lot 100 X 1
Investment amount
₹50,900.0
Overview
Business
Business Model
Geographical Presence
Sales Channel
Financial Highlights
Income Statement
Revenue growth with EBITDA and PAT margins
| Financial Metric | FY 2023 | FY 2024 | FY 2025 |
|---|---|---|---|
| Revenue (₹ Cr) | 48.2 | 54.2 | 77.1 |
| Growth (%) | 36.7% | 12.6% | 42.2% |
| EBITDA (₹ Cr) | 25.3 | 24.4 | 34.0 |
| EBITDA Margin (%) | 52.6% | 45.1% | 44.1% |
| PAT (₹ Cr) | 21.6 | 22.1 | 34.5 |
| PAT Margin (%) | 44.9% | 40.8% | 44.8% |
OBSERVATIONS & INSIGHTS
Operating revenue increased 42.2% in FY25 and delivered a 26.5% two-year CAGR from FY23
EBITDA rose 39.1% to ₹34.0 Cr, although margin eased to 44.1% because operating expenses grew with the larger platform and product base
PAT increased 56.3% to ₹34.5 Cr and PAT margin recovered to 44.8%, supported by higher operating profit and treasury income
Other income was ₹15.9 Cr in FY25, making the quality and sustainability of investment income an important part of earnings analysis
Balance Sheet
| Financial Metric | FY 2023 | FY 2024 | FY 2025 |
|---|---|---|---|
| EQUITY & LIABILITIES | ₹ 174.0 Cr | ₹ 339.6 Cr | ₹ 326.6 Cr |
| Net Worth | ₹ 69.9 Cr | ₹ 91.9 Cr | ₹ 117.7 Cr |
| Share Capital | ₹ 58.5 Cr | ₹ 58.5 Cr | ₹ 58.5 Cr |
| Reserves & Surplus | ₹ 11.4 Cr | ₹ 33.4 Cr | ₹ 59.2 Cr |
| Total Liabilities | ₹ 104.1 Cr | ₹ 247.7 Cr | ₹ 208.9 Cr |
| Current Liabilities | ₹ 102.1 Cr | ₹ 244.1 Cr | ₹ 203.2 Cr |
| Borrowings | ₹ 0.0 Cr | ₹ 0.0 Cr | ₹ 0.0 Cr |
| Trade Payables | ₹ 2.9 Cr | ₹ 9.0 Cr | ₹ 6.2 Cr |
| Other Current Liabilities | ₹ 99.2 Cr | ₹ 235.1 Cr | ₹ 197.0 Cr |
| Non-Current Liabilities | ₹ 2.0 Cr | ₹ 3.6 Cr | ₹ 5.7 Cr |
| Borrowings | ₹ 0.0 Cr | ₹ 0.0 Cr | ₹ 0.0 Cr |
| Other Non-Current Liabilities | ₹ 2.0 Cr | ₹ 3.6 Cr | ₹ 5.7 Cr |
| ASSETS | ₹ 173.9 Cr | ₹ 339.5 Cr | ₹ 326.5 Cr |
| Current Assets | ₹ 154.5 Cr | ₹ 310.4 Cr | ₹ 304.0 Cr |
| Trade Receivables | ₹ 0.1 Cr | ₹ 0.0 Cr | ₹ 0.1 Cr |
| Inventory | ₹ 0.0 Cr | ₹ 0.0 Cr | ₹ 0.0 Cr |
| Cash & Cash Equivalents | ₹ 41.9 Cr | ₹ 198.7 Cr | ₹ 159.0 Cr |
| Other Current Assets | ₹ 112.5 Cr | ₹ 111.7 Cr | ₹ 144.9 Cr |
| Non-Current Assets | ₹ 19.4 Cr | ₹ 29.1 Cr | ₹ 22.5 Cr |
| Fixed Assets | ₹ 5.7 Cr | ₹ 6.9 Cr | ₹ 8.3 Cr |
| Other Non-Current Assets | ₹ 13.7 Cr | ₹ 22.2 Cr | ₹ 14.2 Cr |
OBSERVATIONS & INSIGHTS
Shareholders' wealth rose from ₹69.9 Cr in FY23 to ₹117.6 Cr in FY25 as retained earnings accumulated after dividends
The Company reported no current or non-current financial borrowings across the three years
Other current liabilities remained the largest liability bucket because member deposits and exchange-settlement balances form part of normal operations
Fixed assets were only ₹8.3 Cr in FY25, while liquid and settlement-related current assets represented most of the balance sheet
Cash Flow
| Financial Metric | FY 2023 | FY 2024 | FY 2025 |
|---|---|---|---|
CFO (₹ Cr) Cash generated from core business operations. | -37.1 Cr | +164.8 Cr | -16.5 Cr |
CFI (₹ Cr) Cash used for investments and long-term assets. | -19.5 Cr | -7.0 Cr | -13.2 Cr |
CFF (₹ Cr) Cash flow related to funding and borrowings. | -0.9 Cr | -1.0 Cr | -9.9 Cr |
Financial Ratios
Measures the company’s leverage relative to shareholder equity.
OBSERVATIONS & INSIGHTS
FY25 ROE reached 33.0% and analytical ROCE reached 44.9%, reflecting the asset-light exchange model
Debt / equity remained 0.0x and interest coverage exceeded 60.0x in every year
Large member deposits, settlement obligations, cash and bank balances move with exchange operations and can distort conventional working-capital interpretation
ROA and ROCE declined in FY24 when settlement-related assets expanded sharply, then recovered in FY25 as balances normalised and profit grew
Industry Overview
Industry Drivers
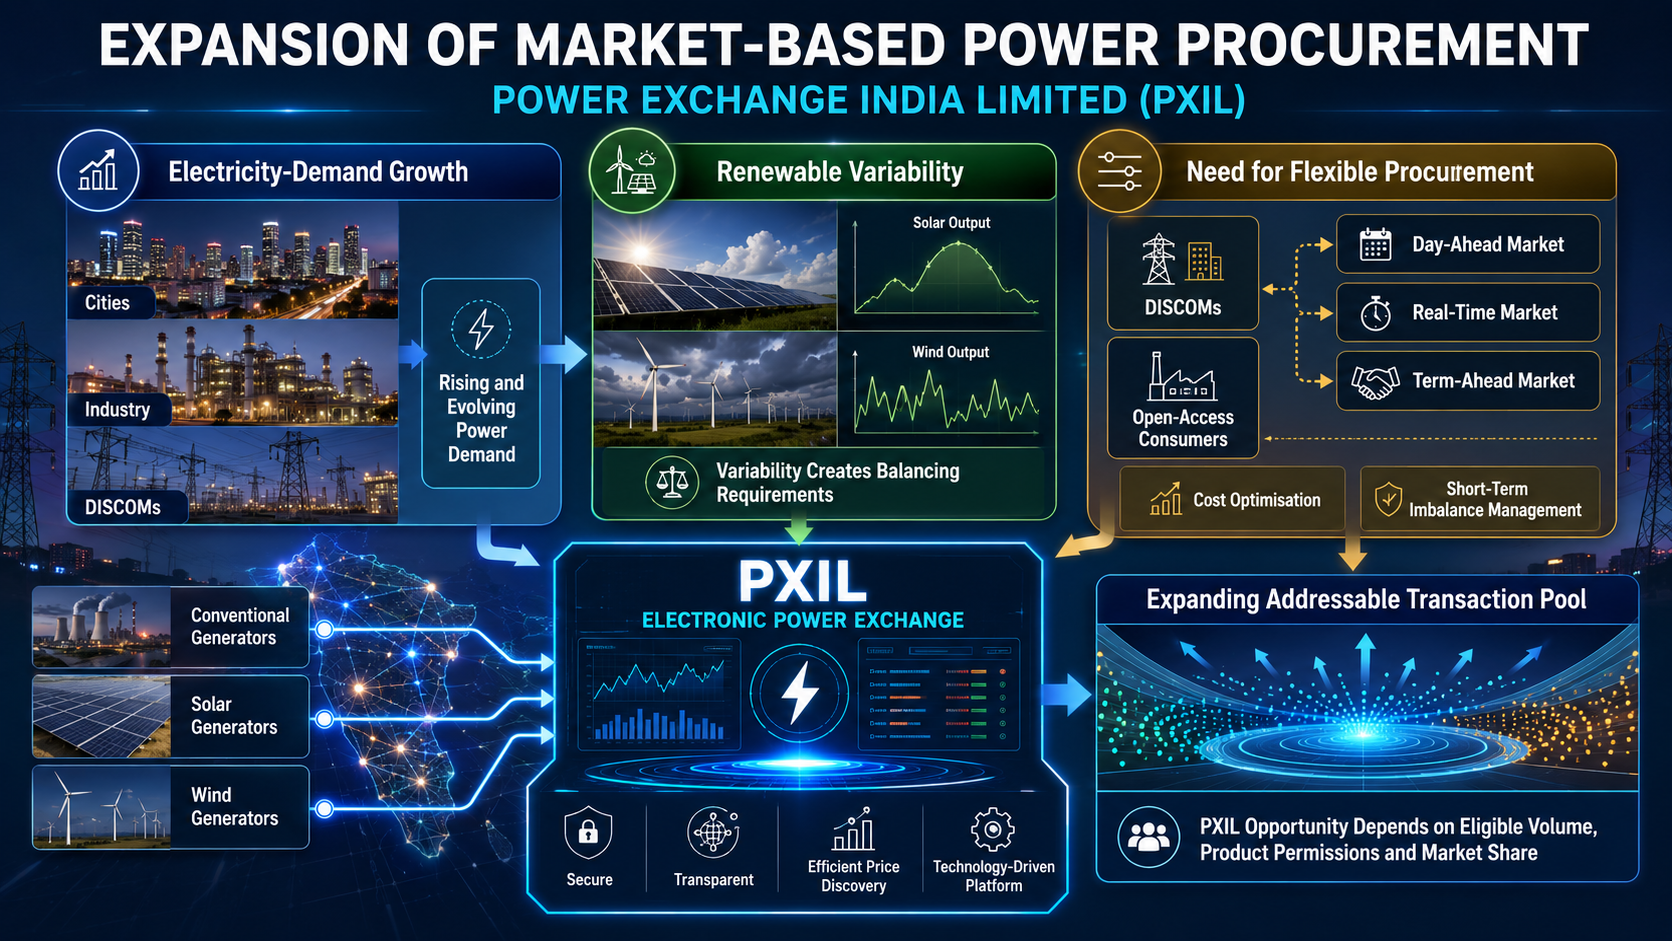
Expansion of Market-Based Power Procurement
Electricity demand growth, renewable variability and the need for flexible procurement can increase the share of power traded through exchanges
Distribution companies and open-access consumers can use day-ahead, real-time and term-ahead markets to optimise cost and manage short-term imbalances, expanding the addressable transaction pool for PXIL
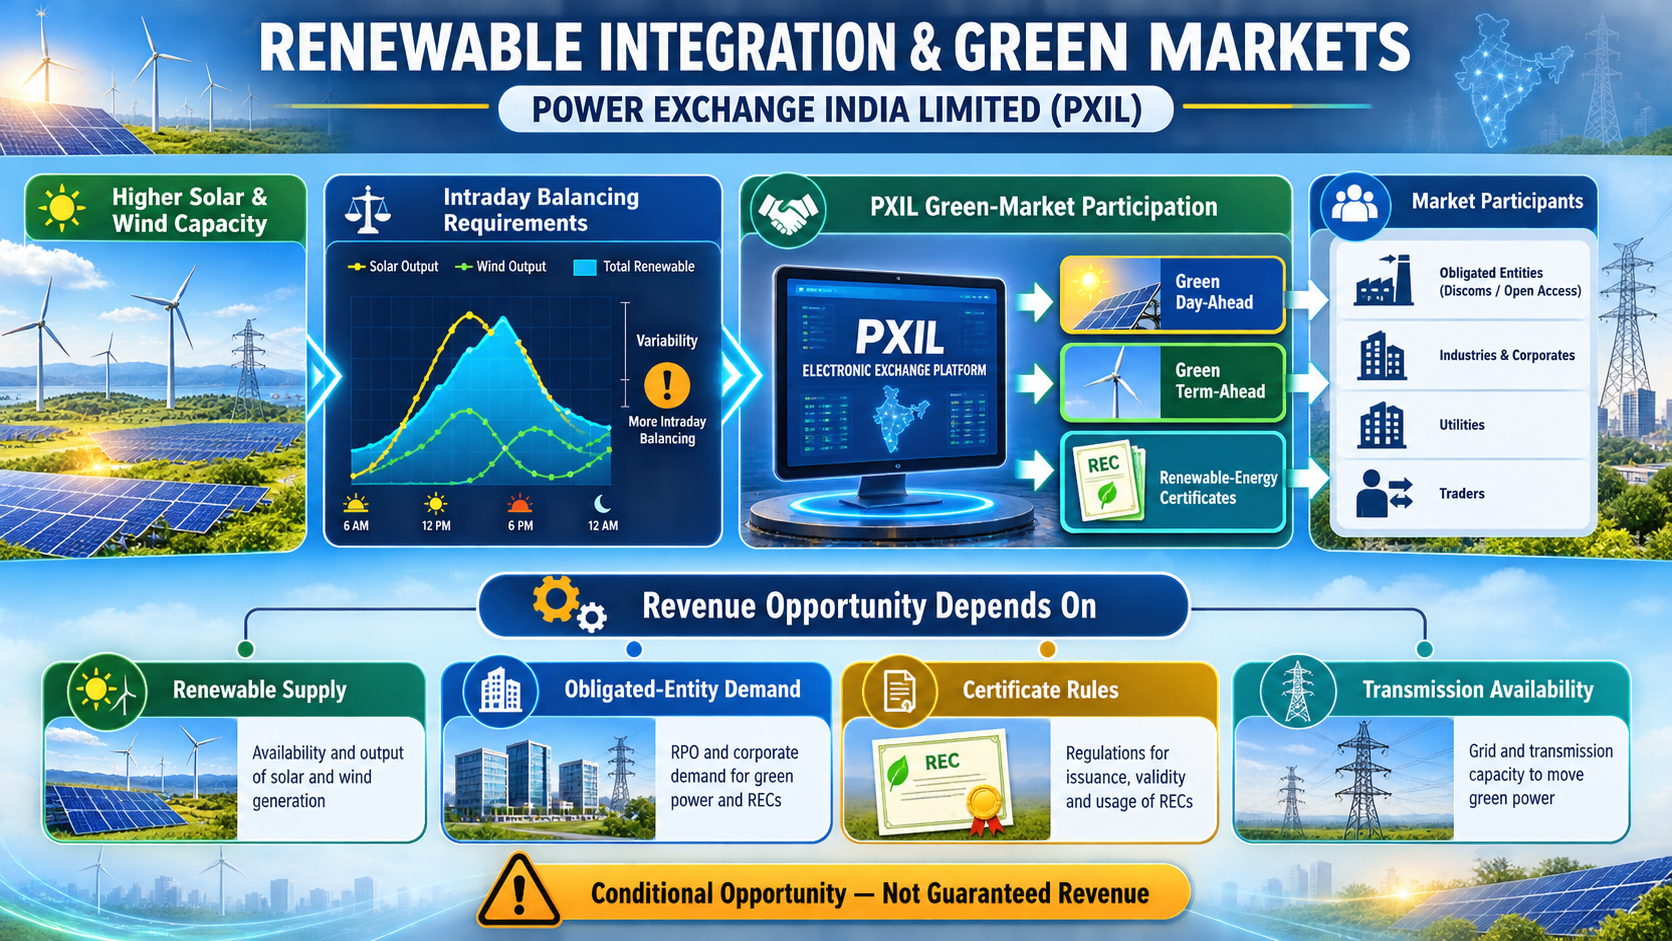
Renewable Integration and Green Markets
Higher solar and wind capacity increases the need for intraday balancing, green contracts and renewable-energy certificates
PXIL can benefit through green day-ahead, green term-ahead and REC participation, although revenue depends on renewable supply, obligated-entity demand, certificate rules and transmission availability
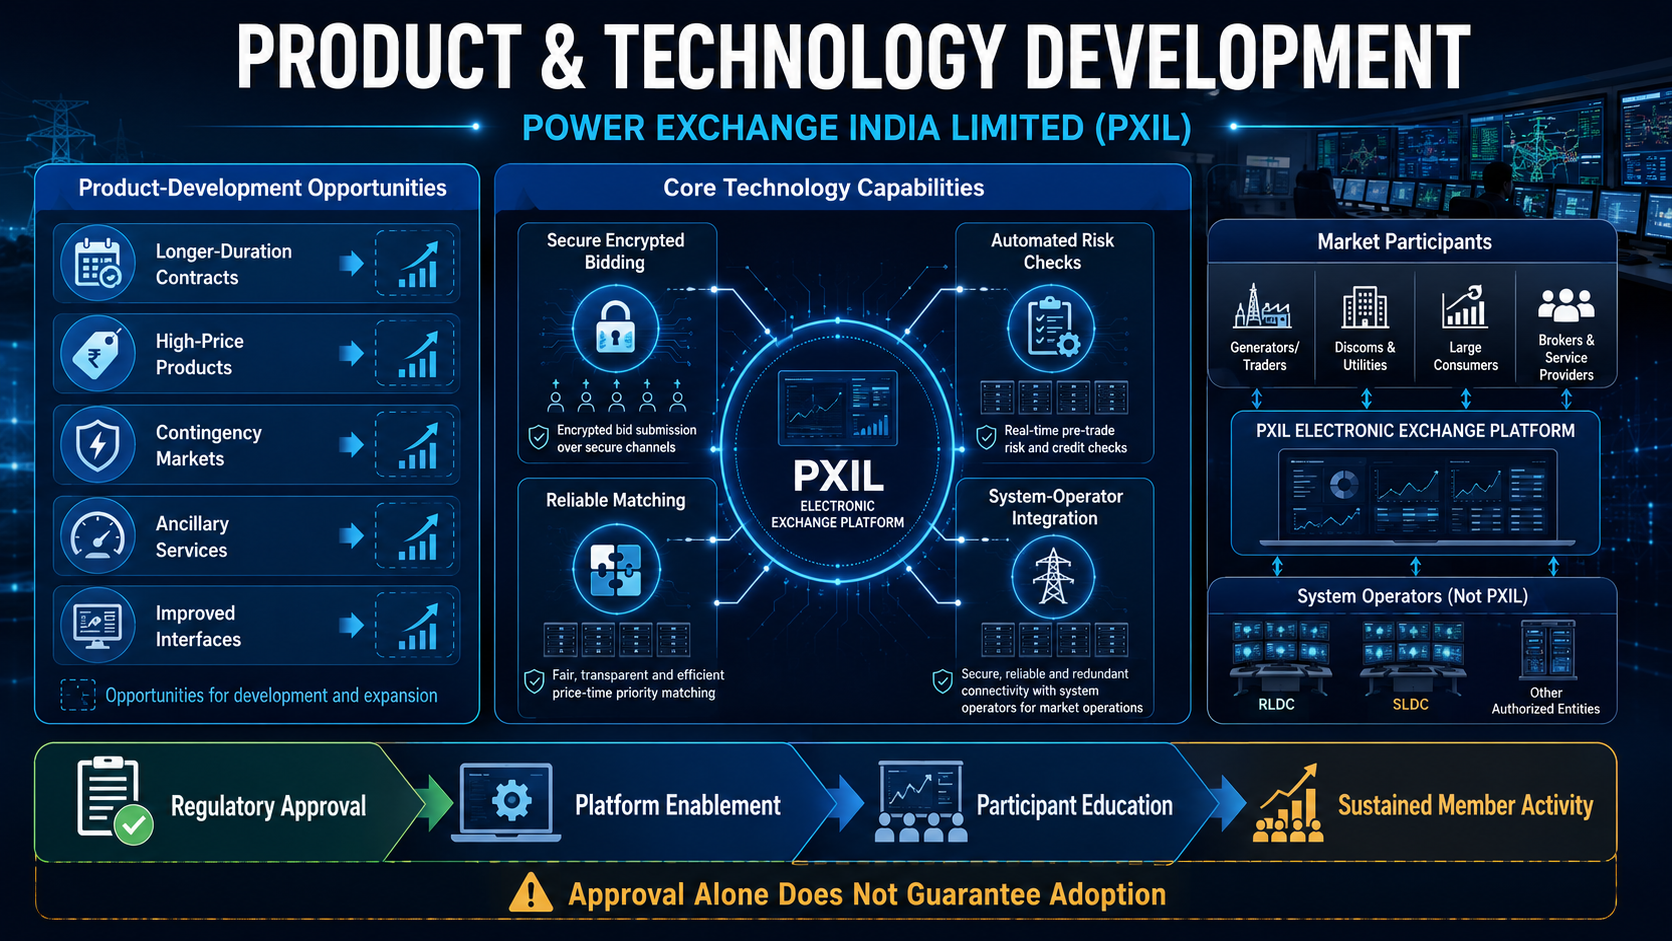
Product and Technology Development
Longer-duration contracts, high-price products, contingency markets, ancillary services and improved interfaces can deepen exchange usage
Secure encrypted bidding, automated risk checks, reliable matching and robust system-operator integration are necessary to convert product approvals into sustained member activity
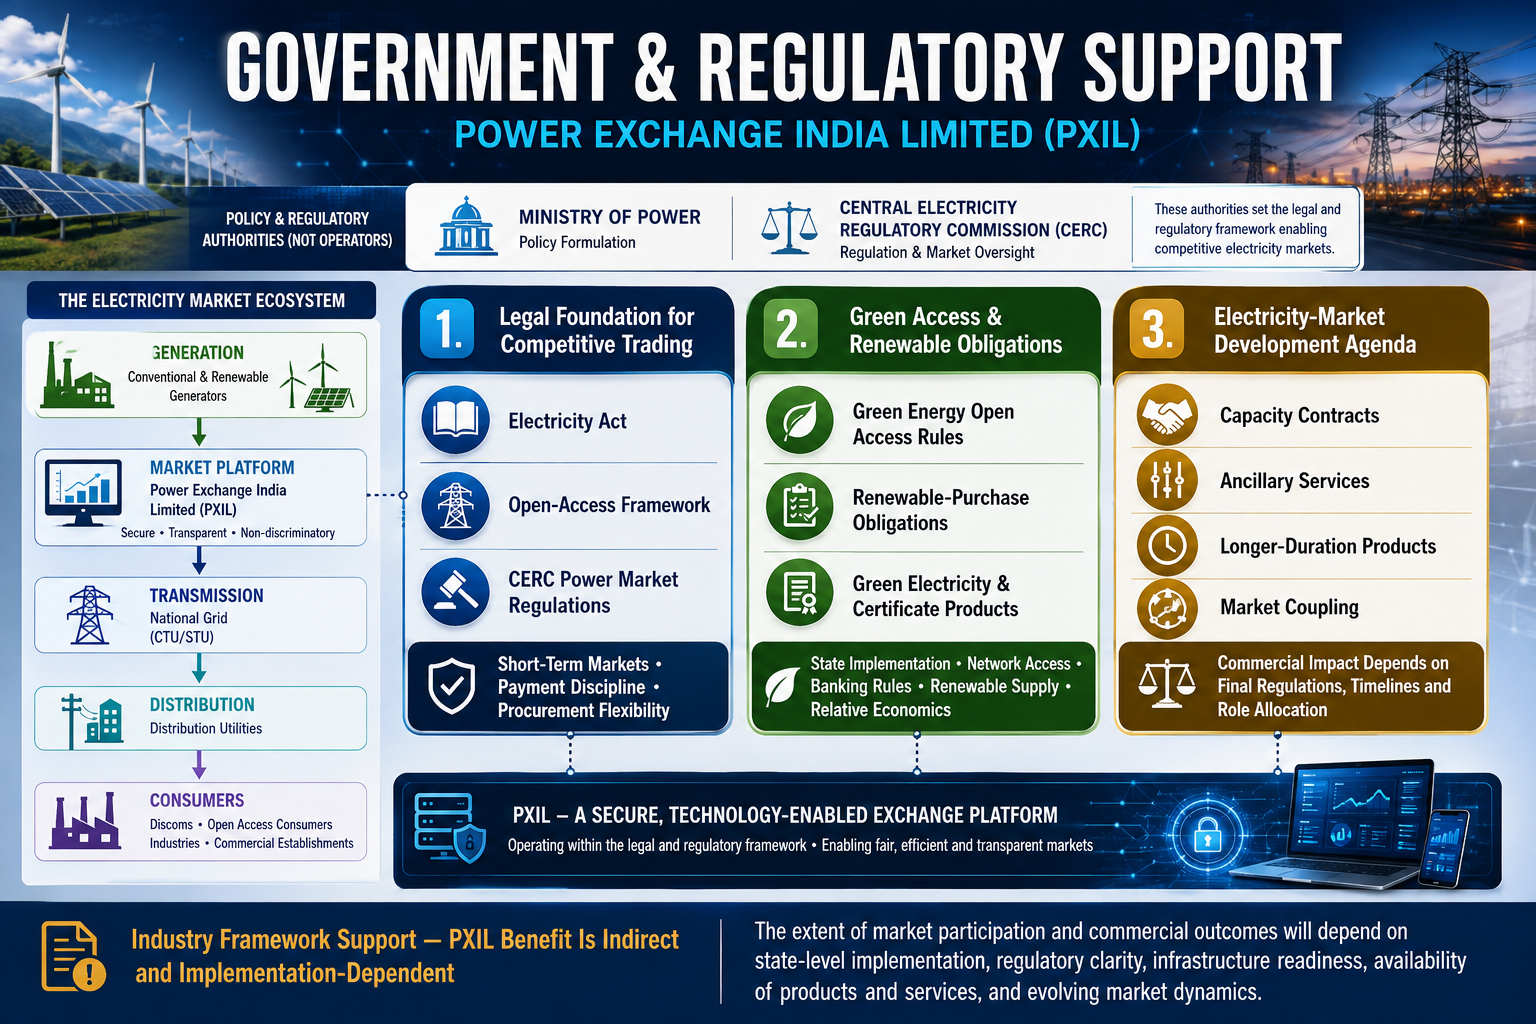
Government Policy Support
The Electricity Act, open-access framework and CERC Power Market Regulations provide the legal foundation for competitive electricity trading. Government efforts to deepen short-term markets, improve payment discipline and increase procurement flexibility can raise the share of demand served through exchanges
Green Energy Open Access rules and renewable-purchase obligations support participation in green electricity and certificate products. The benefit to PXIL depends on state implementation, network access, banking rules, renewable supply and the relative economics of exchange procurement versus bilateral contracts
The Ministry of Power's electricity-market development agenda considers capacity contracts, ancillary services, longer-duration products and market coupling. These reforms can expand the range of exchange-enabled services, but their commercial effect depends on final regulations, implementation timelines and the allocation of roles among exchanges, system operators and market participants
- Overview
- Business
- Financial Highlights
- Industry Overview
- Documentation
Get the Preqt App and keep in touch around the clock!
 Monitor your investments in real-time.
- Receive tailored deal suggestions.
- Get real-time updates and alerts.
