
SFC Environmental Technologies
Engineering Cleaner WaterTechnology for Water
IPO Summary (PrEqT)
SFC Environmental Technologies Limited is a technology-focused provider of wastewater treatment, advanced recycling and solid-waste processing solutions. Its proprietary C-Tech treatment platform underpins an established project portfolio, with over 80.0% market share of the SBR technology segment in India according to the commissioned industry study. FY26 revenue rose 15.2% to INR 803.6 Cr and operating EBITDA reached INR 235.8 Cr at a 29.3% margin, but PAT growth was only 5.4% and operating cash flow turned negative INR 25.8 Cr as trade receivables and working capital rose. The company entered the wastewater recycling and reuse vertical in FY26, and the order book reached INR 1,574.5 Cr at March 2026. At ₹330, the post-issue equity value is INR 3,232.6 Cr, or 20.2x FY26 PAT and approximately 13.9x EV to reported operating EBITDA. The Company has strong financials, but flags weak revenue-to-cash conversion, acquisition-linked goodwill and sizeable execution exposure as important diligence points.
IPO Review Rating
Above Avg
MainboardBuilding Sustainable Water Infrastructure Through Innovative Treatment Technologies
SFC Environmental Technologies presents a strong fundamental IPO proposition, primarily because of its market leadership and valuation. The company has an estimated over 80% share in Indian SBR technology, FY26 EBITDA margin of 29.3%, FY26 PAT of INR 160.2 Cr, low leverage, and an order book of INR 1,574.5 Cr, nearly 2.0x FY26 revenue. At 20.2x FY26 P/E and 13.9x EV/EBITDA, its valuation is also substantially below listed peers despite stronger operating margins.
The risks are meaningful and should not be ignored. Operating cash flow has been negative in two of the last three years, the cash-conversion cycle is lengthy, the top 10 customers account for 64.4% of FY26 revenue, and subsidiary-level litigation totals around INR 69.3 Cr. The historical World Bank debarment of the Austrian subsidiary is also a governance negative. Further, 77.5% of the IPO is OFS.
Overall, however, the valuation discount, technology leadership, profitability and strong order book outweigh these concerns at the current price band.
PARAMETER
WEIGHT
SCORE
KEY FACTORS
Financial Performance
40.0%
4.0/5
SFC combines healthy double-digit revenue growth with unusually strong and stable EBITDA margins of around 29%. Low leverage and a sizeable order book are positives, although declining ROE, high working-capital intensity and inconsistent operating cash flows warrant caution.
Show more
Detailed Analysis
Revenue increased from INR 657.5 Cr in FY24 to INR 697.9 Cr in FY25 and INR 803.6 Cr in FY26. FY26 growth was 15.2%, while the FY24 to FY26 CAGR was 10.6%
Operating EBITDA increased from INR 193.3 Cr to INR 235.8 Cr between FY24 and FY26. Margins remained stable at 29.4%, 29.7% and 29.3%, materially above listed peers
PAT increased from INR 144.2 Cr in FY24 to INR 160.2 Cr in FY26, but PAT margin declined from 21.9% to 19.9%, indicating some moderation in earnings conversion
FY26 total Debt/Equity was only 0.2x, although it increased from 0.1x in FY25
ROE remains healthy at 21.6% in FY26, but has declined from 29.8% in FY24 and 24.8% in FY25. The return profile remains better than several listed peers
Operating cash flow was negative INR 11.7 Cr in FY24, positive INR 65.5 Cr in FY25 and negative INR 25.8 Cr in FY26. This is the largest weakness in financial quality
Top 10 customers generated 64.4% of FY26 revenue, while the top 5 contributed 47.1%. Only a small portion of top-customer revenue is covered by long-term contracts
Industry
15.0%
3.0/5
SFC operates in a structurally attractive environmental-infrastructure market supported by wastewater-treatment deficits, urbanisation and stricter regulation. Its more than 80% estimated share within Indian SBR technology and expanding tertiary-treatment opportunity provide a particularly strong competitive position.
Show more
Detailed Analysis
India's wastewater-treatment market is expected to increase from INR 292.0 Bn in FY26 to INR 455.0 Bn by FY31, representing a 9.3% CAGR
Wastewater treatment remains structurally underpenetrated because sewage generation materially exceeds treatment capacity. Urbanisation, environmental regulations, recycling requirements and municipal infrastructure spending provide a long growth runway
SFC has 728 commissioned C-Tech installations and Frost & Sullivan estimates that it holds over 80% share of India's SBR technology market, providing a significant technology moat
Stricter wastewater-discharge norms and government sewage infrastructure programmes are strong demand drivers. However, dependence on municipal/EPC projects, tendering and regulatory compliance creates execution risk
SFC has installations across 23 states and five UTs, plus international projects, but only about 4.7% of FY26 revenue came from outside India
Management
15.0%
4.0/5
Management depth and promoter experience are strong, with 50% Board independence and no promoter pledge. Governance quality is reduced by significant subsidiary litigation, historical multilateral-bank debarment and promoter dilution through the OFS, despite otherwise manageable related-party exposure.
Show more
Detailed Analysis
CMD Sandeep Asolkar has over 31 years of environmental-engineering experience, including prior roles at Ion Exchange and Hindustan Dorr-Oliver. CEO Mandar Desai also has extensive sector experience
Four of eight Directors are Independent Directors, giving 50.0% Board independence, including three women Independent Directors
No promoter shares are pledged. However, subsidiaries face 2 criminal, 5 tax, 10 regulatory and 2 material civil proceedings, with quantified exposure of about INR 69.3 Cr
External RPT exposure appears relatively contained. For example, the FY26 transaction with associate Turbomax of INR 12.3 Cr represented 1.5% of revenue. Multiple intra-group dealings also exist
Promoters hold 42.8% pre-IPO. After the promoter OFS, calculated promoter ownership falls to approximately 36.1%, or approximately 41.2% including the promoter group
Valuation
20.0%
4.0/5
Valuation is one of SFC's strongest features. At 20.0x FY26 P/E and 13.9x EV/EBITDA, it trades at meaningful discounts to listed peers despite materially higher operating margins and RoNW, although P/B remains moderately demanding.
Show more
Detailed Analysis
At 20.2x FY26 earnings, SFC is priced at a substantial discount to Ion Exchange at 31.3x and Thermax at 52.0x. Even allowing for its smaller scale, the valuation looks attractive
SFC's 13.9x EV/EBITDA is materially below Ion Exchange at 19.9x and Thermax at 35.5x. The discount is significant despite SFC's superior FY26 EBITDA margin
Approximate post-issue P/B is 3.4x
Only 22.5% of the issue is fresh capital, but the fresh proceeds have productive uses in debt repayment and working capital
Merchant Banker Track Record
10.0%
4.0/5
Show more
Detailed Analysis
Across available completed 30-day observations, IIFL recorded approximately 69.5% positive outcomes, JM Financial 58.2%, and Nuvama 51.7%, resulting in an overall combined positive rate of approximately 61.5%
IIFL's historical performance is relatively strong, while JM Financial and Nuvama show more mixed post-listing outcomes. The syndicate therefore has good execution credentials
IIFL Capital, JM Financial and Nuvama are established Mainboard investment banks with extensive QIB, HNI and institutional placement capabilities and experience executing sizeable Indian equity offerings
TOTAL
100%
3.9/5
Weighted Composite Score
Issue Price
₹313.0 to ₹330.0
As of 24 Oct 2026
GMP
₹21.0
As of 24 Oct 2026
Estimated Gain / Loss
+6.4%
Lot Size
45.0 Shares
Grey Market Premium (GMPs) are shared for knowledge purpose only. PrEqt doesn’t promote or execute the trades.
| Issue size | |
|---|---|
| Overall | ₹668.0 Cr |
| Fresh Issue | ₹150.0 Cr |
| Offer for Sale | ₹518.0 Cr |
Minimum Investment
₹14,850.0 / 45 shares

Merchant Banker
IIFL Capital Services Ltd., JM Financial, Nuvama Wealth Management
IIFL Capital Services Ltd.
JM Financial
Nuvama Wealth Management
IPO Document
Offer Start Date
Offer End Date
Valuation
Revenue (FY'26)
PAT (FY'26)
Issue Size
Face Value
₹ 2.0Offer Price
₹ 330.0Lot Size
45.0 sharesSale Type
Fresh capital cum OFSPAT (FY'26)
₹ 160.2 CrPAT Margin (FY'26)
19.9 %P/E Multiple
20.2xEBITDA (FY'26)
₹ 235.8 CrCAGR Growth 2Y
10.6 %ROE (FY'26)
21.6 %ROCE (FY'26)
22.2 %Price to Book Value
3.4xDebt/Equity
0.2xCompany Website
www.sfcenvironment.comExplore new deals
Overview
Fund Allocation
Total: ₹0 CrSource:Company DRHP
Timeline
IPO Open Date
To Be Announced
IPO Close Date
To Be Announced
Tentative Allotment
To Be Announced
Initiation of Refunds
To Be Announced
Credit of Shares to Demat
To Be Announced
Tentative Listing Date
To Be Announced
Business
Business Model
Sales Channel
Key Risk Factors
Financial Highlights
Income Statement
Revenue growth with EBITDA and PAT margins
| Financial Metric | FY 2024 | FY 2025 | FY 2026 |
|---|---|---|---|
| Revenue (₹ Cr) | 657.5 | 697.9 | 803.6 |
| Growth (%) | - | 6.1% | 15.2% |
| EBITDA (₹ Cr) | 193.3 | 207.5 | 235.8 |
| EBITDA Margin (%) | 29.4% | 29.7% | 29.3% |
| PAT (₹ Cr) | 144.2 | 152.0 | 160.2 |
| PAT Margin (%) | 21.9% | 21.8% | 19.9% |
OBSERVATIONS & INSIGHTS
Revenue from operations rose from INR 657.5 Cr in FY24 to INR 697.9 Cr in FY25 and INR 803.6 Cr in FY26. FY25 growth of 6.1% was driven primarily by a 94.1% increase in service sales to INR 188.6 Cr and higher other operating revenue, which offset a 10.0% decline in goods sales to INR 492.5 Cr. FY26 growth accelerated to 15.2% as goods sales recovered 10.7% to INR 545.2 Cr and services rose 28.3% to INR 242.0 Cr, with other operating revenue broadly flat. By segment, WWT rebounded from INR 469.2 Cr to INR 542.8 Cr in FY26, SWT expanded from INR 119.4 Cr to INR 140.2 Cr, and the newly operational WRR vertical added INR 14.2 Cr. The movement therefore reflects changing contract mix, stronger project/service execution and the new reuse business, rather than uniform increases in each operating activity
EBITDA increased from INR 193.3 Cr in FY24 to INR 207.5 Cr in FY25 and INR 235.8 Cr in FY26, supported by higher services and project volumes. The margin first improved from 29.4% to 29.7%, but eased to 29.3% in FY26 as project costs jumped from INR 28.7 Cr to INR 76.0 Cr, partly offsetting revenue growth. The margin movement is not evidence of a broad unit-cost reduction
PAT increased from INR 144.2 Cr in FY24 to INR 152.0 Cr in FY25 and INR 160.2 Cr in FY26. However, its growth of 5.4% in FY26 lagged 15.2% revenue growth, as rising project expenditure, wages, D&A and finance costs absorbed operating gains. PAT margin declined from 21.9% in FY24 to 19.9% in FY26; the improvement in rupee earnings should therefore not be confused with improving net margins
Balance Sheet
| Financial Metric | FY 2024 | FY 2025 | FY 2026 |
|---|---|---|---|
| Net Worth | ₹ 534.3 Cr | ₹ 648.7 Cr | ₹ 804.2 Cr |
| Total Assets | ₹ 904.9 Cr | ₹ 999.5 Cr | ₹ 1,323.4 Cr |
| Total Borrowing | ₹ 139.2 Cr | ₹ 83.7 Cr | ₹ 195.6 Cr |
| Reserves & Surplus | ₹ 526.4 Cr | ₹ 628.5 Cr | ₹ 782.6 Cr |
OBSERVATIONS & INSIGHTS
Assets rose from INR 904.9 Cr in FY24 to INR 999.5 Cr in FY25 and INR 1,323.4 Cr in FY26, with FY26 expansion concentrated in current receivables, inventory, other assets and acquisition-related goodwill. Goodwill increased from INR 2.8 Cr to INR 30.3 Cr, so future impairment depends on performance of the relevant acquired business
Net Worth increased from INR 534.3 Cr in FY24 to INR 648.7 Cr in FY25 and INR 804.2 Cr in FY26, primarily consistent with accumulated profitability
Borrowings declined from INR 139.2 Cr in FY24 to INR 83.7 Cr in FY25 but rose to INR 195.6 Cr in FY26, reflecting a large increase in current financing
Cash Flow
| Financial Metric | FY 2024 | FY 2025 | FY 2026 |
|---|---|---|---|
CFO in Cr Cash used in / generated from investing activities. | -11.7 Cr | +65.5 Cr | -25.8 Cr |
CFI in Cr Cash from / used in financing activities. | -77.2 Cr | +70.8 Cr | -66.5 Cr |
CFF in Cr Cash generated from core business operations. | +72.1 Cr | -106.5 Cr | +92.5 Cr |
Working Capital
| Efficiency Metric | FY 2023 | FY 2024 | FY 2025 |
|---|---|---|---|
Debtor Days Average number of days taken to collect customer payments. | - | - | - |
Creditor Days Average time taken to pay suppliers and vendors. | - | - | - |
Inventory Days Average number of days inventory remains unsold. | - | - | - |
CCC (Cash Conversion Cycle) (Debtor Days + Inventory Days - Creditor Days) | - | - | - |
Financial Ratios
Measures the company’s leverage relative to shareholder equity.
OBSERVATIONS & INSIGHTS
ROE declined from 29.8% in FY24 to 24.8% in FY25 and 21.6% in FY26. Average equity grew faster than PAT, meaning the larger capital base was not matched by a proportionate improvement in accounting profitability
ROCE improved slightly from 28.6% in FY24 to 29.3% in FY25 but fell to 22.2% in FY26. The larger capital base, expansion and borrowings increased capital employed faster than operating returns
Current ratio improved from 2.5x in FY24 to 3.3x in FY25 when current liabilities declined, then reverted to 2.5x in FY26 as current debt and payables rose sharply. Inventory and receivables dominated liquid-looking assets, reducing their immediate cash quality
Interest coverage ratio fell from 22.9x in FY24 to 16.3x in FY25 and 15.2x in FY26, as finance costs increased faster than profit before tax
Return on Asset declined from 16.0% in FY25 to 13.8% in FY26 because the asset base expanded materially faster than PAT
Industry Overview
Industry Drivers
Sewage Treatment Capacity Deficit and Urban Wastewater Growth
India faces a persistent mismatch between rapidly growing urban sewage generation and operating treatment capacity. Frost & Sullivan estimates sewage generation at approximately 90,061 MLD in FY26 against treatment capacity of 52,436 MLD, leaving a gap of roughly 37,625 MLD. The same study projects sewage generation to reach 110,350 MLD by FY31 and capacity to reach 83,172 MLD. This means the country must add large amounts of infrastructure merely to narrow the untreated sewage gap, creating demand for process technology, equipment, engineering and reliable operation rather than only the construction of new civil works.
The key details are:
Size of current deficit: Estimated sewage output of 90,061 MLD exceeded FY26 treatment capacity of 52,436 MLD by around 37,625 MLD. The deficit illustrates the opportunity for new STPs but also the scale of execution and municipal funding required.
Capacity addition through FY31: Treatment capacity is forecast to increase by approximately 30,736 MLD from FY26 to FY31. This creates demand for aeration, decanters, automation and treatment equipment, although contract conversion depends on approved local projects.
Market growth forecast: India’s broader wastewater treatment market is estimated at INR 292.0 billion in FY26 and forecast to reach INR 455.0 billion by FY31, implying a 9.3% CAGR. These represent industry forecasts, not booked revenue.
Technology replacement and upgrades: As existing plants age or fail tighter effluent requirements, customers may retrofit treatment trains rather than build entirely new facilities. Replacement creates equipment and service opportunities, subject to approval and project economics
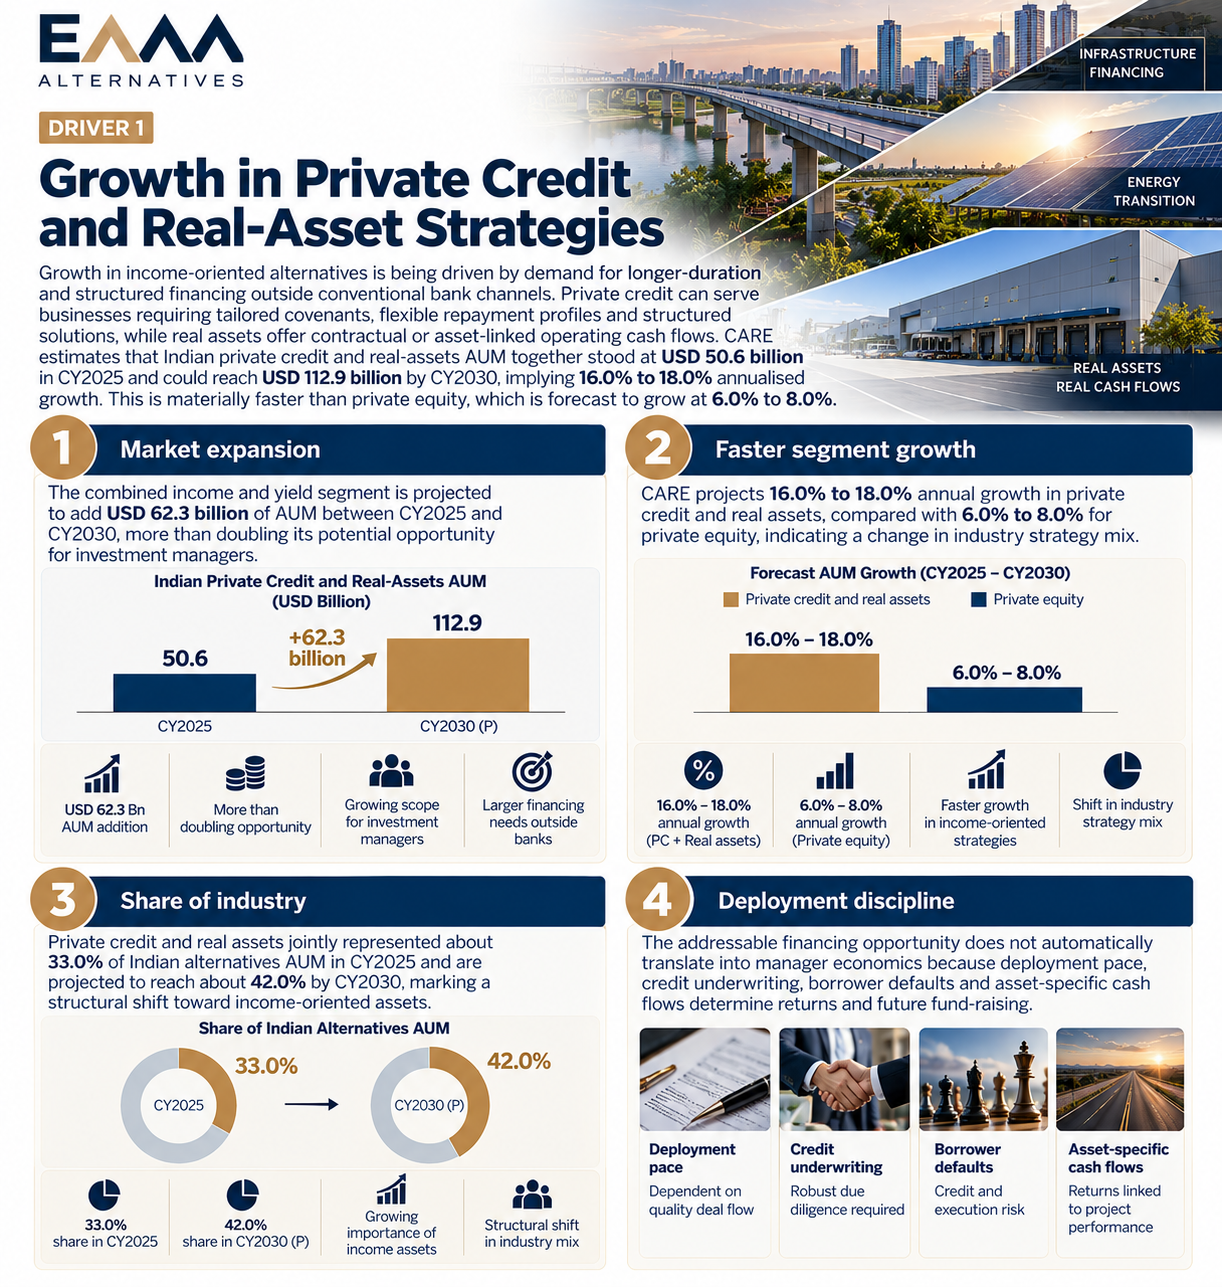
Tertiary Wastewater Treatment and Reuse
Water stress, tighter industrial discharge standards and municipal reuse policies are expanding demand beyond basic sewage treatment into filtration, membrane systems and other high-purity processing technologies. The Frost & Sullivan report estimates India’s tertiary-treatment market at INR 18.7 billion in FY26 and forecasts INR 70.1 billion by FY31. This 30.3% estimated annual growth rate is materially faster than the broader wastewater treatment market and reflects the potential to upgrade existing plants for industrial cooling, non-potable municipal uses and process water. It does not imply that every treatment project must install advanced tertiary equipment.
The key details are:
Market expansion: The Indian tertiary-treatment market is forecast to expand from INR 18.7 billion in FY26 to INR 70.1 billion by FY31, a 3.8x increase, based on Frost & Sullivan estimates rather than signed projects
Industrial economics: Textiles, pharmaceuticals, chemicals and other water-intensive industries can use reclaimed water to reduce freshwater purchases. Feasibility depends on treatment energy costs, water quality, local tariffs and plant utilisation
Technology transition: Moving from secondary effluent to reuse-grade water frequently requires ultrafiltration, reverse osmosis, advanced filtration and disinfection. This increases the technology portion of project spend, while raising commissioning and process-performance requirements
Regulatory distinction: CPCB and SPCB consent conditions and relevant NGT directions can increase tertiary adoption, but zero-liquid-discharge and tertiary standards are not blanket requirements for every plant or industry
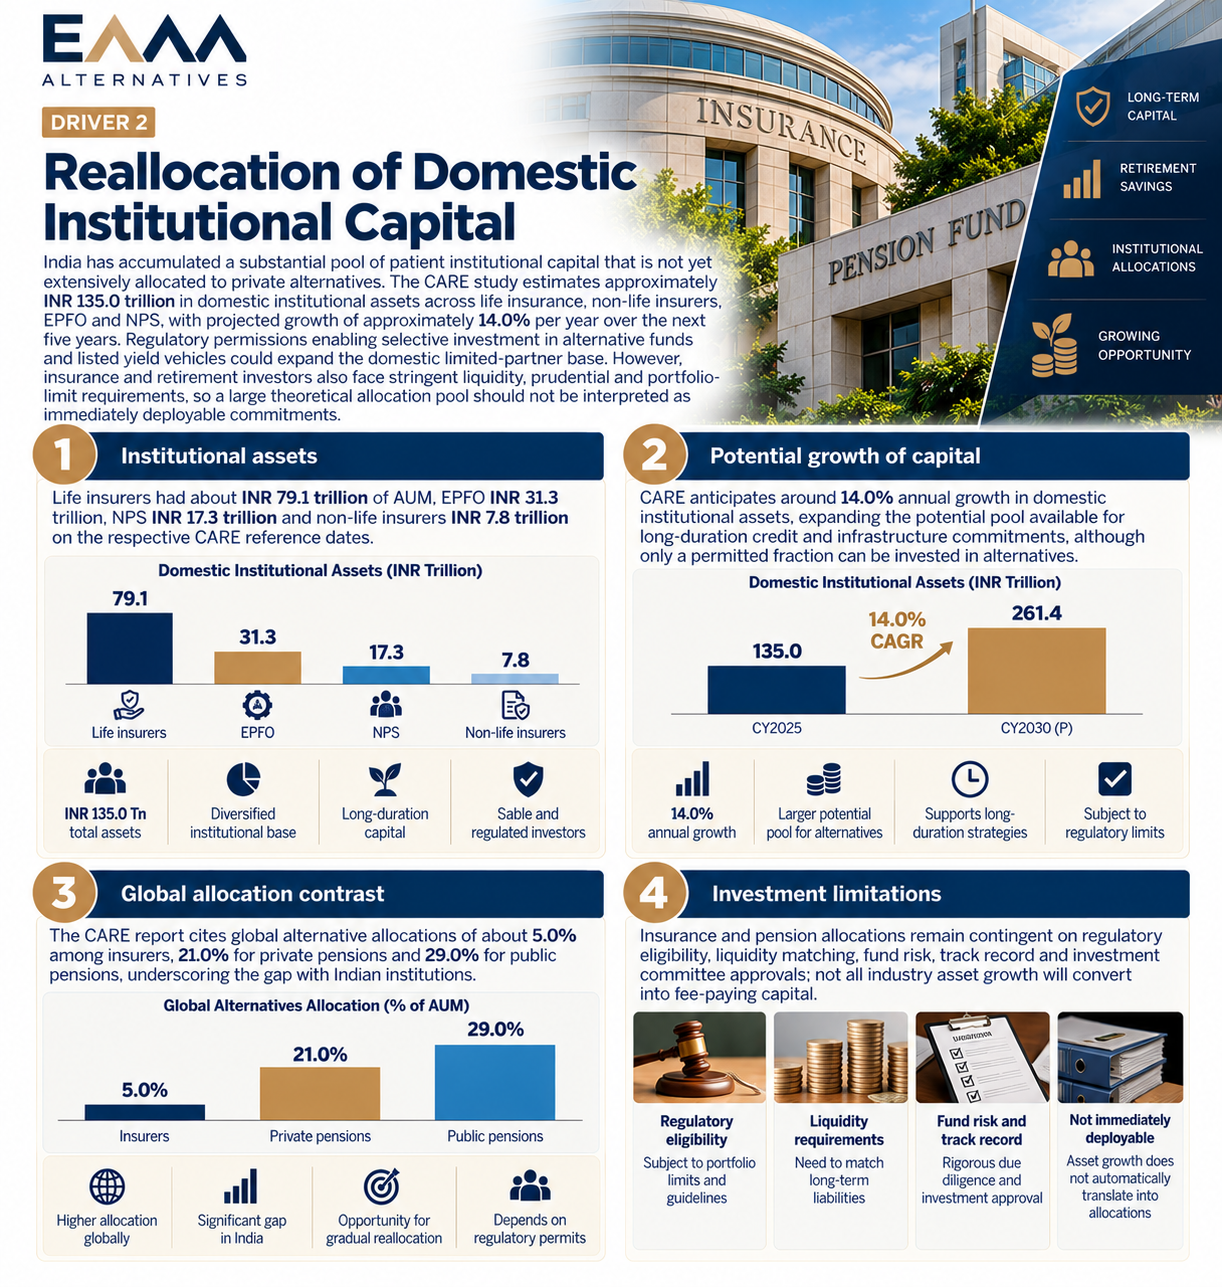
Municipal Solid Waste, Waste-to-Energy and Biogas
The Indian waste market is shifting gradually from simple collection and landfill disposal toward scientific treatment, biomethanation, waste-to-energy and resource recovery. Government statistics quoted in the industry report indicate around 59.2 million tonnes of annual municipal solid waste generation as of January 2026, with about 48.1 million tonnes processed. Urban waste processing coverage has expanded from 16.0% in 2014 to approximately 82.0% in 2026. This still leaves a sizeable annual unprocessed volume, while newer segregation requirements and landfill remediation create opportunities for technology providers and O&M participants.
The key details are:
Waste-processing gap: The difference between 59.2 MTPA of waste generated and 48.1 MTPA processed equates to roughly 11.1 MTPA requiring additional handling, treatment or processing capacity under the report’s referenced government data
Waste-to-energy installed capacity: India’s WTE capacity reached about 877.4 MW in FY26 and is forecast to reach 1,287.7 MW by FY30. Capacity additions require reliable feedstock sorting, plant efficiency and bankable electricity or disposal contracts
Biogas project pipeline: The industry study records 96 functional CBG plants and 2,227 active letters of intent around FY25. Letters of intent represent potential development activity, not commissioned operating capacity or assured profitability
Operations and waste economics: Waste conversion economics depend on waste quality, segregation, gate-fee collections, commodity offtake and operating uptime. Inadequate segregation can undermine expected energy yield even where projects receive policy support
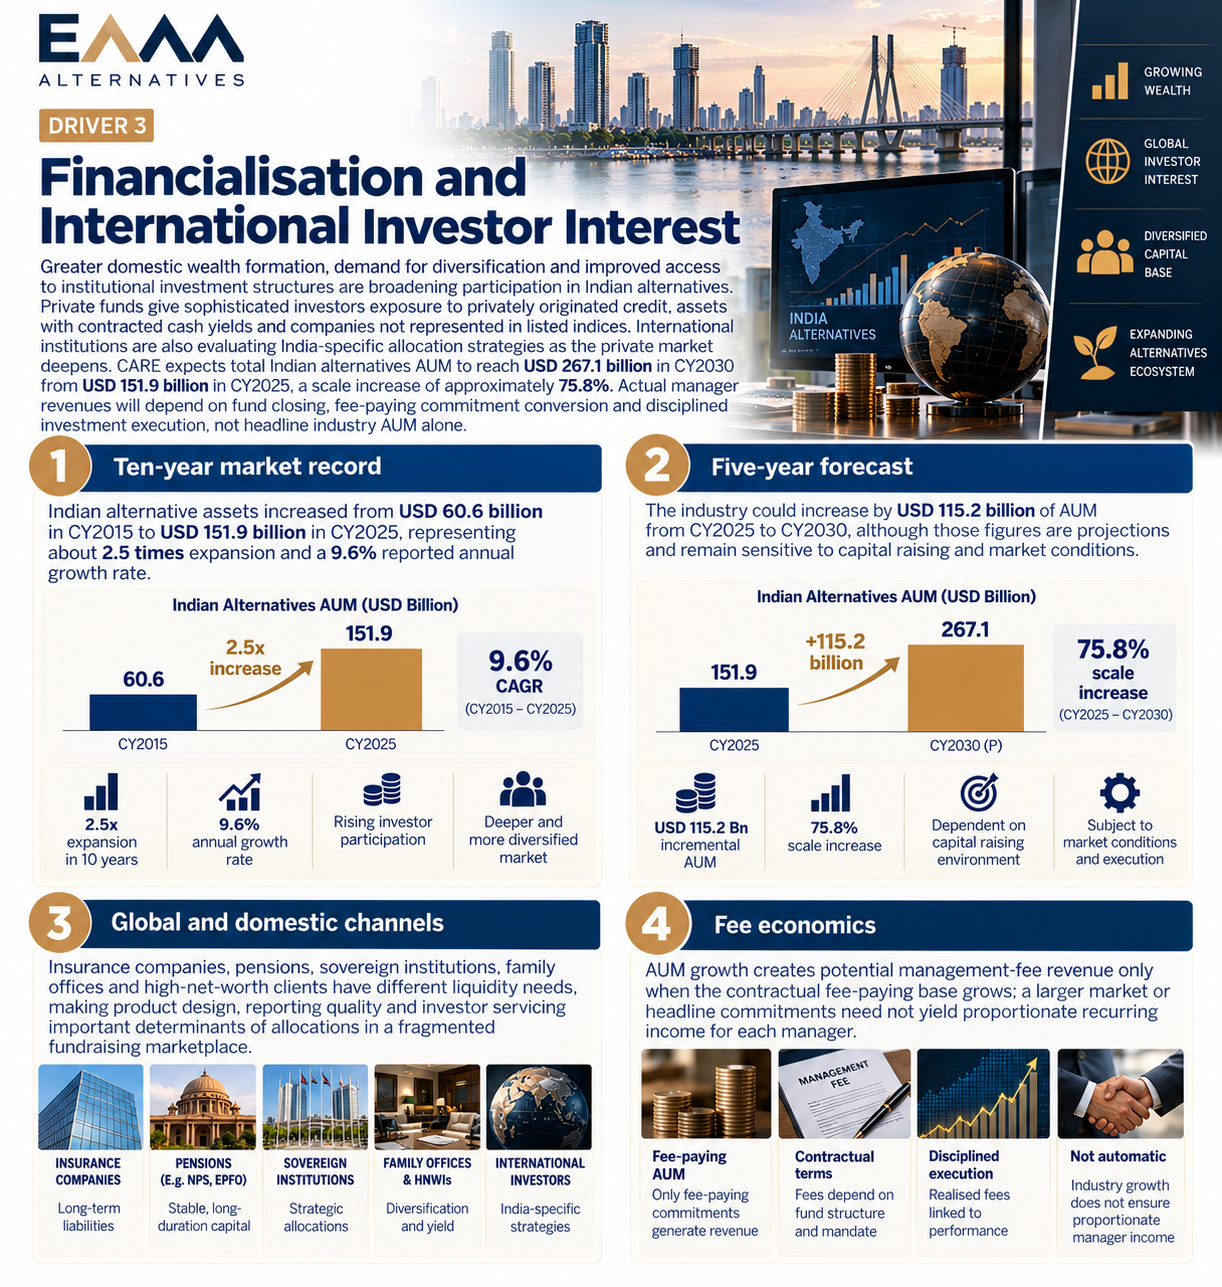
Risks in the Industry
Wastewater and solid waste infrastructure are strongly influenced by municipal budgets, procurement procedures and environmental compliance. The gap between stated demand and commercially executable projects can remain large when land acquisition, utilities, tender approvals or financing are delayed. Technology performance and operating costs also vary with influent quality, wastewater chemistry, waste segregation and electricity prices. India’s tighter pollution rules support investment but create warranty, guarantee and compliance liabilities for solution providers. In addition, long contract cycles and certification-based collections can result in a significant difference between recognised earnings and cash receipts.
The key risks are:
Municipal funding and receivable delays: Urban local bodies and public utilities often require approvals, grant disbursement and project certification before releasing payments. Contractor advances and retention money can increase cash conversion cycles even for financially profitable projects
Input variability and process performance: Treatment equipment must meet prescribed discharge quality despite seasonal variations in sewage composition and waste characteristics. Performance guarantees can generate rework, maintenance or penalties when processes underperform
Capex and tender competition: Large STP and WTE projects are capital-intensive and frequently procured through competitive bids. Aggressive pricing, fixed-rate contracts, delayed handover and input inflation can erode expected gross margins
Biogas and waste-to-energy economics: Project output depends on consistent feedstock supply, segregation, moisture levels, power tariffs and commercial offtake arrangements. A sanctioned plant or letter of intent does not ensure economic commissioning or stable margins
Government Policy Support
Policy support for environmental technology providers is primarily demand-enabling. Projects require actual capital allocations, state and municipal procurement, environmental clearances and successful commissioning. The following programmes and targets should not be confused with grants directly available to SFC.
The key policies are:
AMRUT 2.0 and urban sewerage: The industry report cites 592 sewerage and septage projects worth INR 67,607.7 Cr sanctioned under AMRUT 2.0 as of July 2026. The sanctioned project amount is a public-programme pipeline
Sewage treatment and reuse direction: National and state-level policy seeks greater safe reuse of treated wastewater. For example, the industry report cites policy targets in selected states including Gujarat and Uttar Pradesh; delivery depends on enforcement and local finances
Swachh Bharat Mission Urban: Government data in the study indicate urban solid-waste processing coverage increased from 16.0% in 2014 to about 82.0% in 2026, providing a policy basis for further infrastructure and legacy-dumpsite remediation
CBG offtake and blending: The industry study describes progressive compressed-biogas blending objectives under SATAT and related programmes. Rising blending obligations may support demand for biomethanation equipment, but actual offtake terms and feedstock costs determine project viability
Fundraise/Future Plans
Shareholding
Pre-issue shareholding
Promoter Holding 0.0%
Post-Issue Shareholding
Promoter Holding 0.0%
Category
Pre-Issue%Post-Issue%
Promoters
Sandeep Sudhakar Asolkar
14.5%13.8%
Sandeep Asolkar jointly with Priya Asolkar
19.4%17.5%
Saketchandrasingh P. Dhandoriya
9.0%4.8%
Asolkar Tradecraft Private Limited (promoter group)
5.3%5.1%
Total Promoter Holding
48.2%41.2%
Additional Shareholders
Other Shareholders
51.8%58.8%
Total Additional Holding
51.8%58.8%
Total Shareholding
100.0%100.0%
Existing Investor
- Overview
- Business
- Financial Highlights
- Industry Overview
- Fundraise/Future Plans
- Documentation
Get the Preqt App and keep in touch around the clock!
 Monitor your investments in real-time.
- Receive tailored deal suggestions.
- Get real-time updates and alerts.