

Signify Innovations India Ltd.
Lighting Smarter LivesSmarter Light, Better Living
Unlisted Review and Rating
Speculative
DRHP Not FiledOverall Recommendation
Signify is a highly cash-generative, virtually debt-free lighting leader with strong promoter capabilities, meaningful exports and stable profitability. However, revenue has remained almost flat over FY23-FY25, dividend payouts exceeding earnings have reduced the equity base, related-party dependence is substantial and tax contingencies require monitoring. The supplied 21.3x P/E appears reasonable against peers, but the 13.4x P/B is elevated. The proposed 50:50 manufacturing joint venture with Dixon could improve localisation and cost competitiveness, although execution and related restructuring should be monitored before taking a larger position.
PARAMETER
WEIGHT
SCORE
KEY FACTORS
Financial Performance
25.0%
4.0/5
Signify delivers stable margins, exceptional cash conversion and debt-free operations, but two-year revenue growth is virtually flat
Show more
Detailed Analysis
Revenue increased marginally from INR 3,106.3 crore in FY23 to INR 3,113.6 crore in FY25, representing only 0.1% two-year CAGR
Operating EBITDA was approximately INR 448.3 crore, producing a stable 14.4% margin
FY25 PAT of INR 270.1 crore represents an 8.7% net margin
The Company has no fund-based borrowings; including lease liabilities, reported debt/equity was 0.3x
Reported ROE increased to 55.2%, supported by profitability and a lower equity base following substantial dividends
Industry
25.0%
3.0/5
Connected lighting and exports provide growth avenues, but the broader market is maturing and intensely competitive.
Show more
Detailed Analysis
India’s overall lighting market is projected to grow at approximately 8.6% CAGR through 2030
Energy-efficiency programmes, UJALA, street-lighting initiatives and localisation policies provide a favourable regulatory environment
Overseas revenue reached INR 677.4 crore, representing 21.8% of FY25 revenue and increasing approximately 6% year-on-year
Management
25.0%
4.0/5
Deep promoter expertise and balanced board oversight are positives, while group dependence and tax contingencies require monitoring
Show more
Detailed Analysis
Signify’s lighting heritage extends beyond 125 years, with global leadership across conventional, LED and connected lighting
Three of the six FY25 directors were independent, producing independent representation of exactly 50%
No promoter pledge was identified, but tax and labour contingencies totalled approximately INR 112.4 crore
Valuation Metrics
25.0%
3.0/5
P/E and EV/EBITDA appear reasonable versus peers, but the elevated price-to-book ratio limits valuation comfort.
Show more
Detailed Analysis
The supplied P/E of 21.3x is approximately 9.8% below the stated industry P/E of 23.6x
Implied EV/EBITDA is approximately 12.2x, below Havells and Crompton but above lower-multiple diversified peers
P/B of 13.4x is exceptionally high, partly because dividends exceeding PAT have reduced the equity base
TOTAL
100%
3.5/5
Weighted Composite Score
Per Share Price
₹999.0
As of 14 Oct 2026
Lot Size
50.0 Shares
Minimum Investment
₹49,950.0 / 50 shares
Market Cap. (₹ Cr)
Revenue FY’25
PAT FY’25
P/E Multiple
Face Value
₹ 10.0Lot Size
50.0 sharesSale Type
Secondary SalePAT FY’25
₹ 270.1 CrPAT Margin (%)
8.6 %P/E Multiple
21.3xCAGR Growth 3Y
3.6 %ROE (FY’25)
55.2 %ROCE (FY’25)
69.2 %Price to Book Value ratio
13.4xDebt/Equity (FY’25)
0.3xMerchant banker appointed
❌ NoCompany Website
www.signify.com/en-inDisclaimer: Unlisted shares are unregulated & illiquid. This is NOT investment advice. Please do your own due diligence before investing.
Minimum Investment
₹49,950.0 / 50 sharesShares Lot 50 X 1
Investment amount
₹49,950.0
Overview
Business
Products
Business Model
Geographical Presence
Sales Channel
Key Risk Factor
Financial Highlights
Income Statement
Revenue growth with EBITDA and PAT margins
| Financial Metric | FY 2023 | FY 2024 | FY 2025 |
|---|---|---|---|
| Revenue (₹ Cr) | 3,106.3 | 3,068.7 | 3,113.6 |
| Growth (%) | 11.1% | -1.2% | 1.5% |
| EBITDA (₹ Cr) | 454.7 | 476.9 | 477.4 |
| EBITDA Margin (%) | 14.6% | 15.5% | 15.3% |
| PAT (₹ Cr) | 353.2 | 364.6 | 366.3 |
| PAT Margin (%) | 8.6% | 8.8% | 8.7% |
OBSERVATIONS & INSIGHTS
Revenue was broadly flat across the review period: ₹3,106.3 Cr in FY23, ₹3,068.7 Cr in FY24 and ₹3,113.6 Cr in FY25. FY25 growth was 1.5%, and FY22–FY25 revenue CAGR was approximately 3.7%
Derived EBITDA improved from ₹454.7 Cr in FY23 to ₹476.9 Cr in FY24 and held at ₹477.4 Cr in FY25. The margin expanded from 14.6% to 15.5% before settling at 15.3%
PAT remained stable at ₹266.7–270.1 Cr, with audited basic EPS increasing from ₹46.36 to ₹46.96. The user snapshot shows ₹46.98, a small rounding/source difference
FY25 operating cash flow of ₹366.3 Cr exceeded PAT. The FY25 interim dividend of ₹57.50 per share had a ₹330.7 Cr payout—about 122% of FY25 PAT. The cash-flow statement records ₹388.2 Cr of dividends paid because it also includes the prior-year final dividend and payment timing
Balance Sheet
| Financial Metric | FY 2023 | FY 2024 | FY 2025 |
|---|---|---|---|
| EQUITY & LIABILITIES | ₹ 1,710.6 Cr | ₹ 1,602.9 Cr | ₹ 1,520.6 Cr |
| Net Worth | ₹ 642.4 Cr | ₹ 549.0 Cr | ₹ 429.6 Cr |
| Share Capital | ₹ 57.5 Cr | ₹ 57.5 Cr | ₹ 57.5 Cr |
| Reserves & Surplus | ₹ 584.9 Cr | ₹ 491.5 Cr | ₹ 372.1 Cr |
| Total Liabilities | ₹ 1,068.2 Cr | ₹ 1,053.9 Cr | ₹ 1,091.0 Cr |
| Current Liabilities | ₹ 943.3 Cr | ₹ 926.3 Cr | ₹ 972.3 Cr |
| Borrowings | ₹ 0.0 Cr | ₹ 0.0 Cr | ₹ 0.0 Cr |
| Trade Payables | ₹ 655.9 Cr | ₹ 620.6 Cr | ₹ 618.5 Cr |
| Other Current Liabilities | ₹ 287.4 Cr | ₹ 305.7 Cr | ₹ 353.8 Cr |
| Non-Current Liabilities | ₹ 124.9 Cr | ₹ 127.6 Cr | ₹ 118.7 Cr |
| Borrowings | ₹ 0.0 Cr | ₹ 0.0 Cr | ₹ 0.0 Cr |
| Other Non-Current Liabilities | ₹ 124.9 Cr | ₹ 127.6 Cr | ₹ 118.7 Cr |
| ASSETS | ₹ 1,710.6 Cr | ₹ 1,602.9 Cr | ₹ 1,520.6 Cr |
| Current Assets | ₹ 1,266.8 Cr | ₹ 1,170.1 Cr | ₹ 1,198.3 Cr |
| Trade Receivables | ₹ 268.8 Cr | ₹ 242.4 Cr | ₹ 268.1 Cr |
| Inventory | ₹ 297.4 Cr | ₹ 292.3 Cr | ₹ 291.7 Cr |
| Cash & Cash Equivalents | ₹ 543.7 Cr | ₹ 458.4 Cr | ₹ 362.3 Cr |
| Other Current Assets | ₹ 156.9 Cr | ₹ 177.0 Cr | ₹ 276.2 Cr |
| Non-Current Assets | ₹ 443.8 Cr | ₹ 432.8 Cr | ₹ 322.3 Cr |
| Fixed Assets | ₹ 327.2 Cr | ₹ 300.4 Cr | ₹ 262.3 Cr |
| Other Non-Current Assets | ₹ 116.6 Cr | ₹ 132.4 Cr | ₹ 60.0 Cr |
OBSERVATIONS & INSIGHTS
Total assets declined from ₹1,710.6 Cr in FY23 to ₹1,520.6 Cr in FY25, largely reflecting dividends, lower cash and the reclassification of the VLF LED disposal group
Net worth fell from ₹642.4 Cr to ₹429.6 Cr even as PAT was stable, because cash distributions exceeded retained earnings over the period
Cash and cash equivalents reduced from ₹543.7 Cr to ₹362.3 Cr. The Company nevertheless remained free of conventional year-end borrowings
Trade receivables increased to ₹268.1 Cr in FY25 after declining in FY24, while inventories remained broadly flat around ₹292 Cr
The FY25 disposal group comprised ₹106.4 Cr of assets and ₹35.0 Cr of liabilities associated with VLF LED operations; transaction completion and final consideration are material balance-sheet events
The proposed transfer consideration of ₹140.3 Cr exceeds the disposal group’s net carrying amount of ₹71.4 Cr, but taxes, closing adjustments, retained obligations and JV investment requirements determine realised economics
Cash Flow
| Financial Metric | FY 2023 | FY 2024 | FY 2025 |
|---|---|---|---|
CFO (₹ Cr) Cash generated from core business operations. | +286.7 Cr | +324.7 Cr | +366.3 Cr |
CFI (₹ Cr) Cash used for investments and long-term assets. | -34.5 Cr | +6.6 Cr | -15.6 Cr |
CFF (₹ Cr) Cash flow related to funding and borrowings. | -266.5 Cr | -416.6 Cr | -446.8 Cr |
Working Capital
| Efficiency Metric | FY 2023 | FY 2024 | FY 2025 |
|---|---|---|---|
Debtor Days Average number of days taken to collect customer payments. | - | - | - |
Creditor Days Average time taken to pay suppliers and vendors. | - | - | - |
Inventory Days Average number of days inventory remains unsold. | - | - | - |
CCC (Cash Conversion Cycle) (Debtor Days + Inventory Days - Creditor Days) | - | - | - |
Financial Ratios
Measures the company’s leverage relative to shareholder equity.
OBSERVATIONS & INSIGHTS
Current ratio declined from 1.34x in FY23 to 1.23x in FY25, indicating a thinner short-term liquidity cushion despite a sizeable cash balance
ROCE increased from 46.2% to 69.2%, reflecting a capital-light profile, strong operating profit and declining equity
Net profit margin stayed within a narrow 8.6%–8.8% band, demonstrating resilience despite lighting-sector price deflation
Debt-equity increased to 28.9% because the annual-report ratio treats lease liabilities as debt; conventional bank borrowings were nil at year-end
Derived interest coverage remained very strong but eased from 41.1x in FY23 to 32.6x in FY25 as finance cost increased
Industry Overview
Industry Drivers
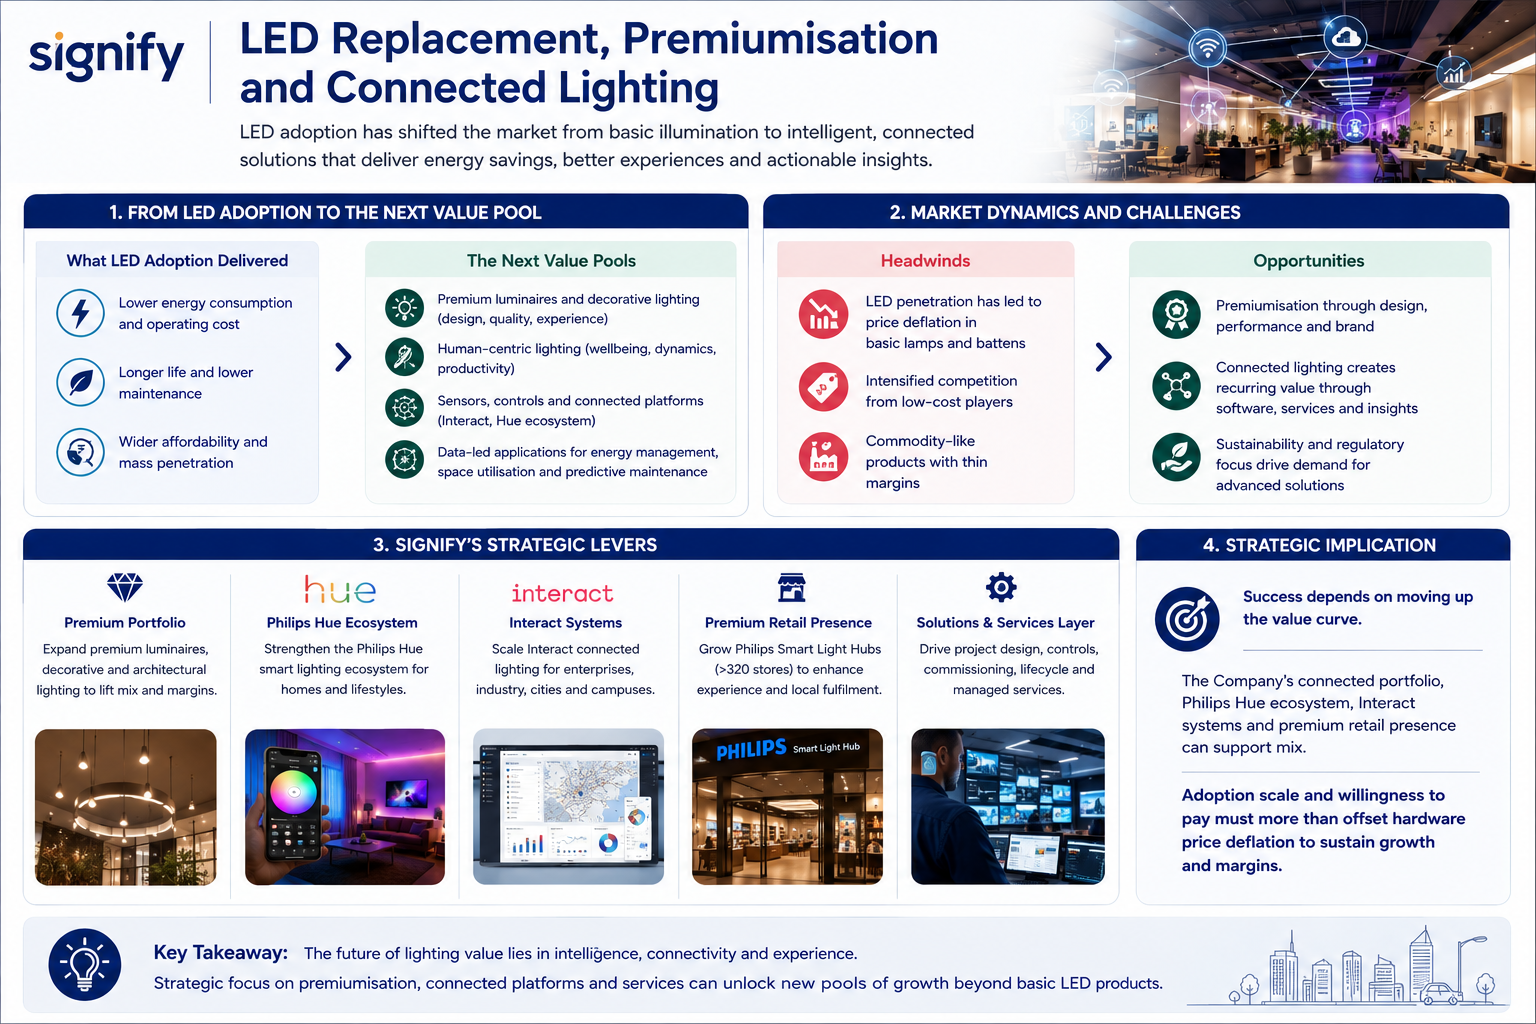
LED Replacement, Premiumisation and Connected Lighting
LED penetration has reduced energy use but also intensified price competition in basic lamps
The next value pools are premium luminaires, decorative lighting, human-centric solutions, sensors, controls and connected platforms that can improve energy management and space utilisation
The Company’s connected portfolio, Philips Hue ecosystem, Interact systems and premium retail presence can support mix, but adoption and willingness to pay must offset hardware price deflation
Infrastructure, Commercial Capex and Public-Sector Retrofit
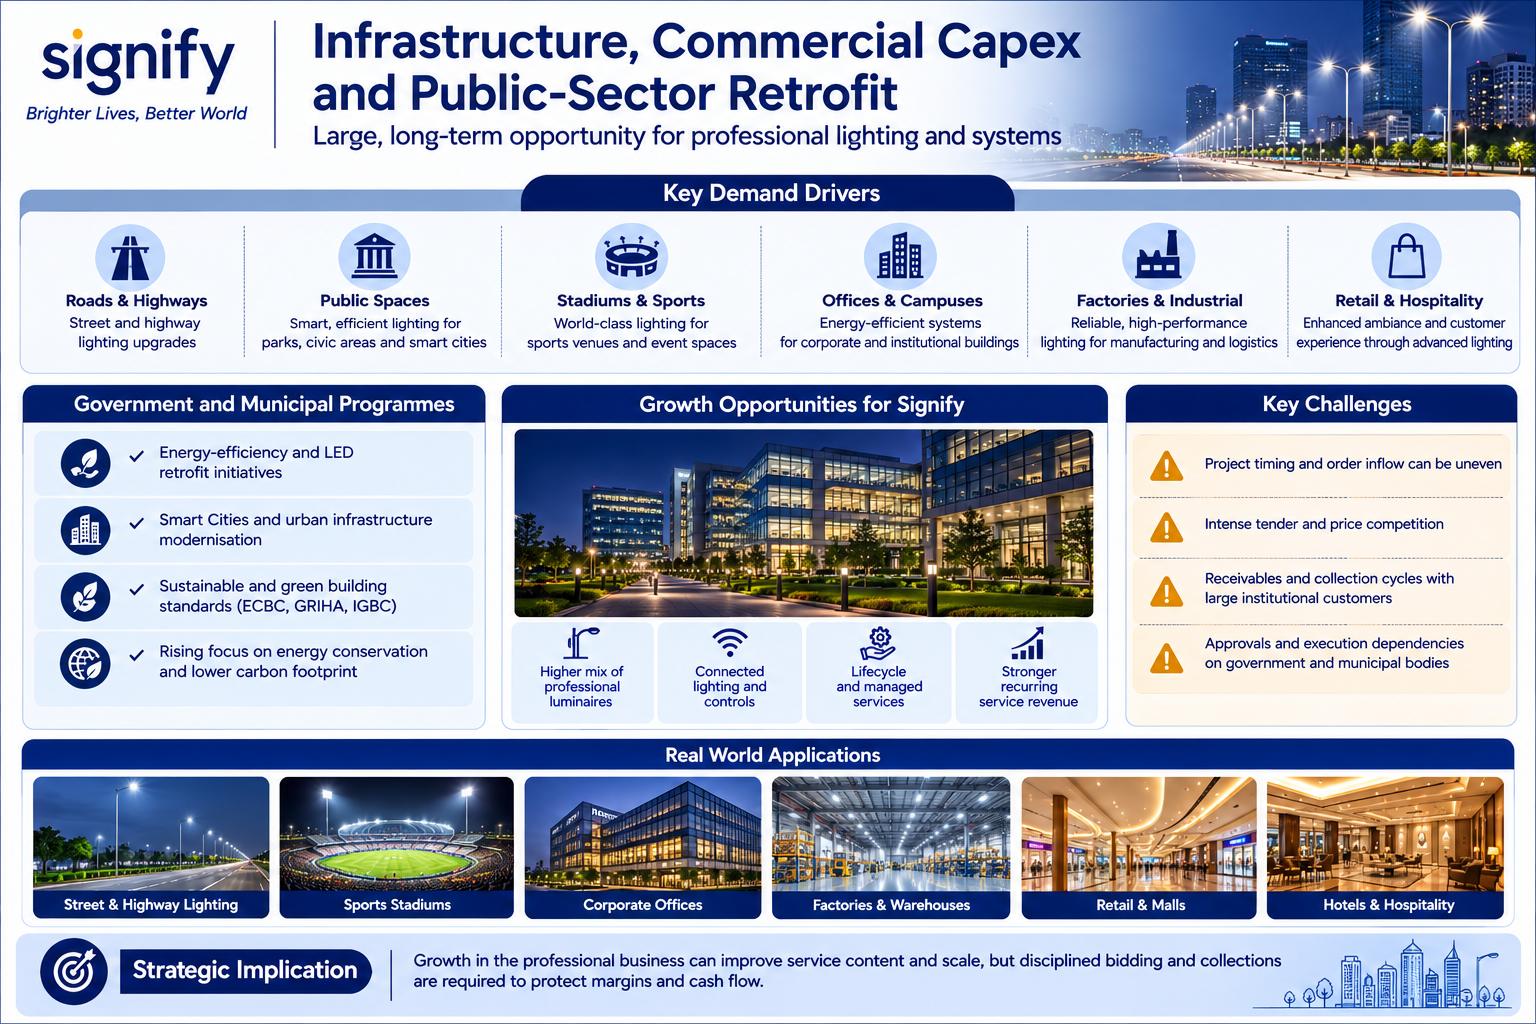
Roads, public spaces, stadiums, offices, factories, retail and hospitality projects support professional luminaires and systems
Government and municipal efficiency programmes also create retrofit demand, though project timing, tender pricing, receivables and approvals can be uneven
Growth in the professional business can improve service content and scale, but disciplined bidding and collections are required to protect margins and cash flow
Industry Risks / Monitorables
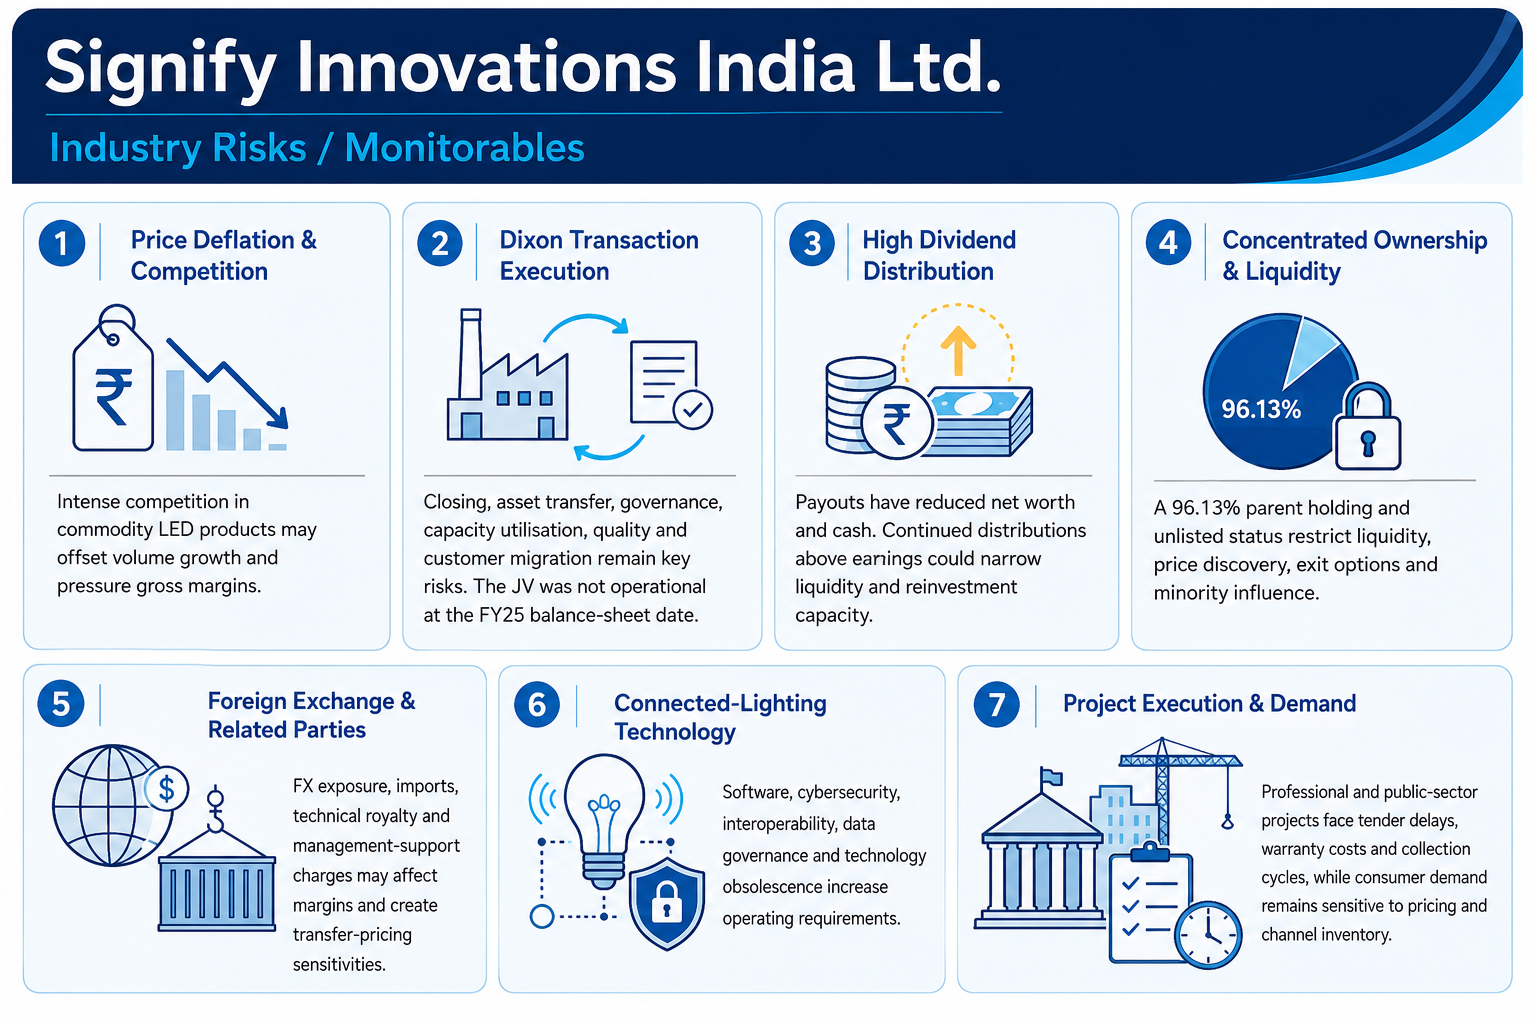
Price deflation and intense competition in commodity LED products may offset volume growth and pressure gross margin
The Dixon transaction may face closing, transfer, governance, capacity-utilisation, quality or customer-migration risks; the JV was not operational at the FY25 balance-sheet date
High dividend distributions have reduced net worth and cash; continued payouts above earnings would narrow liquidity and reinvestment capacity
A 96.13% parent holding and unlisted status materially limit liquidity, price discovery, exit options and minority influence
Foreign exchange, imports, technical royalty and management-support charges can affect margins and create related-party and transfer-pricing sensitivities
Connected lighting increases software, cybersecurity, interoperability, data-governance and technology-obsolescence requirement
Professional and public-sector projects can be exposed to tender delays, execution risk, warranty costs and collection cycles, while consumer demand remains sensitive to pricing and channel inventory
Government Policy Support
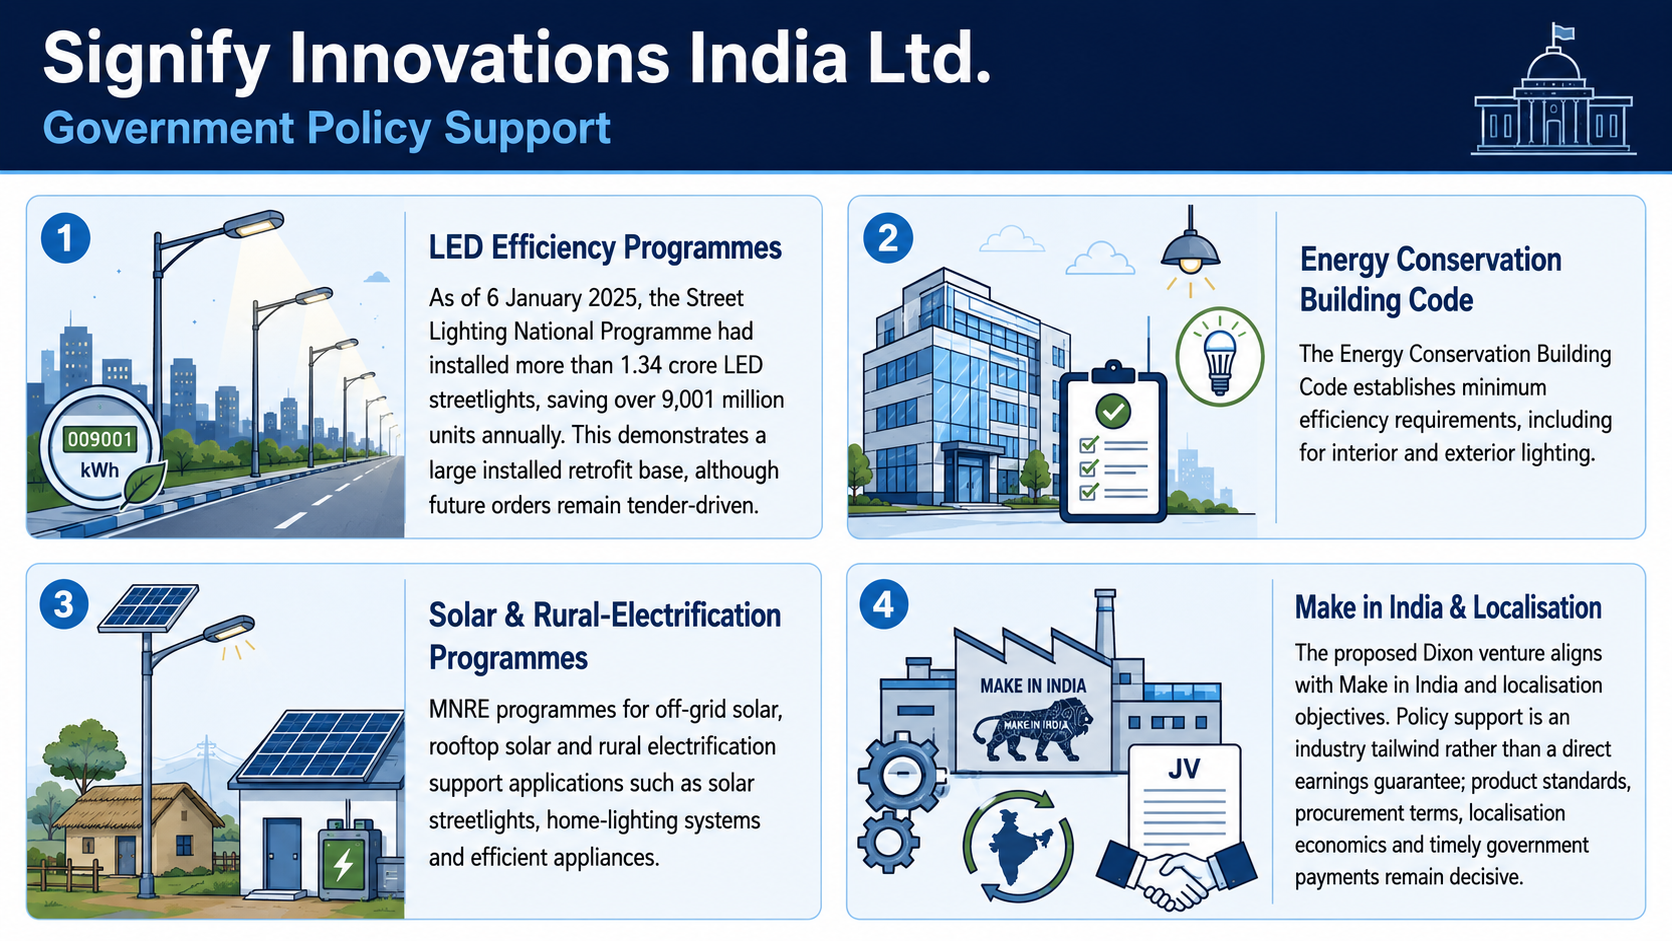
Energy efficiency programmes have structurally supported LED adoption. As of 6 January 2025, the Government reported that the Street Lighting National Programme had installed more than 1.34 crore LED streetlights, saving over 9,001 million units annually. This demonstrates the scale of the installed retrofit base, although future orders remain tender-driven
The Energy Conservation Building Code establishes minimum efficiency requirements, including for interior and exterior lighting
MNRE programmes for off-grid solar, rooftop solar and rural electrification also support applications such as solar streetlights, home-lighting systems and efficient appliances
The proposed Dixon venture aligns with Make in India and localisation objectives. Policy support is an industry tailwind rather than a direct earnings guarantee; product standards, procurement terms, localisation economics and timely government payments remain decisive
Fundraise/Future Plans
Shareholding
Pre-issue shareholding
Promoter Holding 0.0%
Category
Pre-Issue%
Promoters
0.0%
Total Promoter Holding
0.0%
Additional Shareholders
0.0%
Total Additional Holding
0.0%
Total Shareholding
0.0%
- Overview
- Business
- Financial Highlights
- Industry Overview
- Fundraise/Future Plans
- Documentation
Get the Preqt App and keep in touch around the clock!
 Monitor your investments in real-time.
- Receive tailored deal suggestions.
- Get real-time updates and alerts.
