

SK Finance Ltd
Credit for GrowthFueling everyday enterprise
IPO Review and Rating
Buy
Overall Recommendation
Total income increased at a 29.1% 3-year CAGR to INR 2,828.2 Cr in FY26, with 61.5% mechanical EBITDA margin, 15.2% PAT margin, INR 430.9 Cr PAT, 3.23x D/E, 11.5% ROE and INR (1,696.0) Cr operating cash flow. The NBFC-Retail industry is projected to grow 18.0%-20.0% in FY27. At the prevailing valuation, the Company trades at 25.1x P/E, a 49.7% discount to the stated 50.0x industry P/E; 12.9x EV/EBITDA, a 52.6% discount to the selected 27.2x peer median; 2.7x P/B and 3.8x P/S, while the indicative unlisted price declined approximately 15.8% over 30 days.
PARAMETER
WEIGHT
SCORE
KEY FACTORS
Financial Performance
25.0%
4.4/5
Total income recorded a 29.1% 3-year CAGR, with FY26 growth of 18.5%
Show more
Detailed Analysis
Total income increased from INR 1,314.2 Cr in FY23 to INR 1,797.9 Cr in FY24, INR 2,386.4 Cr in FY25 and INR 2,828.2 Cr in FY26
FY26 mechanical EBITDA stood at approximately INR 1,739.3 Cr, resulting in an EBITDA margin of approximately 61.5%
PAT increased from INR 379.7 Cr in FY25 to INR 430.9 Cr in FY26, +13.5% YoY; FY26 PAT margin stood at 15.2%
FY26 PAT of INR 430.9 Cr against average FY25-FY26 equity of approximately INR 3,741.9 Cr resulted in an estimated ROE of 11.5%
Industry
25.0%
2.6/5
NBFC-Retail AUM is expected to grow 18.0%-20.0% in FY27, supporting a Growth-stage classification
Show more
Detailed Analysis
Retail NBFC AUM is projected to sustain 18.0%-20.0% growth in FY27, supporting classification in the Growth stage
Estimated industry HHI is <1,200, reflecting a fragmented lender base across banks and NBFCs
SK Finance is classified as a Middle Layer NBFC, with FY26 D/E of 3.23x, CRAR of 25.41% and LCR of 167.01%
The Company operates 100.0% primarily in financing activities in India, with no material overseas lending revenue disclosed
Management
25.0%
4.0/5
Promoter experience stands at 31+ years
Show more
Detailed Analysis
Rajendra Kumar Setia founded the business in 1994, giving the promoter 31+ years of financial-services experience by 2026
The current Board comprises 7 directors, including 3 Independent Directors, resulting in 42.9% independent representation
0.0% promoter-share pledge was identified in the reviewed disclosures; a historical NCD regulatory matter was settled with SEBI in February 2026 for INR 8.75 lakh
Identified recurring FY25 RPTs were approximately INR 26.2 Cr, equivalent to approximately 1.1% of FY25 total income of INR 2,386.4 Cr
Valuation Metrics
25.0%
4.3/5
The Company is valued at 25.1x P/E, a 49.7% discount to the stated 50.0x industry P/E
Show more
Detailed Analysis
Based on market capitalisation of INR 10,775.5 Cr, FY26 debt of INR 12,819.7 Cr and cash/bank balances of INR 1,156.2 Cr, estimated EV is INR 22,439.0 Cr. Against mechanical EBITDA of INR 1,739.3 Cr, EV/EBITDA is approximately 12.9x
The Company is valued at 2.7x P/B, based on market capitalisation of INR 10,775.5 Cr against FY26 total equity of approximately INR 3,981.9 Cr
Indicative OTC price stood at approximately INR 745.0/share on August 1, 2026, representing a 15.8% decline over 30 days
TOTAL
100%
3.8/5
Weighted Composite Score
Per Share Price
₹675.0
As of 14 Oct 2026
Lot Size
500.0 Shares
Minimum Investment
₹3,37,500.0 / 500 shares
Market Cap. (₹ Cr)
Revenue FY’26
PAT FY’26
P/E Multiple
Face Value
₹ 1.0Lot Size
500.0 sharesPAT FY’26
₹ 430.9 CrPAT Margin (%)
15.2 %P/E Multiple
25.1xCAGR Growth 3Y
29.1 %ROE (FY’26)
11.5 %Price to Book Value ratio
2.7xDebt/Equity (FY’26)
3.2xMerchant banker appointed
❌ NoCompany Website
www.skfin.inDisclaimer: Unlisted shares are unregulated & illiquid. This is NOT investment advice. Please do your own due diligence before investing.
Minimum Investment
₹3,37,500.0 / 500 sharesShares Lot 500 X 1
Investment amount
₹3,37,500.0
Overview
Business
Services
Business Model
Geographical Presence
Sales Channel
Financial Highlights
Income Statement
Revenue growth with EBITDA and PAT margins
| Financial Metric | FY 2024 | FY 2025 | FY 2026 |
|---|---|---|---|
| Revenue (₹ Cr) | 1,797.9 | 2,386.4 | 2,828.2 |
| Growth (%) | 36.8% | 32.7% | 18.5% |
| EBITDA (₹ Cr) | 1,182.8 | 1,502.6 | 1,739.4 |
| EBITDA Margin (%) | 65.8% | 63.0% | 61.5% |
| PAT (₹ Cr) | 311.9 | 379.7 | 430.9 |
| PAT Margin (%) | 17.3% | 15.9% | 15.2% |
OBSERVATIONS & INSIGHTS
Total income increased from INR 1,797.9 Cr in FY24 to INR 2,828.2 Cr in FY26, while the 3-year CAGR from FY23 to FY26 was 29.1%. Growth moderated from 36.8% in FY24 to 18.5% in FY26 as the base scaled
PAT increased from INR 311.9 Cr in FY24 to INR 430.9 Cr in FY26, but PAT margin compressed from 17.3% to 15.2%, indicating that growth in funding cost, credit cost and operating investment partly offset scale benefits
Analytical EBITDA margin declined from 65.8% in FY24 to 61.5% in FY26. This should be read cautiously because finance cost is a core cost of business for an NBFC
The FY26 user-supplied sales figure of INR 2,823.6 Cr corresponds to audited revenue from operations; audited total income was slightly higher at INR 2,828.2 Cr
Balance Sheet
| Financial Metric | FY 2024 | FY 2025 | FY 2026 |
|---|---|---|---|
| EQUITY & LIABILITIES | ₹ 12,309.2 Cr | ₹ 15,419.4 Cr | ₹ 17,152.0 Cr |
| Net Worth | ₹ 3,108.6 Cr | ₹ 3,501.8 Cr | ₹ 3,981.8 Cr |
| Share Capital | ₹ 13.4 Cr | ₹ 13.4 Cr | ₹ 13.4 Cr |
| Reserves & Surplus | ₹ 3,095.2 Cr | ₹ 3,488.4 Cr | ₹ 3,968.4 Cr |
| Total Liabilities | ₹ 9,200.6 Cr | ₹ 11,917.6 Cr | ₹ 13,170.2 Cr |
| Current Liabilities | ₹ 265.7 Cr | ₹ 313.5 Cr | ₹ 342.6 Cr |
| Borrowings | ₹ 0.0 Cr | ₹ 0.0 Cr | ₹ 0.0 Cr |
| Trade Payables | ₹ 0.0 Cr | ₹ 0.0 Cr | ₹ 0.0 Cr |
| Other Current Liabilities | ₹ 265.7 Cr | ₹ 313.5 Cr | ₹ 342.6 Cr |
| Non-Current Liabilities | ₹ 8,934.9 Cr | ₹ 11,604.1 Cr | ₹ 12,827.6 Cr |
| Borrowings | ₹ 8,934.9 Cr | ₹ 11,604.1 Cr | ₹ 12,819.7 Cr |
| Other Non-Current Liabilities | ₹ 0.0 Cr | ₹ 0.0 Cr | ₹ 7.9 Cr |
| ASSETS | ₹ 12,309.2 Cr | ₹ 15,419.4 Cr | ₹ 17,152.1 Cr |
| Current Assets | ₹ 2,007.8 Cr | ₹ 1,930.1 Cr | ₹ 1,277.4 Cr |
| Trade Receivables | ₹ 0.1 Cr | ₹ 16.8 Cr | ₹ 17.5 Cr |
| Inventory | ₹ 0.0 Cr | ₹ 0.0 Cr | ₹ 0.0 Cr |
| Cash & Cash Equivalents | ₹ 1,964.8 Cr | ₹ 1,904.2 Cr | ₹ 1,156.2 Cr |
| Other Current Assets | ₹ 42.9 Cr | ₹ 9.1 Cr | ₹ 103.7 Cr |
| Non-Current Assets | ₹ 10,301.4 Cr | ₹ 13,489.3 Cr | ₹ 15,874.7 Cr |
| Fixed Assets | ₹ 195.4 Cr | ₹ 228.2 Cr | ₹ 234.1 Cr |
| Other Non-Current Assets | ₹ 10,106.0 Cr | ₹ 13,261.1 Cr | ₹ 15,640.6 Cr |
OBSERVATIONS & INSIGHTS
Total assets increased from INR 12,309.1 Cr in FY24 to INR 17,152.2 Cr in FY26, a 39.3% increase over two years, driven primarily by expansion in the lending book and financial assets
Total equity increased from INR 3,108.6 Cr to INR 3,981.9 Cr over the same period, while borrowings remained the primary source of balance-sheet funding
Cash & Bank reduced from INR 1,964.8 Cr in FY24 to INR 1,156.2 Cr in FY26 as capital was deployed into lending assets. Liquidity therefore needs to be assessed alongside committed funding lines and the FY26 Liquidity Coverage Ratio
Debt/Equity remained above 3.0x in FY25-FY26, while CRAR compressed to 25.4% in FY26, making capital consumption from future growth a key monitorable
The combination of strong asset growth and higher Stage 3 ratios indicates that incremental underwriting quality and collection efficiency are more important than absolute loan-book growth alone
Cash Flow
| Financial Metric | FY 2024 | FY 2025 | FY 2026 |
|---|---|---|---|
CFO (₹ Cr) Cash generated from core business operations. | -2,321.6 Cr | -2,112.1 Cr | -1,696 Cr |
CFI (₹ Cr) Cash used for investments and long-term assets. | -791.6 Cr | -565.7 Cr | +576.5 Cr |
CFF (₹ Cr) Cash flow related to funding and borrowings. | +2,765.7 Cr | +2,653.5 Cr | +1,067.8 Cr |
Financial Ratios
Measures the company’s leverage relative to shareholder equity.
OBSERVATIONS & INSIGHTS
ROE moderated from 12.6% in FY24 to 11.5% in FY25 and remained around 11.5% in FY26 despite PAT growth, reflecting the larger equity base and continued balance-sheet expansion
Debt/Equity increased from 2.9x in FY24 to 3.3x in FY25 before easing to 3.2x in FY26, indicating continued reliance on wholesale borrowings to fund loan-book growth
ROA eased from 2.9% in FY24 to 2.6% in FY26, while interest coverage remained around 1.5x across the period
Asset quality weakened: Gross Stage 3 moved from 2.2% in FY24 to 2.6% in FY25 and 3.7% in FY26, while Net Stage 3 moved from 1.3% to 1.5% and 2.3%
CRAR reduced from 33.9% in FY24 to 29.5% in FY25 and 25.4% in FY26. The capital buffer remains material, but the direction is a key monitorable if loan-book growth remains elevated
Industry Overview
Industry Drivers
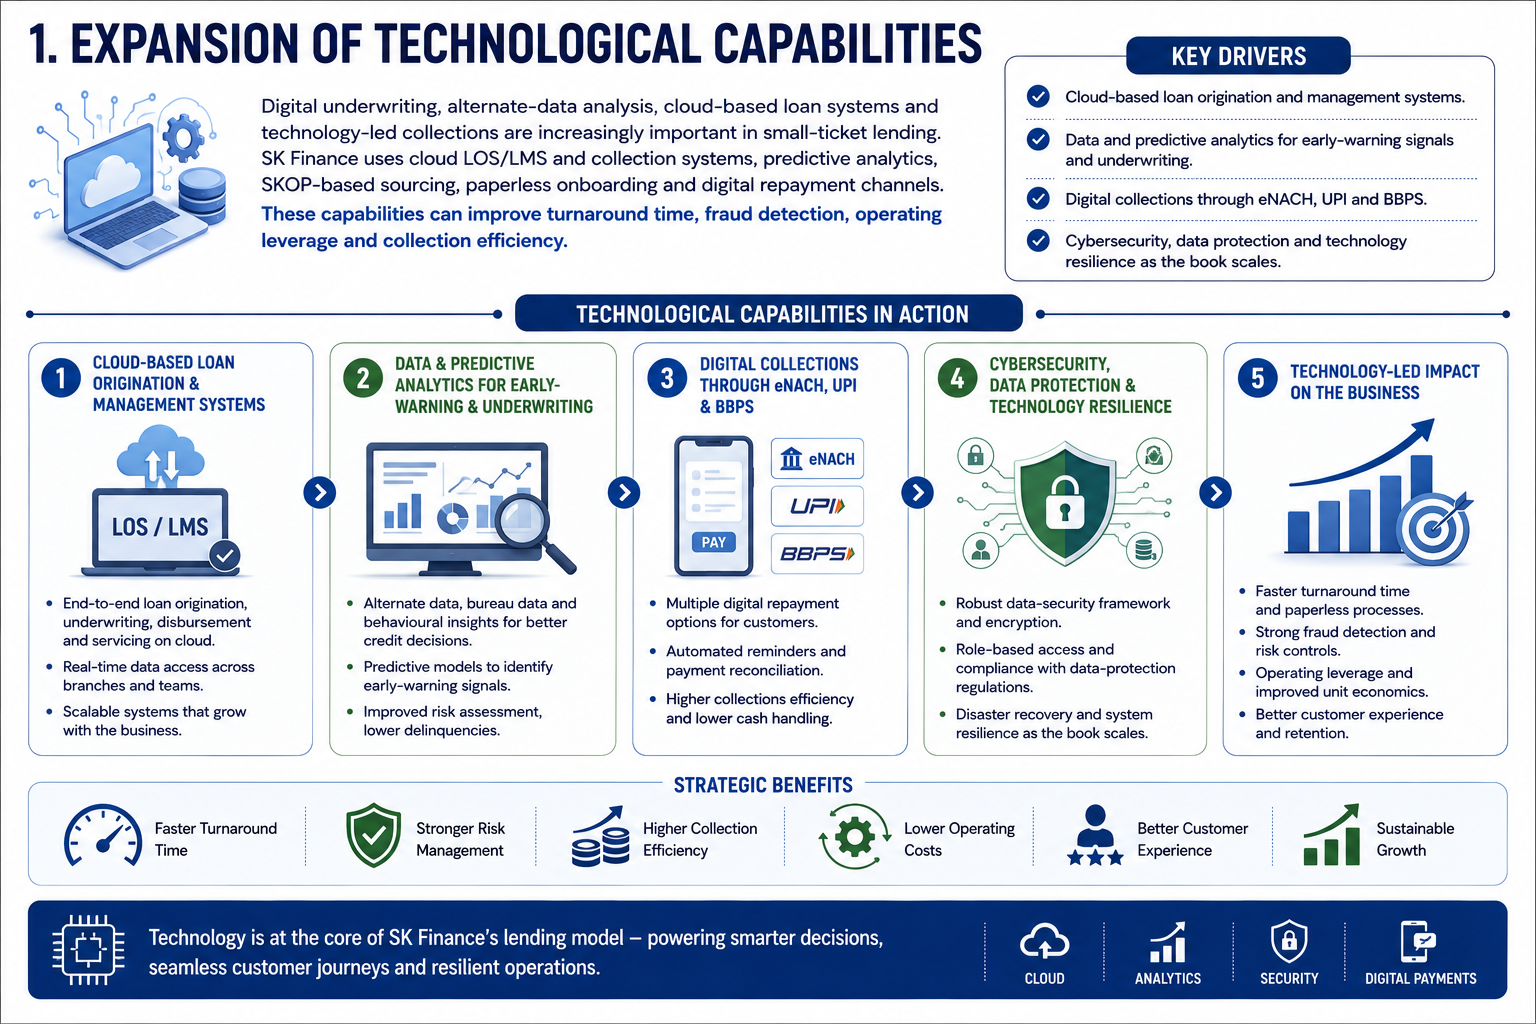
Expansion of Technological Capabilities
Cloud-based loan origination and management systems
Data and predictive analytics for early-warning signals and underwriting
Digital collections through eNACH, UPI and BBPS
Cybersecurity, data protection and technology resilience as the book scales
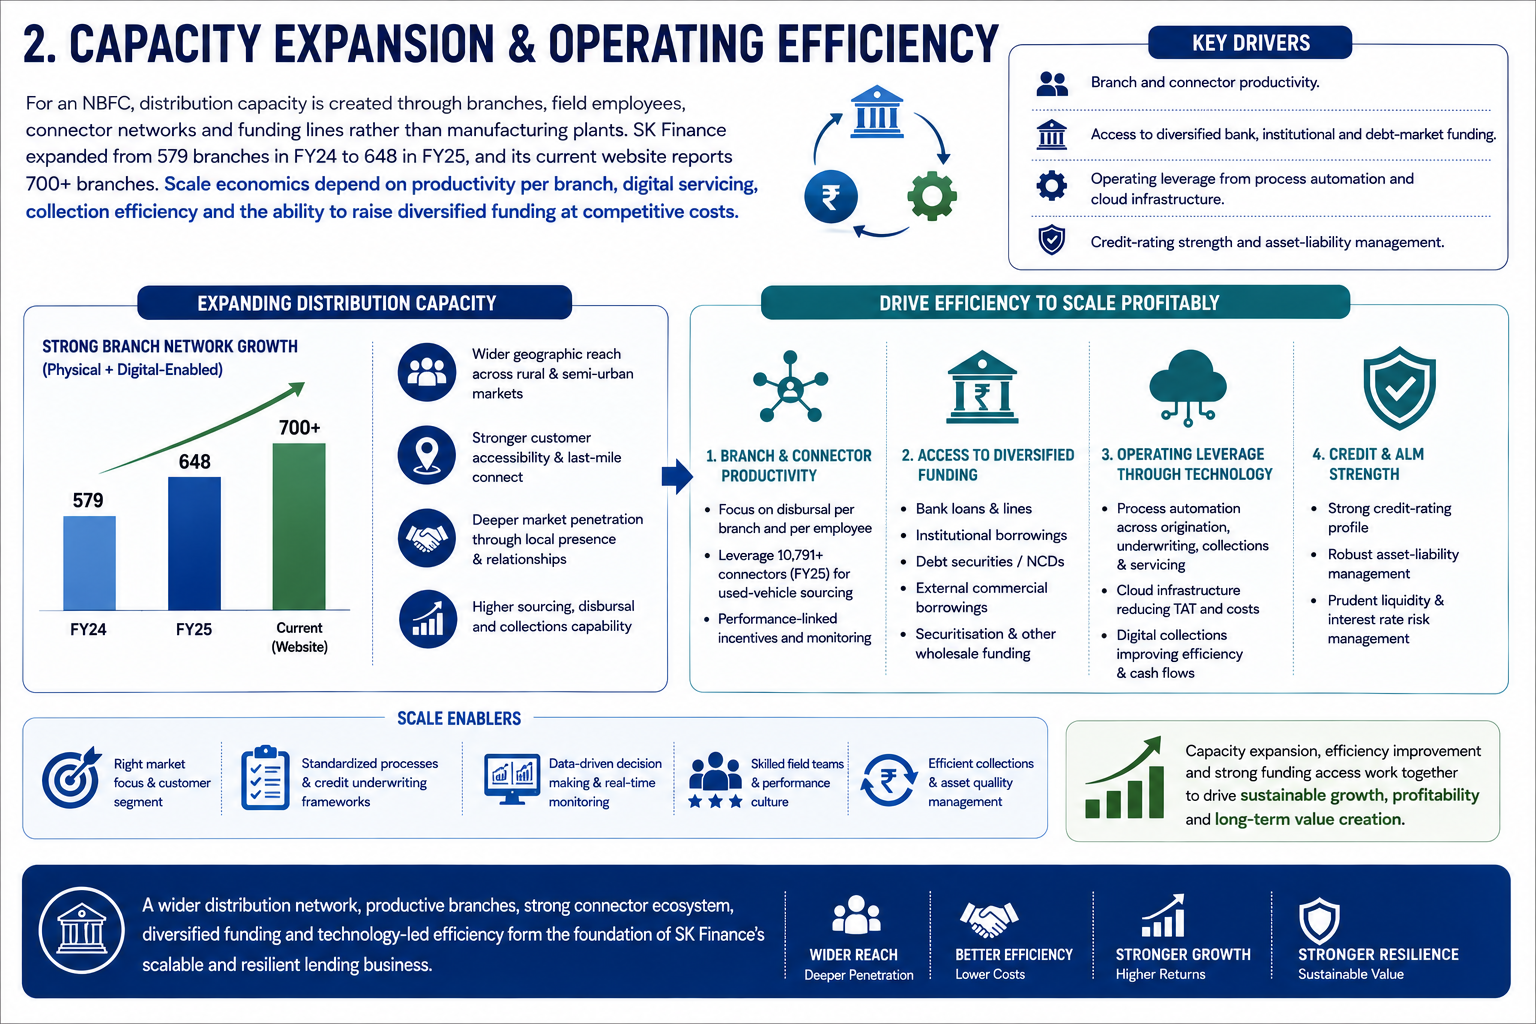
Capacity Expansion
Branch and connector productivity
Access to diversified bank, institutional and debt-market funding
Operating leverage from process automation and cloud infrastructure
Credit-rating strength and asset-liability management
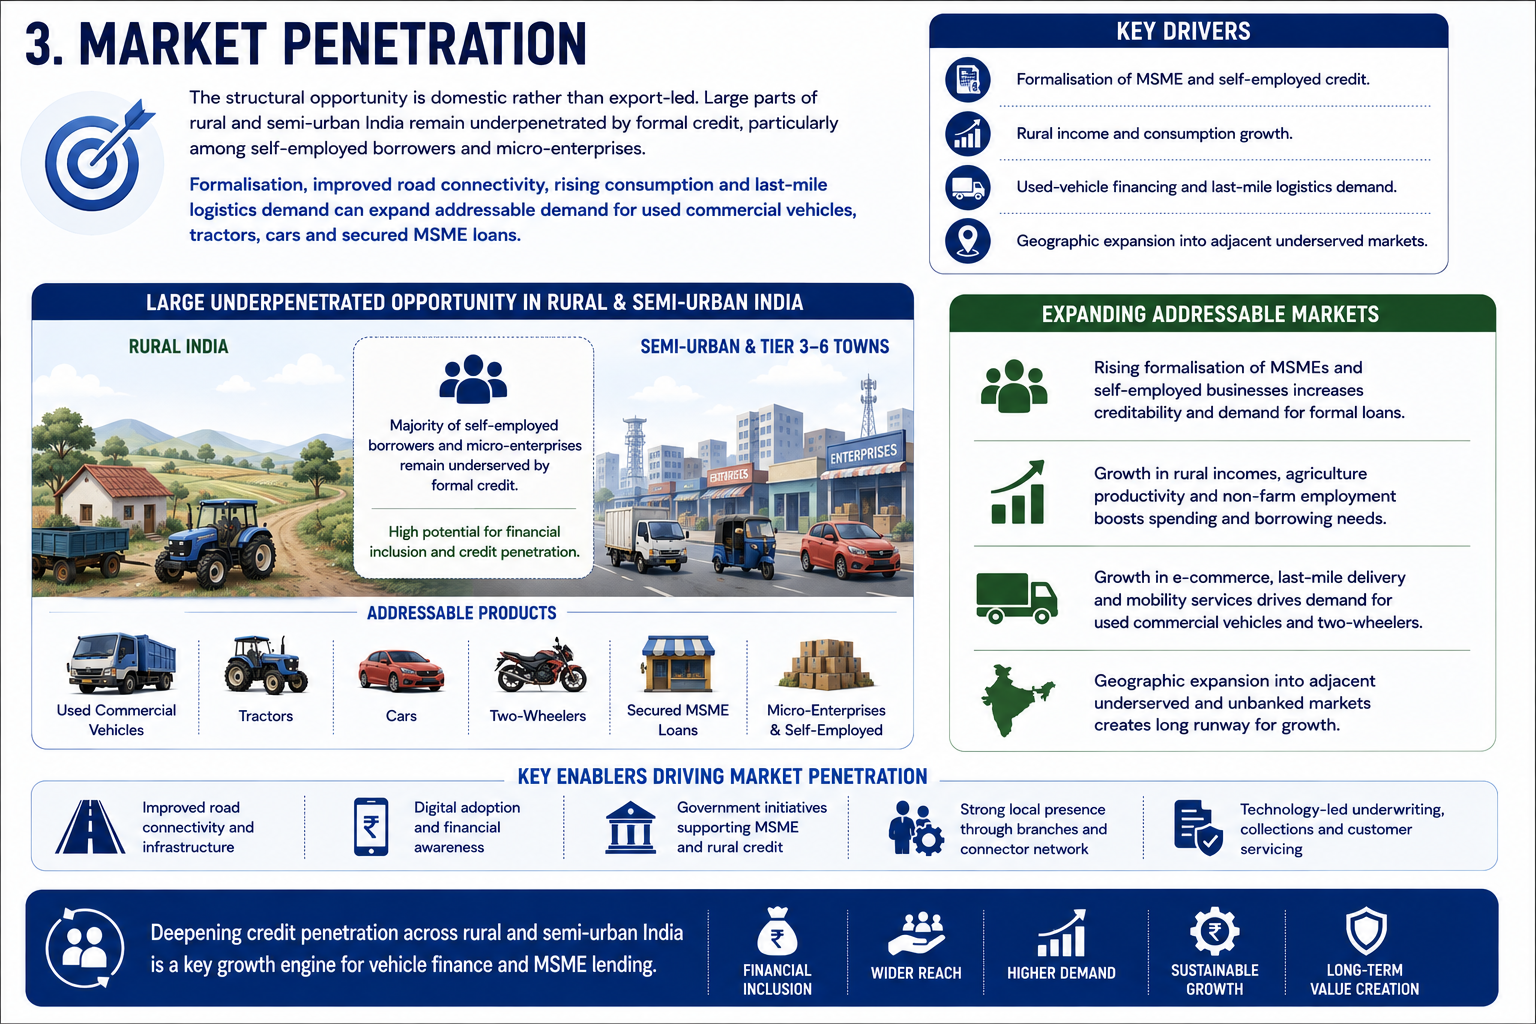
Global Market Penetration
Formalisation of MSME and self-employed credit
Rural income and consumption growth
Used-vehicle financing and last-mile logistics demand
Geographic expansion into adjacent underserved markets
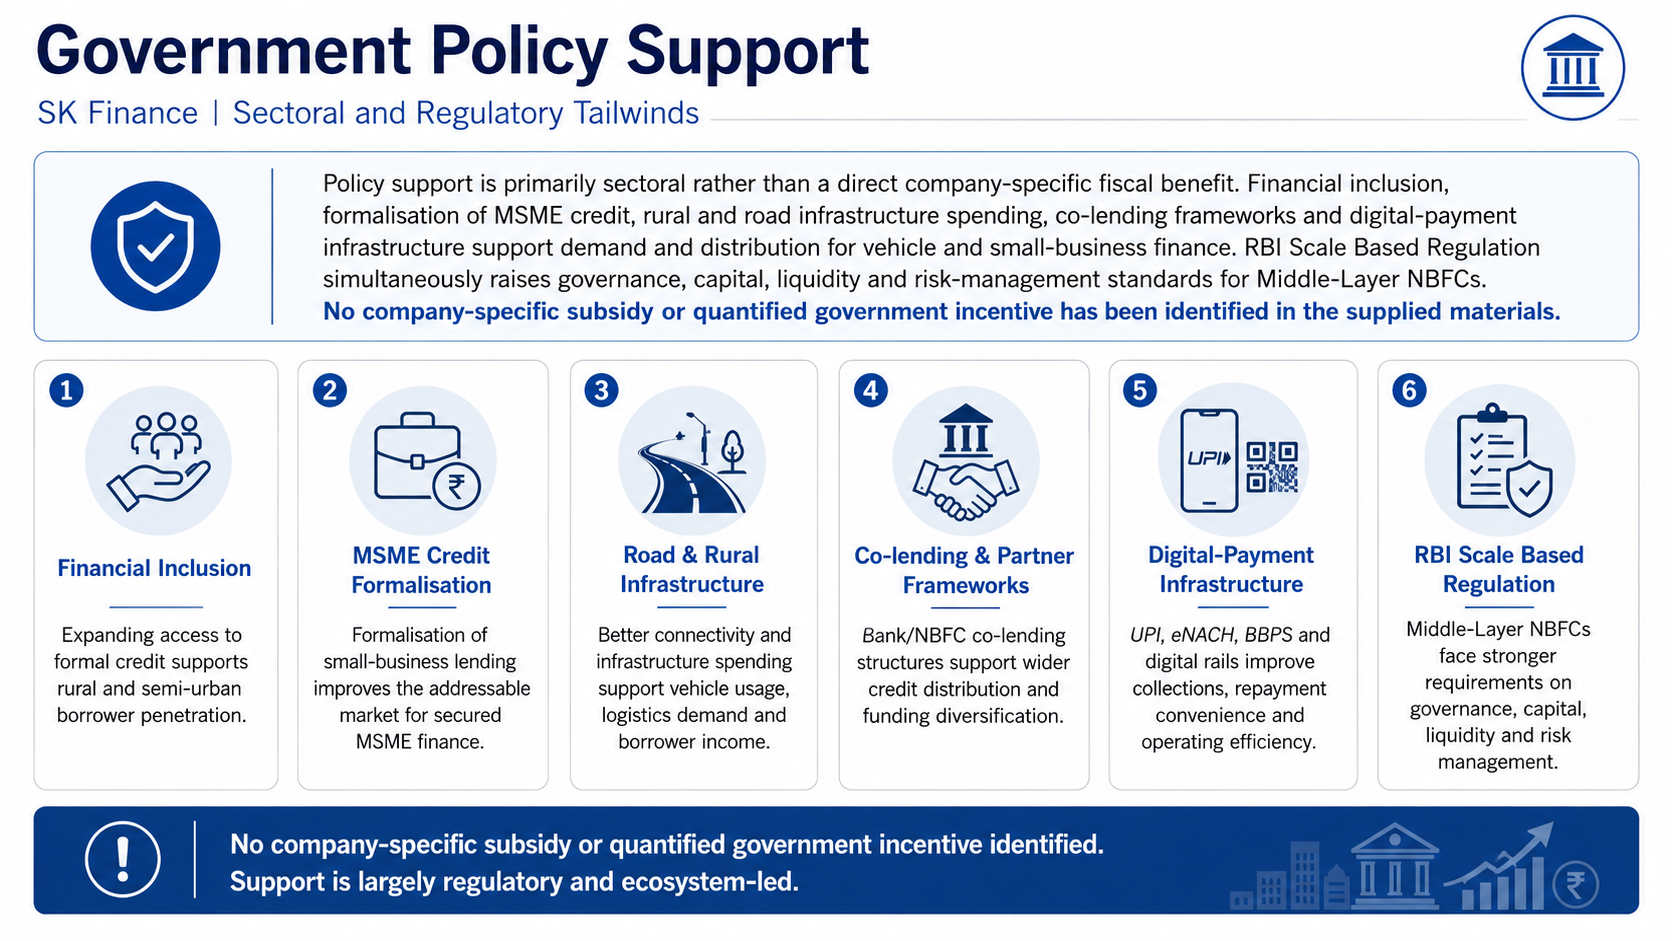
Government Policy Support
Policy support is primarily sectoral rather than a direct company-specific fiscal benefit
Financial inclusion, formalisation of MSME credit, road and rural-infrastructure spending, co-lending frameworks and digital-payment infrastructure support demand and distribution for vehicle and small-business finance
RBI scale based regulation simultaneously raises governance, capital, liquidity and risk-management standards for middle-layer NBFCs
No company-specific subsidy or quantified government incentive has been identified in the supplied materials
- Overview
- Business
- Financial Highlights
- Industry Overview
- Documentation
Get the Preqt App and keep in touch around the clock!
 Monitor your investments in real-time.
- Receive tailored deal suggestions.
- Get real-time updates and alerts.
