


SS Retail
Retailing Digital AspirationsGrowing Digital Consumers
IPO Summary (PreQT)
SS Retail Limited is a fast-growing multi-brand retail chain focused on mobile phones, pre-owned smartphones, accessories and selected consumer electronics, with a predominantly physical-store model across Maharashtra, Karnataka, Madhya Pradesh, Goa and, from FY27, Gujarat. As of March 31, 2026, the group operated 503 stores across 215 cities and 2,41,365 sq. ft.; by July 31, 2026 the network had increased to 536 stores. FY26 revenue from operations was INR 2,351.0 Cr, operating EBITDA INR 125.1 Cr and PAT INR 59.3 Cr, with revenue growing 47.1% and PAT 48.7%. Growth has been driven by rapid store additions, expansion into new states, higher mobile-phone sales and a sharp increase in pre-owned smartphone revenue through Mobile Exchange Wala. The business remains inventory- and supplier-intensive: mobile phones contributed 86.2% of FY26 revenue and the top 10 suppliers represented 79.1% of traded-goods purchases. The IPO is a fresh-issue-cum-OFS transaction of approximately INR 500.8 Cr at the cap price; the fresh issue is approximately INR 360.8 Cr, with proceeds primarily earmarked for incremental working capital and new-store fit-outs.
IPO Review Rating
Average
MainboardMaking Mobile Technology Accessible Across India’s Emerging Consumer Markets
SS Retail is a strong operating-growth story but an aggressively priced IPO. Revenue has compounded at nearly 40%, store count at 46%, operating margins are improving, RoNW is excellent at 32.6%, and store productivity compares favourably with peers. The organized mobile-retail opportunity also provides a credible structural growth runway.
The main financial risks are thin 2.5% PAT margins, inventory-heavy working capital, 86% dependence on mobile phones, 89% Maharashtra concentration and 79% top-10 supplier concentration. These do not invalidate the growth story, but they increase execution risk as the store network expands.
The most important issue is valuation. At the upper band, the conservative 52.7x post-issue P/E is ~65% above the peer average and ~167% above the peer median. The premium is partly supported by SS Retail's much stronger RoNW and faster historical growth, but the valuation already appears to price in substantial execution success.
PARAMETER
WEIGHT
SCORE
KEY FACTORS
Financial Performance
40.0%
3.0/5
SS Retail combines strong 39.6% FY24–FY26 Revenue CAGR, improving 5.3% EBITDA Margin and 32.6% RoNW with manageable leverage. However, thin 2.5% PAT Margin, inventory-heavy working capital and concentration in mobiles, Maharashtra and suppliers remain key risks
Show more
Detailed Analysis
Revenue increased from INR 1,206.7 Cr in FY24 to INR 2,351.0 Cr in FY26, a 39.6% CAGR
FY26 EBITDA was INR 125.1 Cr, with margin improving to 5.3% from 4.7% in FY24
FY26 PAT was INR 59.3 Cr, implying a relatively thin 2.5% PAT Margin
Borrowings of ~INR 162.6 Cr against Net Worth of ~INR 225.7 Cr imply ~0.7x D/E, manageable for a retail business
FY26 RoNW was a strong 32.6%
FY26 OCF improved to INR 32.5 Cr, but represented only ~55% of PAT; FY24 OCF was negative
Industry
15.0%
3.0/5
SS Retail operates in a structurally growing organised electronics retail market, supported by premiumisation and formalisation. Rapid store expansion and strong sales productivity are positives, but competition from large retail chains and online platforms remains intense
Show more
Detailed Analysis
Mobile phones & accessories market expected to grow at 9.8% CAGR FY26–FY30; modern offline retail is growing faster
Mature underlying smartphone market but strong organized-retail penetration, premiumisation and formalisation opportunities
Moderate exposure to GST, consumer regulations, lease compliance and electronics supply-chain/import policies
Management
15.0%
4.0/5
Management is promoter-led and experienced, with founder Siddharth Shah bringing over 24 years of mobile-retail experience. Board independence is adequate and promoter ownership remains strong, though recent independent appointments, related-party transactions and legal matters warrant monitoring
Show more
Detailed Analysis
Founder Siddharth Shah has 24+ years of mobile-retail experience; other promoter directors have 16+ years
8-member Board with 4 Independent Directors, though independent appointments are recent and listed-board experience is limited
Minimum promoter contribution is unpledged; litigation exposure appears manageable
Transactions are relatively small versus Revenue, but promoter loans, rentals and HUF transactions require monitoring
Valuation
20.0%
2.0/5
SS Retail's valuation is demanding, with ~65% P/E and ~41% EV/EBITDA premiums to peers. Its exceptional 32.6% RoNW partly supports the premium, but elevated earnings and book-value multiples leave limited valuation comfort despite strong growth
Show more
Detailed Analysis
SS Retail trades at a post-issue P/E of ~52.7x, representing a ~65.3% premium to the peer average of ~31.9x and a ~166.7% premium to the peer median of ~19.8x
SS Retail trades at an indicative post-raise EV/EBITDA of ~23.4x, representing a ~41% premium to the available peer average of ~16.6x
SS Retail's historical P/B is ~12.4x, representing a ~151% premium to the available peer average of ~4.9x; after adjusting for Fresh Issue proceeds, pro-forma P/B falls to ~5.4x, only ~10% above peers
SS Retail reported FY26 RoNW of 32.6%, approximately 93% higher than the peer average of ~16.9%, providing some fundamental support for its premium valuation
Merchant Banker Track Record
10.0%
4.0/5
The BRLM combination is credible but mixed, with a recent sample averaging ~17% listing gains and ~44x subscription. Anand Rathi has shown stronger consistency, while Emkay's recent record is more volatile
Show more
Detailed Analysis
Recent 8-IPO sample across the two BRLMs delivered an average ~17.0% listing gain
The same sample averaged approximately 44.4x overall subscription
6 of 8 issues, or 75%, listed above their respective issue prices
TOTAL
100%
3.0/5
Weighted Composite Score
Issue Price
₹403.0 to ₹424.0
As of 17 Sep 2026
GMP
₹105.0
As of 17 Sep 2026
Estimated Gain / Loss
+24.8%
Lot Size
35.0 Shares
Grey Market Premium (GMPs) are shared for knowledge purpose only. PrEqt doesn’t promote or execute the trades.
| Issue size | |
|---|---|
| Overall | ₹501.0 Cr |
| Fresh Issue | ₹361.0 Cr |
| Offer for Sale | ₹140.0 Cr |
Minimum Investment
₹14,840.0 / 1,225 shares

Merchant Banker
Anand Rathi Advisors Ltd., Emkay Global Financial Services Ltd
Anand Rathi Advisors Ltd.
Emkay Global Financial Services Ltd
IPO Document
Offer Start Date
Offer End Date
Valuation
Revenue (FY'26)
PAT (FY'26)
Issue Size
Face Value
₹ 10.0Offer Price
₹ 424.0Lot Size
35.0 sharesSale Type
Fresh capital cum OFSPAT (FY'26)
₹ 59.3 CrPAT Margin (FY'26)
2.5 %P/E Multiple
52.7xEBITDA (FY'26)
₹ 125.2 CrCAGR Growth 3Y
39.6 %ROE (FY'26)
30.6 %ROCE (FY'26)
29.3 %Price to Book Value
12.4xDebt/Equity
0.7xCompany Website
www.ssmobile.comExplore new deals
Overview
Fund Allocation
Total: ₹0 CrSource:Company DRHP
Timeline
IPO Open Date
To Be Announced
IPO Close Date
To Be Announced
Tentative Allotment
To Be Announced
Initiation of Refunds
To Be Announced
Credit of Shares to Demat
To Be Announced
Tentative Listing Date
To Be Announced
Business
Business Model
Geographical Presence
Sales Channel
Key Risk Factor
Financial Highlights
Income Statement
Revenue growth with EBITDA and PAT margins
| Financial Metric | FY 2024 | FY 2025 | FY 2026 |
|---|---|---|---|
| Revenue (₹ Cr) | 1,208.0 | 1,600.0 | 2,352.9 |
| Growth (%) | - | 32.4% | 47.1% |
| EBITDA (₹ Cr) | 56.5 | 80.4 | 125.2 |
| EBITDA Margin (%) | 4.7% | 5.0% | 5.3% |
| PAT (₹ Cr) | 26.7 | 39.9 | 59.3 |
| PAT Margin (%) | 2.2% | 2.5% | 2.5% |
OBSERVATIONS & INSIGHTS
Revenue FY25 growth of 32.4% and FY26 growth of 47.1% were driven primarily by store expansion (236 to 347 to 503 stores), entry into new geographies, higher mobile-phone sales and rapid scaling of Mobile Exchange Wala; FY26 also includes subsidiary consolidation
Operating EBITDA increased from INR 56.5 Cr in FY24 to INR 125.1 Cr in FY26 as gross margin improved and store scale created operating leverage despite higher franchise commissions, marketing, employee and lease-related costs. Operating EBITDA Margin expanded from 4.7% to 5.3%, supported by higher gross margin and scale efficiencies; the improvement remains modest because electronics retail is structurally low-margin and competitive
PAT increased 49.6% in FY25 and 48.7% in FY26 as revenue and operating EBITDA grew faster than finance and depreciation costs. PAT Margin improved from 2.2% in FY24 to 2.5% in FY25 and remained broadly stable at 2.5% in FY26; operating leverage and better gross margin were partly offset by rising finance cost, lease depreciation, commissions and store-expansion overhead
Balance Sheet
| Financial Metric | FY 2024 | FY 2025 | FY 2026 |
|---|---|---|---|
| Net Worth | ₹ 101.5 Cr | ₹ 141.4 Cr | ₹ 225.7 Cr |
| Total Assets | ₹ 278.3 Cr | ₹ 389.4 Cr | ₹ 575.4 Cr |
| Total Borrowing | ₹ 110.4 Cr | ₹ 125.4 Cr | ₹ 162.6 Cr |
| Reserves & Surplus | ₹ 88.5 Cr | ₹ 128.2 Cr | ₹ 159.6 Cr |
OBSERVATIONS & INSIGHTS
Inventory increased from INR 140.5 Cr in FY24 to INR 322.4 Cr in FY26 as store count and product breadth expanded; it remains the dominant current asset and principal working-capital requirement
Trade receivables increased in FY25 but reduced to INR 11.7 Cr in FY26, consistent with the cash-and-finance-led B2C collection model
Right-of-use assets / lease liabilities increased sharply with store expansion, showing that network growth carries a meaningful lease commitment even where store fit-outs are franchise-supported
Goodwill and intangibles increased in FY26 mainly because of subsidiary / brand-related acquisitions, creating a new acquisition-linked balance-sheet component
Other equity / reserves increased to INR 159.6 Cr and total equity to INR 231.3 Cr as retained profits and capital changes strengthened the equity base
Borrowings current borrowings increased to INR 160.6 Cr in FY26 to support higher inventory and working capital; net debt/equity nonetheless improved because equity grew faster
Trade payables increased to INR 44.3 Cr in FY26, reflecting higher scale and timing of year-end purchases; this materially supported FY26 operating cash flow
Cash Flow
| Financial Metric | FY 2024 | FY 2025 | FY 2026 |
|---|---|---|---|
CFO in Cr Cash generated from core business operations. | -4.9 Cr | +1.4 Cr | +32.5 Cr |
CFI in Cr Cash used in / generated from investing activities. | -13.6 Cr | -11.1 Cr | -30.7 Cr |
CFF in Cr Cash from / used in financing activities. | +40.1 Cr | +7.2 Cr | +1.8 Cr |
Working Capital
| Efficiency Metric | FY 2023 | FY 2024 | FY 2025 |
|---|---|---|---|
Debtor Days Average number of days taken to collect customer payments. | - | - | - |
Creditor Days Average time taken to pay suppliers and vendors. | - | - | - |
Inventory Days Average number of days inventory remains unsold. | - | - | - |
CCC (Cash Conversion Cycle) (Debtor Days + Inventory Days - Creditor Days) | - | - | - |
Financial Ratios
Measures the company’s leverage relative to shareholder equity.
OBSERVATIONS & INSIGHTS
ROE remained around 30% across the period, showing strong profit generation relative to the equity base despite rapid store expansion
ROCE improved to 29.3% in FY26 as EBIT growth outpaced the expansion in average capital employed
ROA increased gradually to 10.3% on the PrEqt closing-balance proxy as PAT scaled faster than total assets
Current Ratio improved in FY25 and moderated to 1.7x in FY26 as inventory and other current assets expanded alongside higher current borrowings and payables
Interest Coverage improved from about 4.5x to 5.9x as operating profit grew faster than finance costs
Industry Overview
Industry Drivers
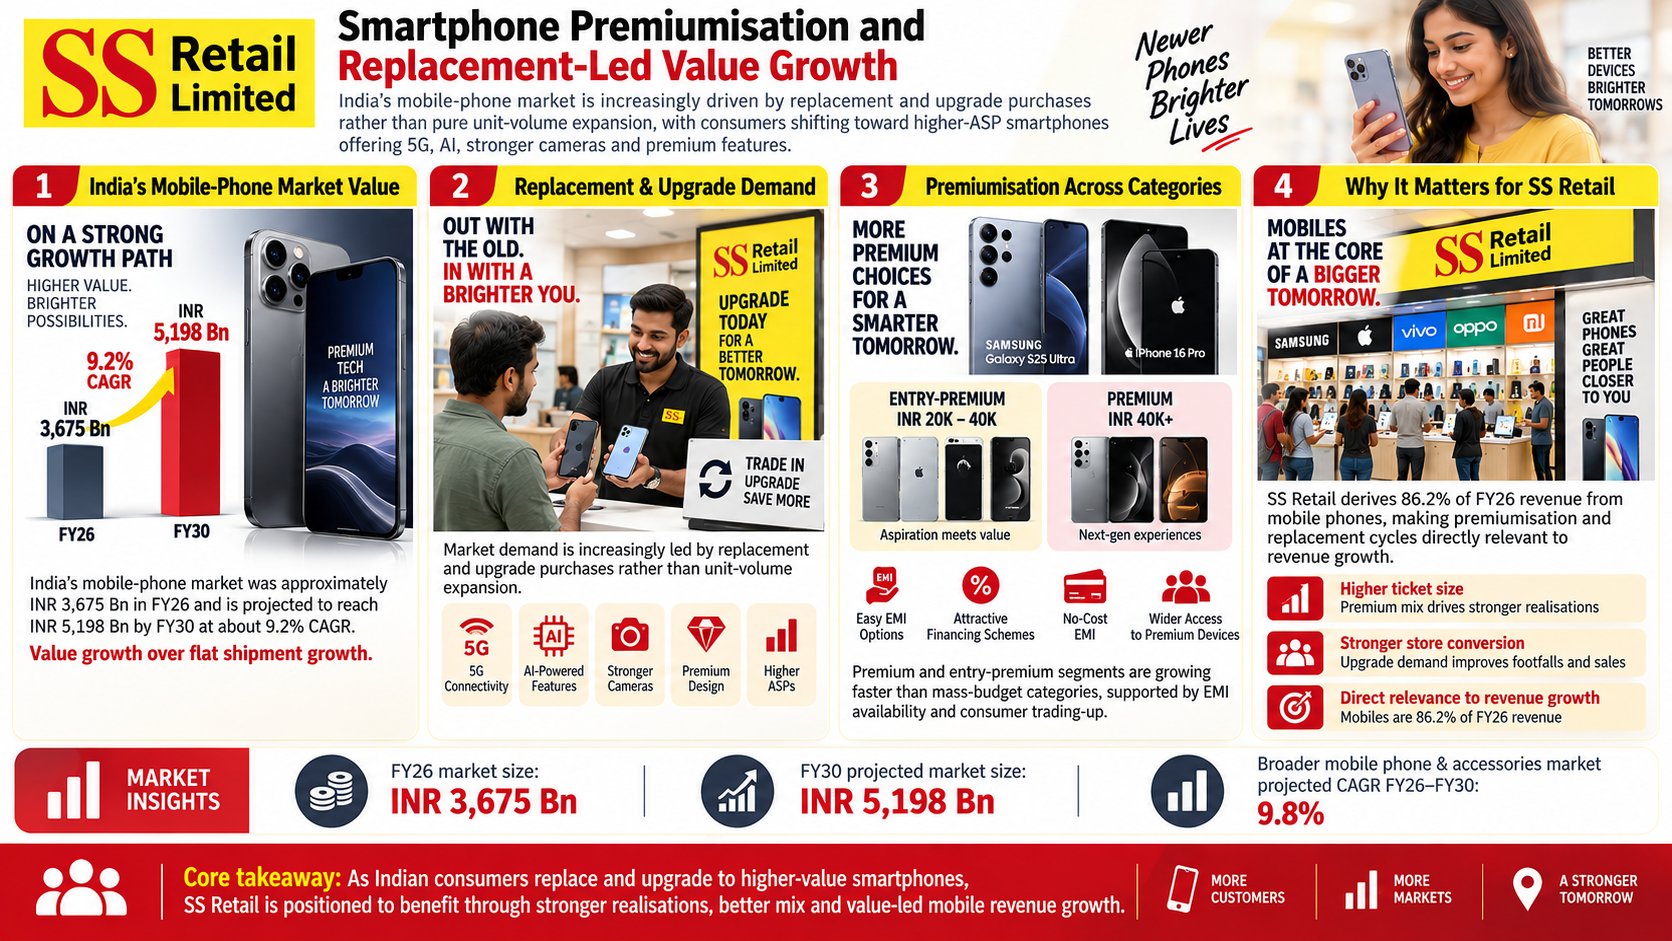
Smartphone Premiumisation and Replacement-Led Value Growth
The Indian mobile-phone market is increasingly driven by replacement and upgrade purchases rather than unit-volume expansion. Consumers are moving toward higher-ASP smartphones with 5G, AI, better cameras and premium features, which supports value growth even when shipments remain relatively flat.
• India's mobile-phone market was approximately INR 3,675 Bn in FY26 and is projected to reach INR 5,198 Bn by FY30 at about 9.2% CAGR
• The broader mobile phone and accessories market is projected to grow at about 9.8% CAGR from FY26 to FY30
• Premium and entry-premium segments are growing faster than mass-budget categories, supported by EMI availability and consumer trading-up
• SS Retail derives 86.2% of FY26 revenue from mobile phones, making premiumisation and replacement cycles directly relevant to revenue growth
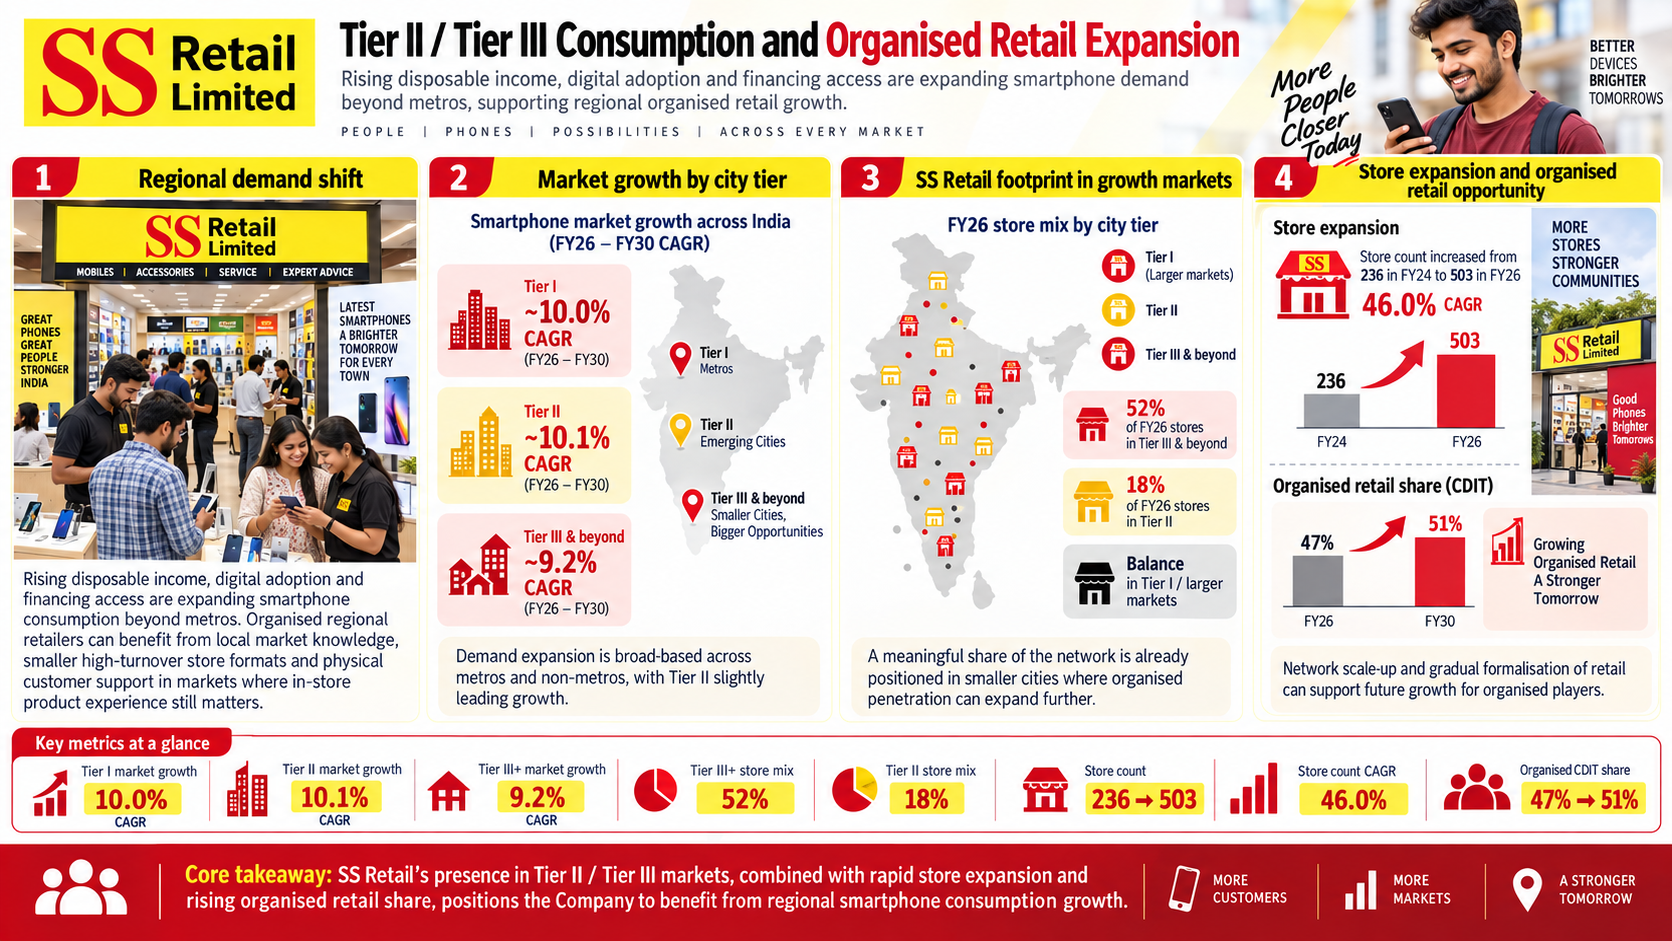
Tier II / Tier III Consumption and Organised Retail Expansion
Rising disposable income, digital adoption and financing access are expanding smartphone consumption beyond metros. Organised regional retailers can benefit from local market knowledge, smaller high-turnover formats and physical customer support in cities where customers still value in-store product experience./
The key drivers are:
Tier I and Tier II mobile-phone markets are projected to grow around 10.0% and 10.1% CAGR, respectively, from FY26 to FY30; Tier III and beyond is projected near 9.2%
Approximately 52% of SS Retail's FY26 stores were in Tier III and beyond cities, with another 18% in Tier II
The Company increased store count from 236 in FY24 to 503 in FY26, a 46.0% CAGR
Organised CDIT retail share is projected to increase from about 47% in FY26 to 51% by FY30
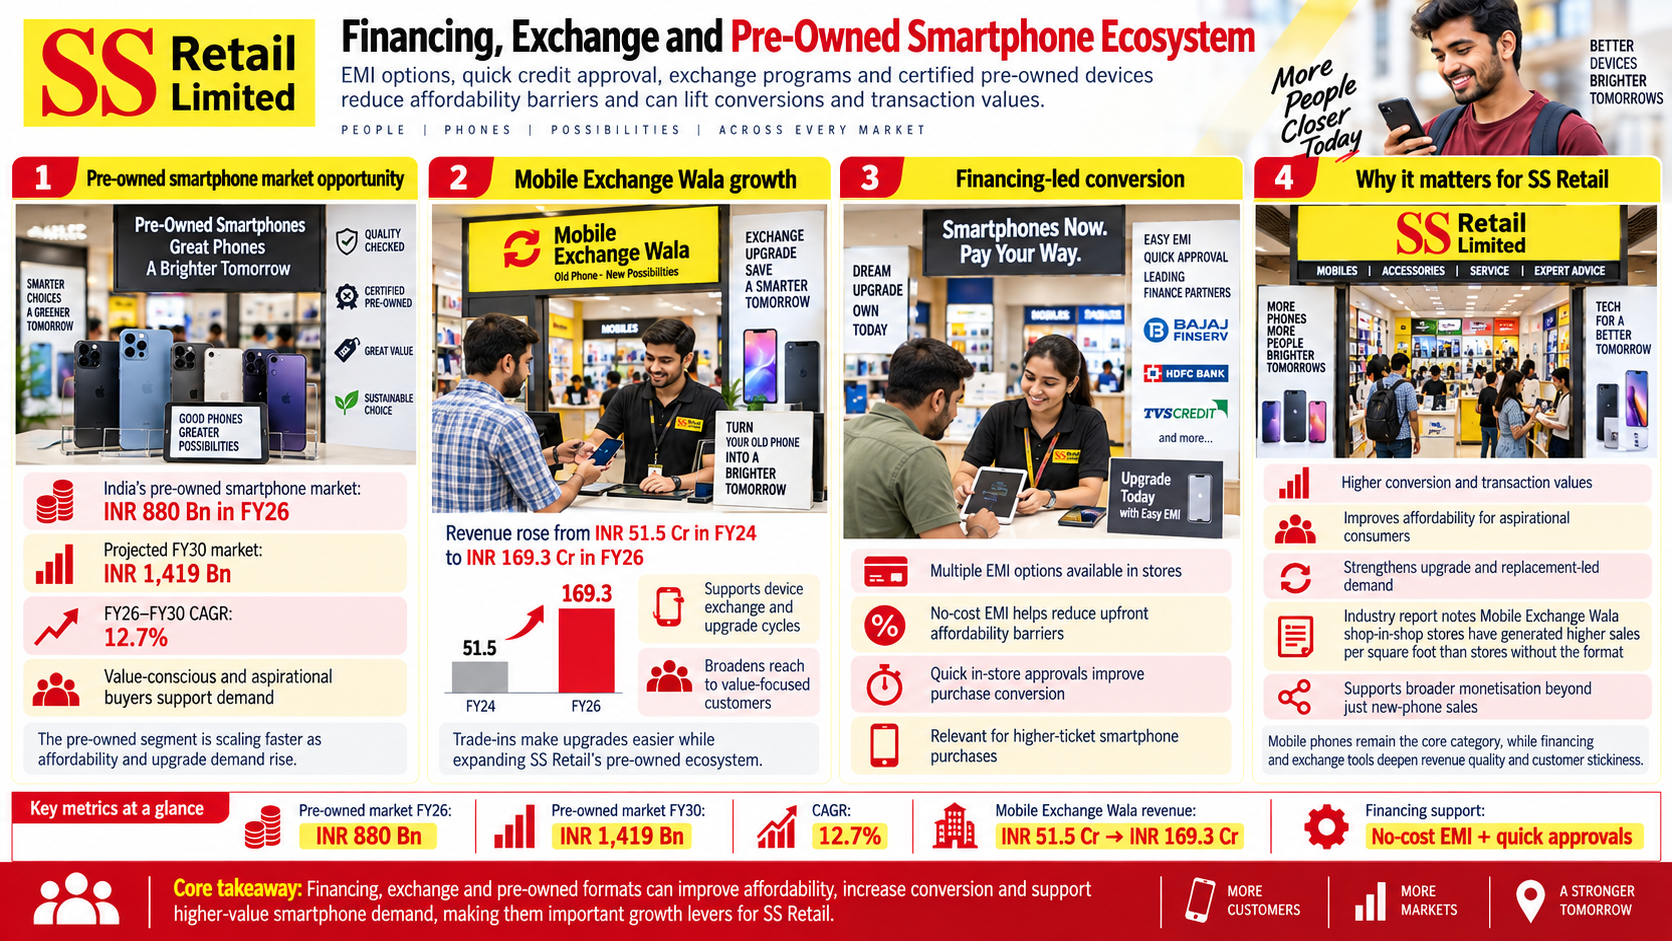
Financing, Exchange and Pre-Owned Smartphone Ecosystem
No-cost EMI, quick credit approval, exchange programs and certified pre-owned devices reduce the upfront affordability barrier for smartphones. These tools are particularly relevant for aspirational and value-conscious consumers and can increase conversion and transaction values.
India's pre-owned smartphone market reached about INR 880 Bn in FY26 and is projected to reach INR 1,419 Bn by FY30 at 12.7% CAGR
SS Retail's Mobile Exchange Wala revenue increased from INR 51.5 Cr in FY24 to INR 169.3 Cr in FY26
The Company's stores host financing kiosks offering multiple EMI options, including no-cost EMI and quick in-store approvals
The industry report notes that Mobile Exchange Wala shop-in-shop stores have generated higher sales per square foot than stores without the format
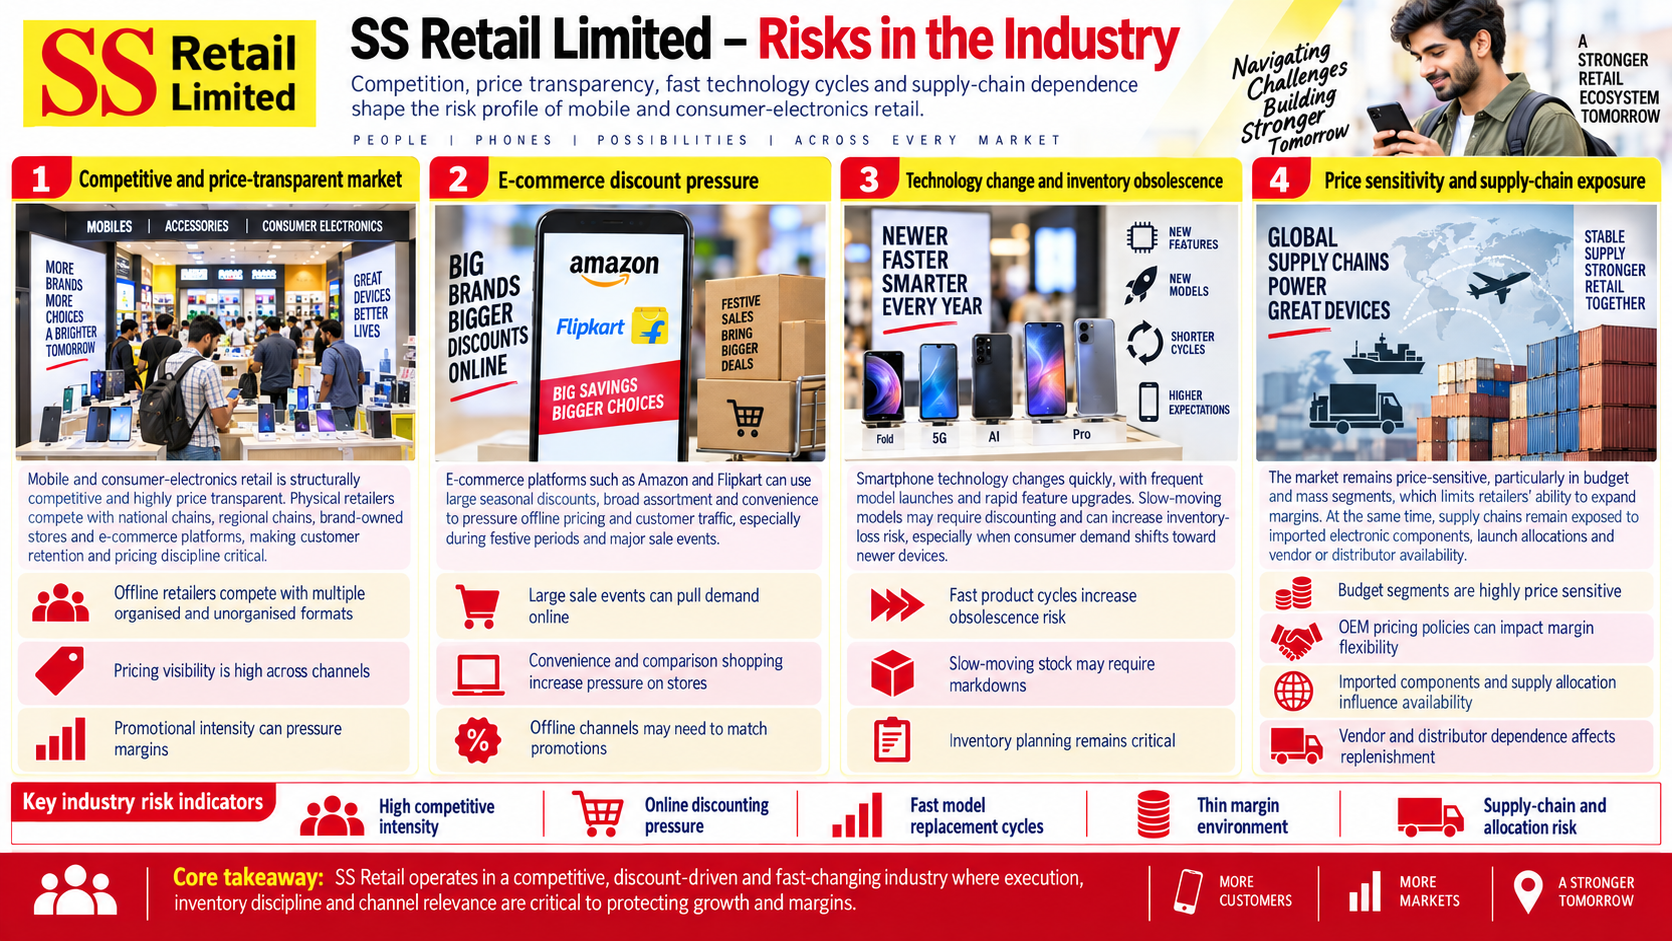
Risks in the Industry
Mobile and consumer-electronics retail is structurally competitive and price transparent. Physical retailers compete with national chains, regional chains, brand-owned stores and e-commerce platforms, while rapid model launches and changing technology can create inventory obsolescence. Retail margins can also be pressured by discounting, OEM pricing policies and promotional intensity.
The key risk pointers are:
E-commerce platforms such as Amazon and Flipkart can use large seasonal discounts and convenience to pressure offline pricing
Smartphone technology changes quickly; slow-moving models may require discounting and can increase inventory-loss risk
The market remains price-sensitive, particularly in budget and mass segments, limiting retailers' ability to expand margins
Supply chains remain exposed to imported electronic components, launch allocations and vendor / distributor availability
Government Policy Support
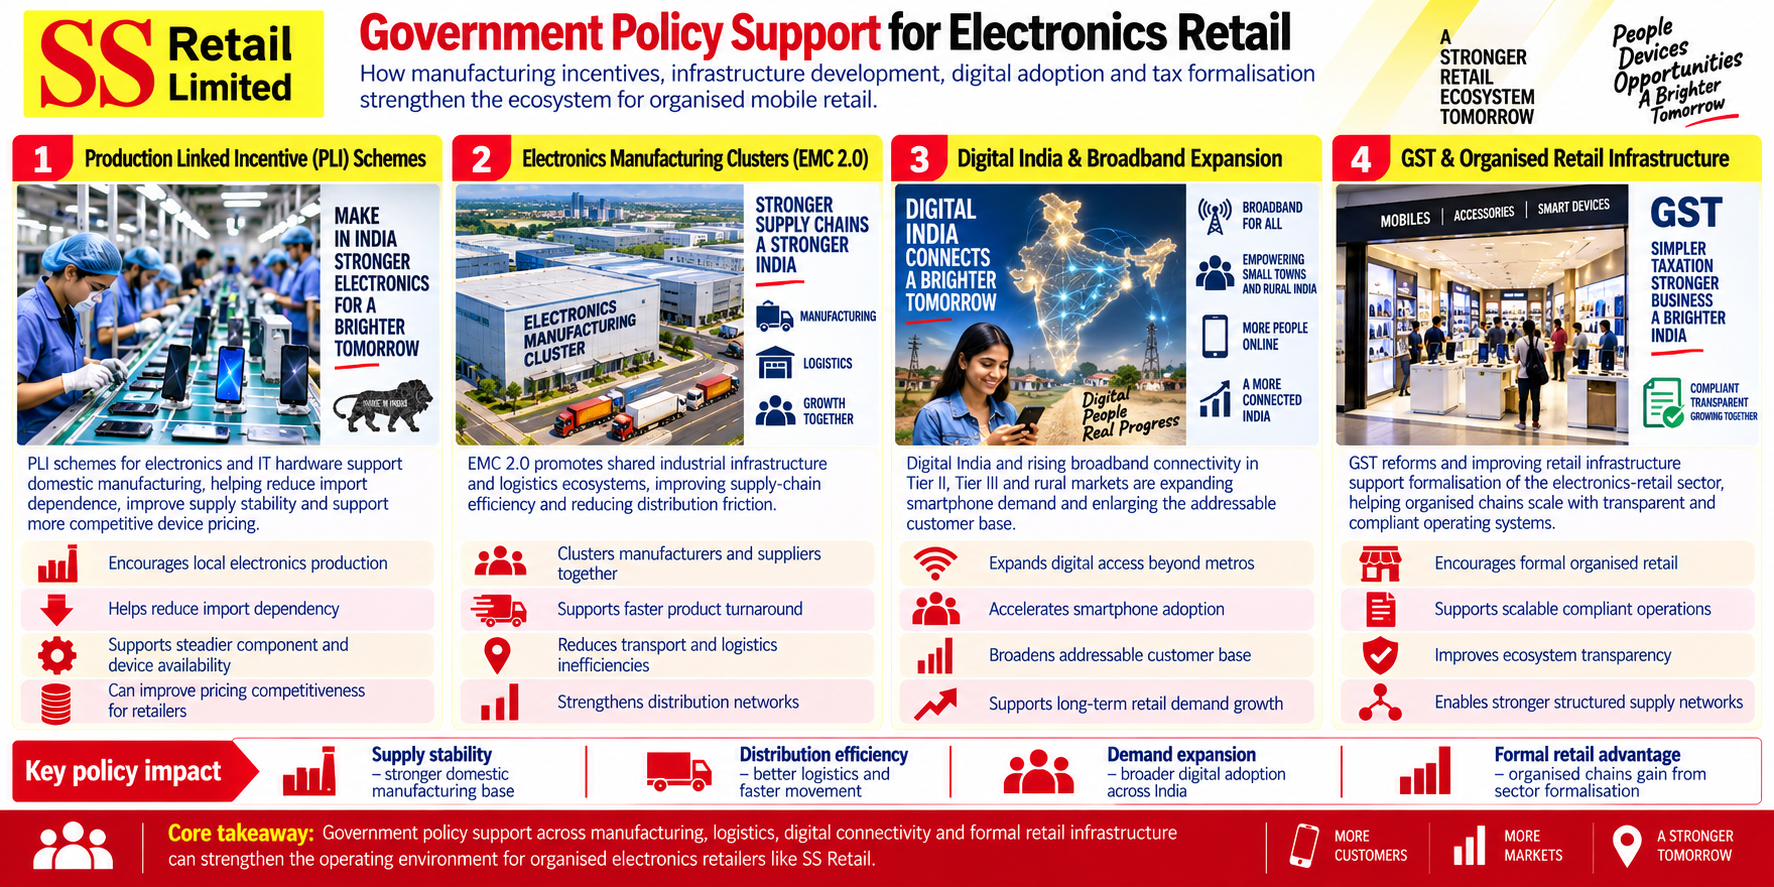
Policy support is indirect but relevant through domestic electronics manufacturing, digital connectivity, formalisation of retail and financing / infrastructure development. These initiatives can increase device availability, improve supply-chain efficiency and expand the addressable customer base in smaller cities.
Electronics Manufacturing Clusters (EMC 2.0): The EMC 2.0 initiative focuses on creating world-class infrastructure and shared logistics ecosystems. By clustering manufacturers, component suppliers, and logistics providers together, this policy drastically improves supply-chain efficiency. For retail chains, this translates to faster product turnaround times, reduced transport costs, and streamlined distribution networks
Digital India & Broadband Expansion: The Digital India mission and the rapid expansion of rural broadband connectivity act as massive demand drivers. By bringing high-speed internet to tier-2, tier-3, and rural markets, the government is accelerating smartphone adoption. This expanding digital network continuously broadens the addressable customer base for mobile devices and digital services
GST & Organized Retail Infrastructure: Goods and Services Tax (GST) reforms have accelerated the formalisation of the retail sector. This shift penalises fragmented, informal retail while rewarding compliant operations. Combined with infrastructure development, it enables organised retail chains to scale efficiently, maintain transparent financial ecosystems, and build robust, legally compliant supply networks
Fundraise/Future Plans
Shareholding
Pre-issue shareholding
Promoter Holding 0.0%
Post-Issue Shareholding
Promoter Holding 0.0%
Category
Pre-Issue%Post-Issue%
Promoters
Siddharth Gunvant Shah
51.0%43.8%
Deepa Siddharth Shah
13.3%11.3%
Harshal Kishor Parekh
8.4%7.2%
Bhavini Harshal Parekh
3.0%2.5%
Total Promoter Holding
75.7%64.8%
Additional Shareholders
Other Shareholders
24.3%35.1%
Total Additional Holding
24.3%35.1%
Total Shareholding
100.0%99.9%
- Overview
- Business
- Financial Highlights
- Industry Overview
- Fundraise/Future Plans
- Documentation
Get the Preqt App and keep in touch around the clock!
 Monitor your investments in real-time.
- Receive tailored deal suggestions.
- Get real-time updates and alerts.
