


Swastika Infra
Powering Infrastructure ProgressBuilding India’s Energy Backbone
IPO Summary (PreQT)
Swastika Infra Limited is a Jaipur-based EPC company focused on power transmission and distribution infrastructure, with roots in the promoter family’s electrical business established in 1969. The Company entered power-distribution EPC in 2012 and was incorporated in its present form in 2019. Its turnkey capabilities include underground cabling, GIS/AIS and grid substations, electrification, feeder works, street lighting and related infrastructure. As of July 31, 2026, it had completed 36 projects worth approximately INR 764.7 Cr and had 18 ongoing projects worth INR 2,036.7 Cr. The unexecuted order book stood at INR 916.6 Cr, equivalent to around 1.8x FY26 revenue. Government utilities contributed 96.9% of FY26 revenue and 100.0% of the July 2026 order book. The IPO comprises 86,95,946 shares at INR 175.0-INR 185.0 per share, with a total issue size of approximately INR 160.9 Cr at the cap price. Of the fresh issue proceeds, INR 90.0 Cr is proposed for incremental working capital, with the balance for general corporate purposes after offer expenses.
IPO Review Rating
Below Avg
MainboardDelivering Reliable Electrical Infrastructure Through Engineering and Execution Excellence
Swastika Infra has delivered strong financial growth, with Revenue increasing from INR 209.6 Cr in FY24 to INR 503.6 Cr in FY26, implying a 55.0% CAGR, while FY26 PAT reached INR 41.4 Cr, EBITDA margin stood at 14.1% and RoNW at 35.4%. However, cash conversion remains a key concern, with operating cash flow negative for three consecutive years, supporting the proposed INR 90.0 Cr working-capital deployment from IPO proceeds. Concentration is also high, with government utilities contributing 96.9% of FY26 Revenue and 100.0% of the July 2026 order book. Governance benefits from 50.0% Board independence and 57.4% post-IPO promoter ownership, although the OFS and existing proceedings remain monitorables. At 15.2x P/E and 3.21x P/B, valuation carries a premium to peers, partly supported by high RoNW but tempered by weak cash conversion and customer concentration.
PARAMETER
WEIGHT
SCORE
KEY FACTORS
Financial Performance
40.0%
3.0/5
Swastika has delivered exceptional 55.0% Revenue CAGR, healthy 14.1% EBITDA margins, 8.2% PAT margins and 35.4% RoNW. The financial profile is held back mainly by three consecutive years of negative operating cash flow and extremely high government/client concentration
Show more
Detailed Analysis
Revenue increased from INR 209.6 Cr in FY24 to INR 503.6 Cr in FY26, implying a very strong 55.0% CAGR
FY26 EBITDA margin was 14.1%, healthy for an EPC contractor and broadly within the disclosed peer range
FY26 PAT of INR 41.4 Cr implies an 8.2% PAT margin, with no material exceptional-item dependence evident in the reported KPI set
FY26 borrowings were INR 114.6 Cr and D/E was 0.7x, higher than listed peers but still manageable
FY26 RoNW / RoE was a strong 35.4%
Operating cash flow was negative in FY24, FY25 and FY26, including approximately INR -9.7 Cr in FY26
Government utilities contributed 96.9% of FY26 revenue; the top five clients also accounted for 96.9% and the top ten for 99.6%
Industry
15.0%
3.0/5
Swastika operates in a structurally expanding Indian Power EPC market, with transmission presenting particularly attractive growth prospects. However, the industry remains working-capital intensive, tender-driven and exposed to government-policy and payment-cycle risk.
Show more
Detailed Analysis
India Power EPC market is projected to grow at 8.8% CAGR during 2024–2030; transmission at 11.6% and distribution at 6.4%
Dependence on government utilities exposes contractors to tender rules, qualification criteria, policy changes, budget allocations and payment delays
Swastika's disclosed project base is domestic; no meaningful international revenue opportunity is presently demonstrated
Management
15.0%
4.0/5
Swastika scores well on promoter experience, 50.0% Board independence and continuing promoter ownership. Governance deductions arise mainly from existing litigation/tax matters, related-party dealings and the 20.1% OFS, rather than from a structural control concern.
Show more
Detailed Analysis
The operating business traces its roots to 1969 and has been executing power-distribution EPC projects since 2012; promoters have long sector experience
3 of 6 Directors are Independent which comes to 50.0%, including an Independent Woman Director
No direct promoter-share pledge issue was identified in the material reviewed; however, company-level civil litigation and tax proceedings require monitoring
RPTs in the ordinary course represented approximately 4.0% of FY26 Revenue, a manageable but relevant governance monitor
Valuation
20.0%
3.0/5
Swastika is priced at a 15.2x post-Issue P/E, around 23.4% above its two disclosed peers on a simple-average basis, while P/B carries an even larger premium. Strong growth and RoNW provide support, but cash conversion and concentration risks reduce the comfort available for paying a substantial premium
Show more
Detailed Analysis
15.2x post-Issue P/E versus approximately 12.4x peer average, implying a 23.4% premium
A sufficiently consistent current peer EV/EBITDA dataset was not available from the RHP data
Swastika's 3.2x P/B compares with approximately 2.4x average for the two disclosed peers a 33.8% premium
FY26 RoNW of 35.4% is very strong and materially supports the valuation
Merchant Banker Track Record
10.0%
4.0/5
The BRLM combination has a positive historical issue-performance record, but it is not directly comparable with the much deeper mainboard histories of India's largest institutional investment banks. Srujan's strong record has primarily been built in SME IPOs, while PhillipCapital provides the more relevant mainboard execution experience
Show more
Detailed Analysis
Nine identifiable historical IPO observations across the two BRLMs imply approximately 15.8% average listing gain, although eight of these observations are Srujan-led SME IPOs
Srujan's disclosed SME mandates have generally attracted healthy subscriptions; PhillipCapital's Vikram Solar IPO was subscribed 54.6x, including 142.8x QIB demand
The reviewed Srujan issues and PhillipCapital's Vikram Solar example all opened above their respective issue prices, but the sample is heavily SME-oriented
TOTAL
100%
3.3/5
Weighted Composite Score
Issue Price
₹175.0 to ₹185.0
As of 22 Sep 2026
GMP
₹10.0
As of 22 Sep 2026
Estimated Gain / Loss
+5.4%
Lot Size
81.0 Shares
Grey Market Premium (GMPs) are shared for knowledge purpose only. PrEqt doesn’t promote or execute the trades.
| Issue size | |
|---|---|
| Overall | ₹161.0 Cr |
| Fresh Issue | ₹128.0 Cr |
| Offer for Sale | ₹32.0 Cr |
Minimum Investment
₹14,985.0 / 6,561 shares

Merchant Banker
Srujan Alpha Capital Advisors LLP, PhillipCapital (India) Private Limited
Srujan Alpha Capital Advisors LLP
PhillipCapital (India) Private Limited
IPO Document
Offer Start Date
Offer End Date
Valuation
Revenue (FY'26)
PAT (FY'26)
Issue Size
Face Value
₹ 10.0Offer Price
₹ 185.0Lot Size
81.0 sharesSale Type
Fresh capital cum OFSPAT (FY'26)
₹ 41.4 CrPAT Margin (FY'26)
8.2 %P/E Multiple
15.2xEBITDA (FY'26)
₹ 70.9 CrCAGR Growth 2Y
55.4 %ROE (FY'26)
35.4 %ROCE (FY'26)
25.8 %Price to Book Value
3.2xDebt/Equity
0.7xCompany Website
www.swastikainfra.comExplore new deals
Overview
Fund Allocation
Total: ₹0 CrSource:Company DRHP
Timeline
IPO Open Date
To Be Announced
IPO Close Date
To Be Announced
Tentative Allotment
To Be Announced
Initiation of Refunds
To Be Announced
Credit of Shares to Demat
To Be Announced
Tentative Listing Date
To Be Announced
Business
Business Model
Geographical Presence
Sales Channel
Key Risk Factor
Financial Highlights
Income Statement
Revenue growth with EBITDA and PAT margins
| Financial Metric | FY 2024 | FY 2025 | FY 2026 |
|---|---|---|---|
| Revenue (₹ Cr) | 209.6 | 350.8 | 503.6 |
| Growth (%) | - | 67.4% | 43.6% |
| EBITDA (₹ Cr) | 23.7 | 43.9 | 70.9 |
| EBITDA Margin (%) | 11.3% | 12.5% | 14.1% |
| PAT (₹ Cr) | 14.0 | 27.5 | 41.4 |
| PAT Margin (%) | 6.7% | 7.8% | 8.2% |
OBSERVATIONS & INSIGHTS
Revenue from operations increased 67.4% in FY25 and 43.6% in FY26, reflecting a rapid scaling of project execution
EBITDA rose from INR 23.7 Cr in FY24 to INR 70.9 Cr in FY26, while EBITDA margin expanded from 11.3% to 14.1%, indicating improved operating leverage and project mix
PAT almost doubled in FY25 and increased a further 50.9% in FY26 to INR 41.4 Cr. PAT margin improved consistently to 8.2% in FY26
Balance Sheet
| Financial Metric | FY 2024 | FY 2025 | FY 2026 |
|---|---|---|---|
| Net Worth | ₹ 49.6 Cr | ₹ 77.0 Cr | ₹ 156.8 Cr |
| Total Assets | ₹ 143.3 Cr | ₹ 258.5 Cr | ₹ 412.2 Cr |
| Reserves & Surplus | ₹ 24.8 Cr | ₹ 52.3 Cr | ₹ 129.6 Cr |
| Total borrowings | ₹ 43.8 Cr | ₹ 111.0 Cr | ₹ 114.6 Cr |
OBSERVATIONS & INSIGHTS
Net worth increased from INR 49.6 Cr in FY24 to INR 156.8 Cr in FY26, supported by retained earnings and pre-IPO capital raising
Other assets represent a large share of the balance sheet and include project-related current assets such as deposits, retention money, advances and unbilled revenue
Total borrowings increased sharply in FY25 to fund working-capital expansion and remained broadly stable at INR 114.6 Cr in FY26
Cash Flow
| Financial Metric | FY 2024 | FY 2025 | FY 2026 |
|---|---|---|---|
CFO (₹ Cr) Cash generated from core business operations. | -3.3 Cr | -76.5 Cr | -9.7 Cr |
CFI (₹ Cr) Cash used for investments and long-term assets. | -22.7 Cr | +14.2 Cr | -16.3 Cr |
CFF (₹ Cr) Cash flow related to funding and borrowings. | +16.5 Cr | +60.7 Cr | +27.1 Cr |
Working Capital
| Efficiency Metric | FY 2023 | FY 2024 | FY 2025 |
|---|---|---|---|
Debtor Days Average number of days taken to collect customer payments. | - | - | - |
Creditor Days Average time taken to pay suppliers and vendors. | - | - | - |
Inventory Days Average number of days inventory remains unsold. | - | - | - |
CCC (Cash Conversion Cycle) (Debtor Days + Inventory Days - Creditor Days) | - | - | - |
Financial Ratios
Measures the company’s leverage relative to shareholder equity.
OBSERVATIONS & INSIGHTS
Return on Equity increased to 43.4% in FY25 before moderating to 35.4% in FY26 as the equity base expanded following pre-IPO capital raising
Debt / Equity increased to 1.4x in FY25 as working-capital borrowings expanded, then improved to 0.7x in FY26 following stronger equity and retained earnings
The Interest Coverage Ratio improved from 4.1x in FY24 to 5.5x in FY25 before moderating to 4.3x in FY26 as finance costs rose to support larger working-capital requirements
Current Ratio remained above 1.0x throughout the period and improved to 1.6x in FY26, though the quality of current assets is influenced by receivables, retention money and unbilled revenue
RoCE remained above 23.0% across FY24-FY26 and recovered to 25.8% in FY26, indicating strong accounting returns on the capital employed despite cash-flow absorption
Industry Overview
Industry Drivers
Rising Power Demand and Electrification
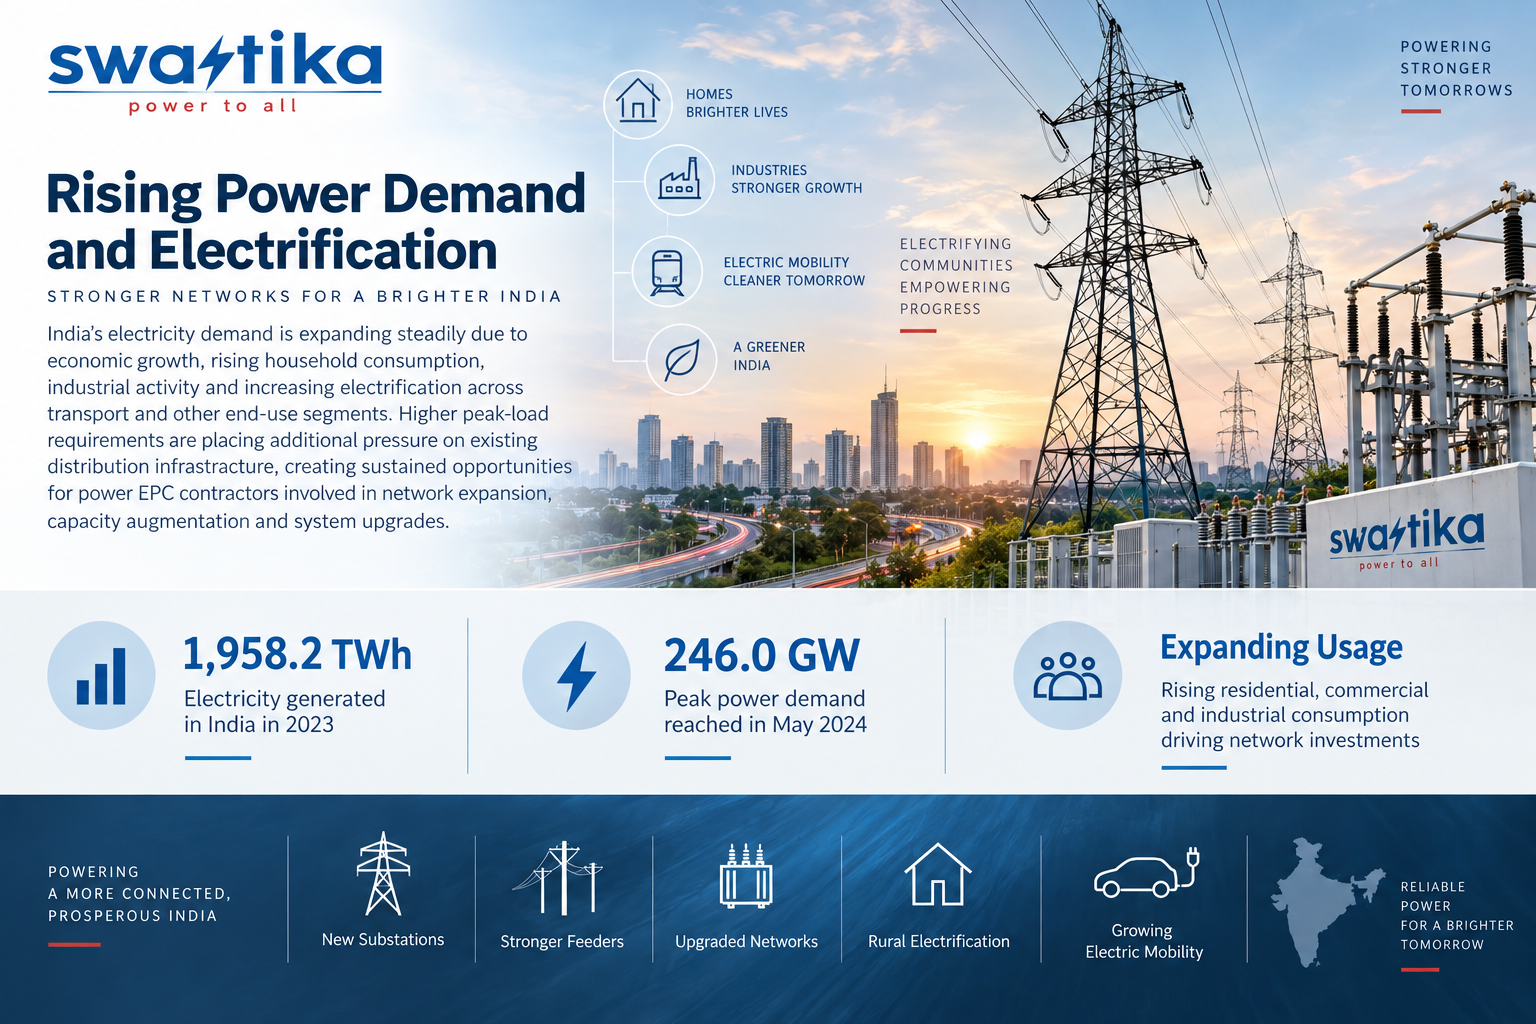
India’s electricity demand is expanding steadily due to economic growth, rising household consumption, industrial activity and increasing electrification across transport and other end-use segments. Higher peak-load requirements are placing additional pressure on existing distribution infrastructure, requiring utilities to strengthen substations, feeders, transformers and last-mile networks. This creates sustained opportunities for power EPC contractors involved in network expansion, capacity augmentation and system upgrades. Continued electrification and rising per-capita consumption should support recurring investments in transmission and distribution infrastructure over the medium term.
The key points are
India generated approximately 1,958.2 TWh of electricity in 2023, reflecting continued growth in overall power consumption
Peak power demand reached approximately 246.0 GW in May 2024, indicating increasing pressure on transmission and distribution infrastructure
Expanding residential, commercial and industrial electricity usage is driving requirements for new substations, feeders and distribution networks
Grid Modernisation and Distribution Infrastructure Expansion
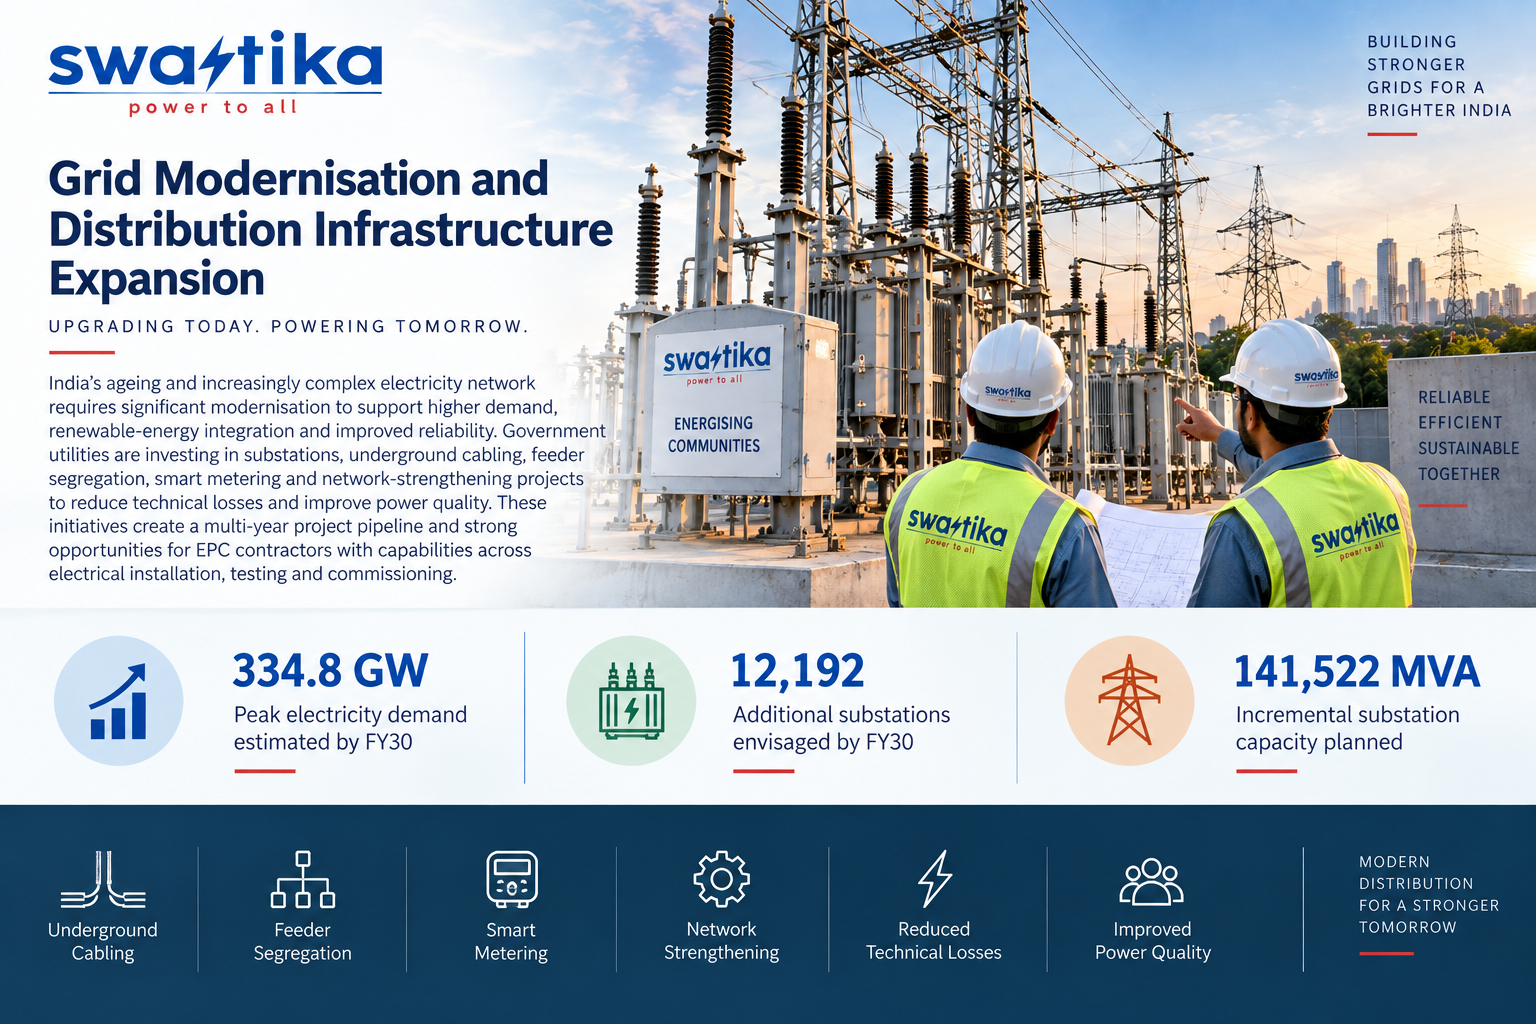
India’s ageing and increasingly complex electricity network requires significant modernisation to support higher demand, renewable-energy integration and improved reliability. Government utilities are investing in substations, underground cabling, feeder segregation, smart metering and network-strengthening projects to reduce technical losses and improve power quality. These initiatives directly support demand for EPC contractors with capabilities across electrical installation, testing and commissioning. Large planned additions to substation and distribution capacity provide a multi-year project pipeline for companies participating in utility-led infrastructure expansion.
The key points are
The CEA Distribution Perspective Plan estimates peak electricity demand of approximately 334.8 GW by FY30
The plan envisages around 12,192 additional substations and approximately 141,522 MVA of incremental capacity
Investments in underground cabling, feeder segregation, loss reduction and network strengthening are increasing EPC opportunities across states
Urbanisation, Industrialisation and New Infrastructure Corridors
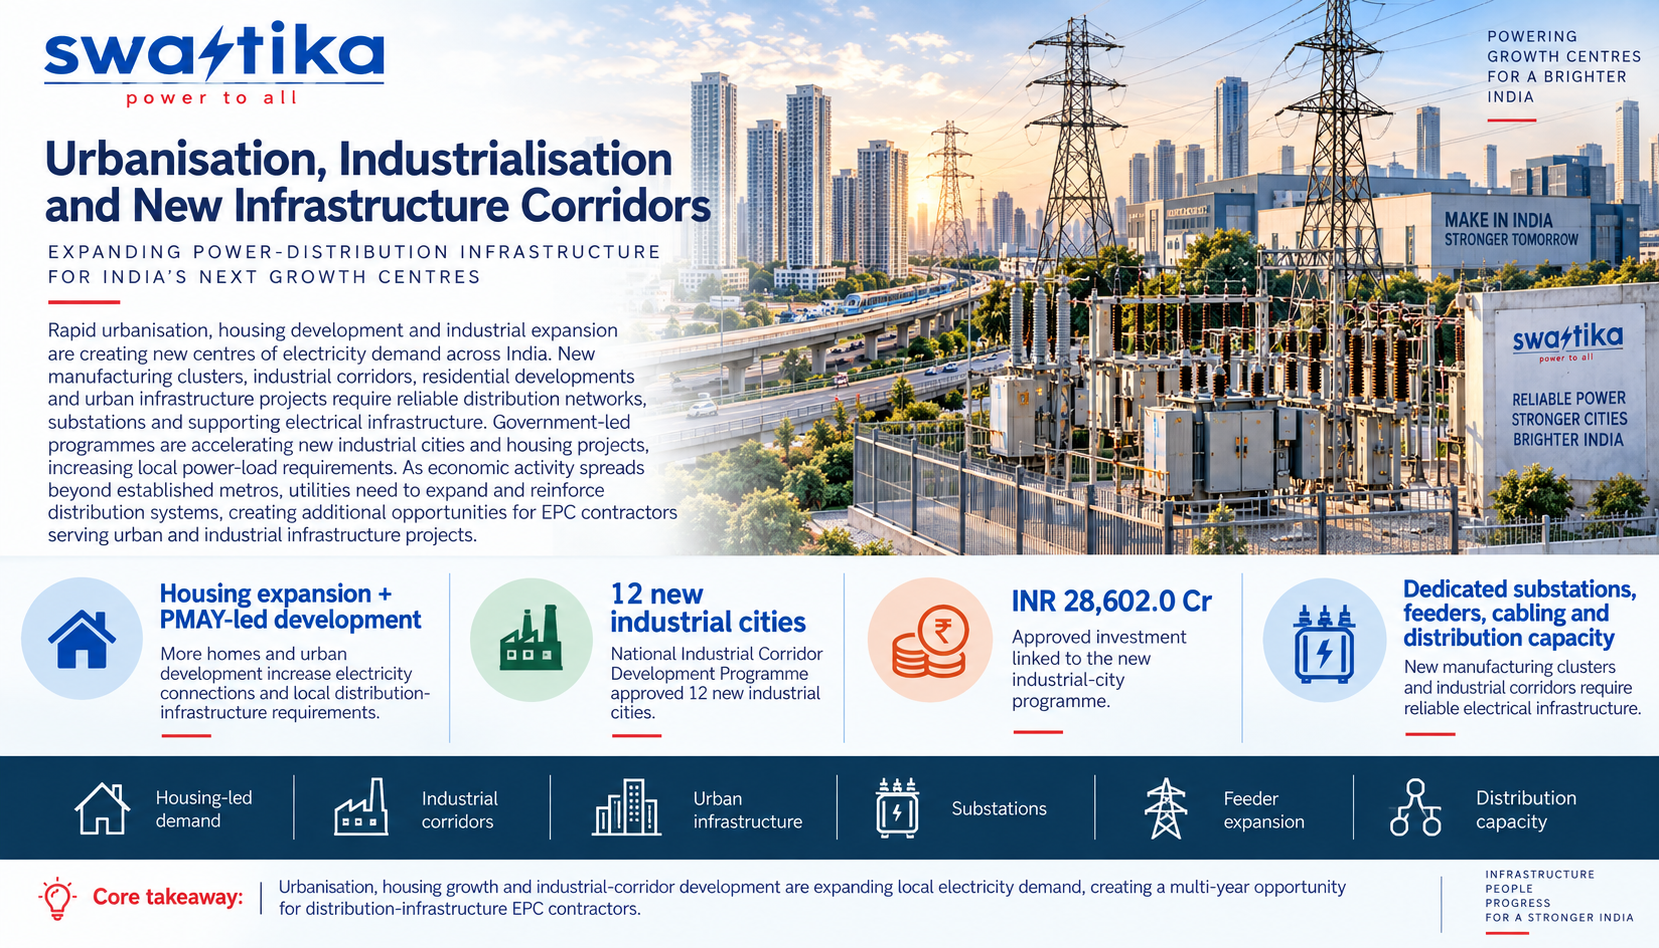
Rapid urbanisation, housing development and industrial expansion are creating new centres of electricity demand across India. New manufacturing clusters, industrial corridors, residential developments and urban infrastructure projects require reliable distribution networks, substations and supporting electrical infrastructure. Government-led programmes are further accelerating development of new industrial cities and housing projects, increasing local power-load requirements. As economic activity spreads beyond established metropolitan centres, utilities are required to expand and reinforce distribution systems, creating additional opportunities for EPC contractors serving both urban and industrial infrastructure projects.
The key points are:
Housing expansion and PMAY-led development increase electricity connections and associated local distribution-infrastructure requirements
The National Industrial Corridor Development Programme approved 12 new industrial cities with investment of approximately INR 28,602.0 Cr
New manufacturing clusters and industrial corridors require dedicated substations, feeders, cabling and power-distribution capacity, supporting incremental EPC demand
Risks in the Industry
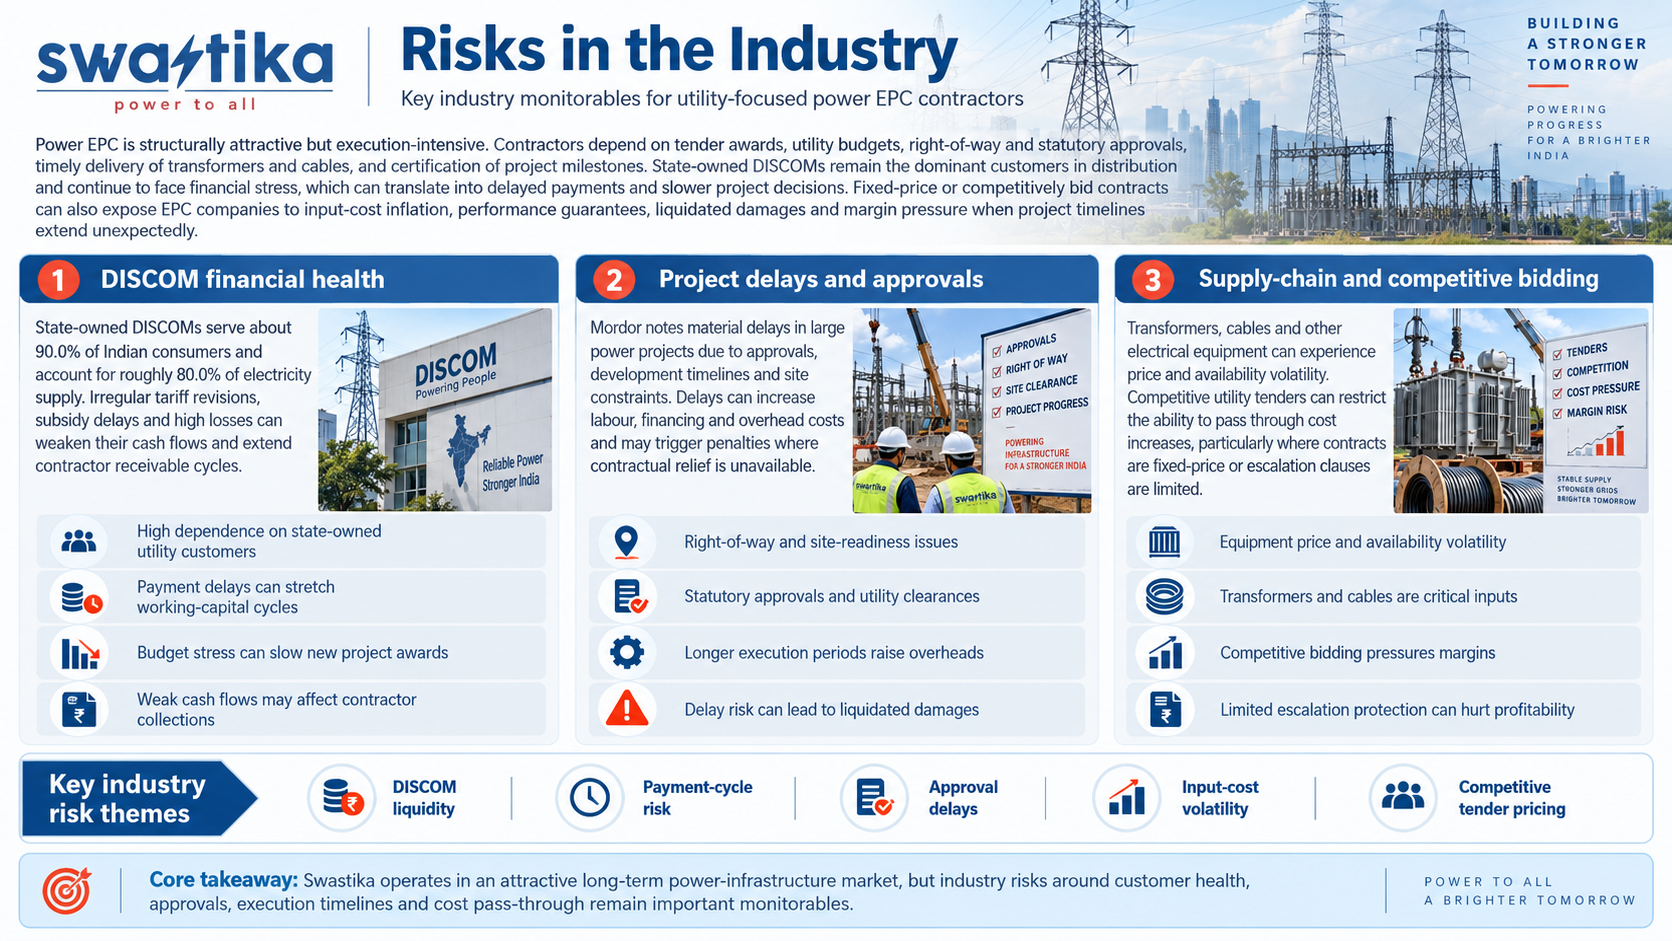
Power EPC is structurally attractive but execution-intensive. Contractors depend on tender awards, utility budgets, right-of-way and statutory approvals, timely delivery of transformers and cables, and certification of project milestones. State-owned DISCOMs remain the dominant customers in distribution and continue to face financial stress, which can translate into delayed payments and slower project decisions. Fixed-price or competitively bid contracts can also expose EPC companies to input-cost inflation, performance guarantees, liquidated damages and margin pressure when project timelines extend unexpectedly.
The key points are:
DISCOM financial health: State-owned DISCOMs serve about 90.0% of Indian consumers and account for roughly 80.0% of electricity supply. Irregular tariff revisions, subsidy delays and high losses can weaken their cash flows and extend contractor receivable cycles
Project delays and approvals: Mordor notes material delays in large power projects due to approvals, development timelines and site constraints. Delays can increase labour, financing and overhead costs and may trigger penalties where contractual relief is unavailable
Supply-chain and competitive bidding: Transformers, cables and other electrical equipment can experience price and availability volatility. Competitive utility tenders can restrict the ability to pass through cost increases, particularly where contracts are fixed-price or escalation clauses are limited
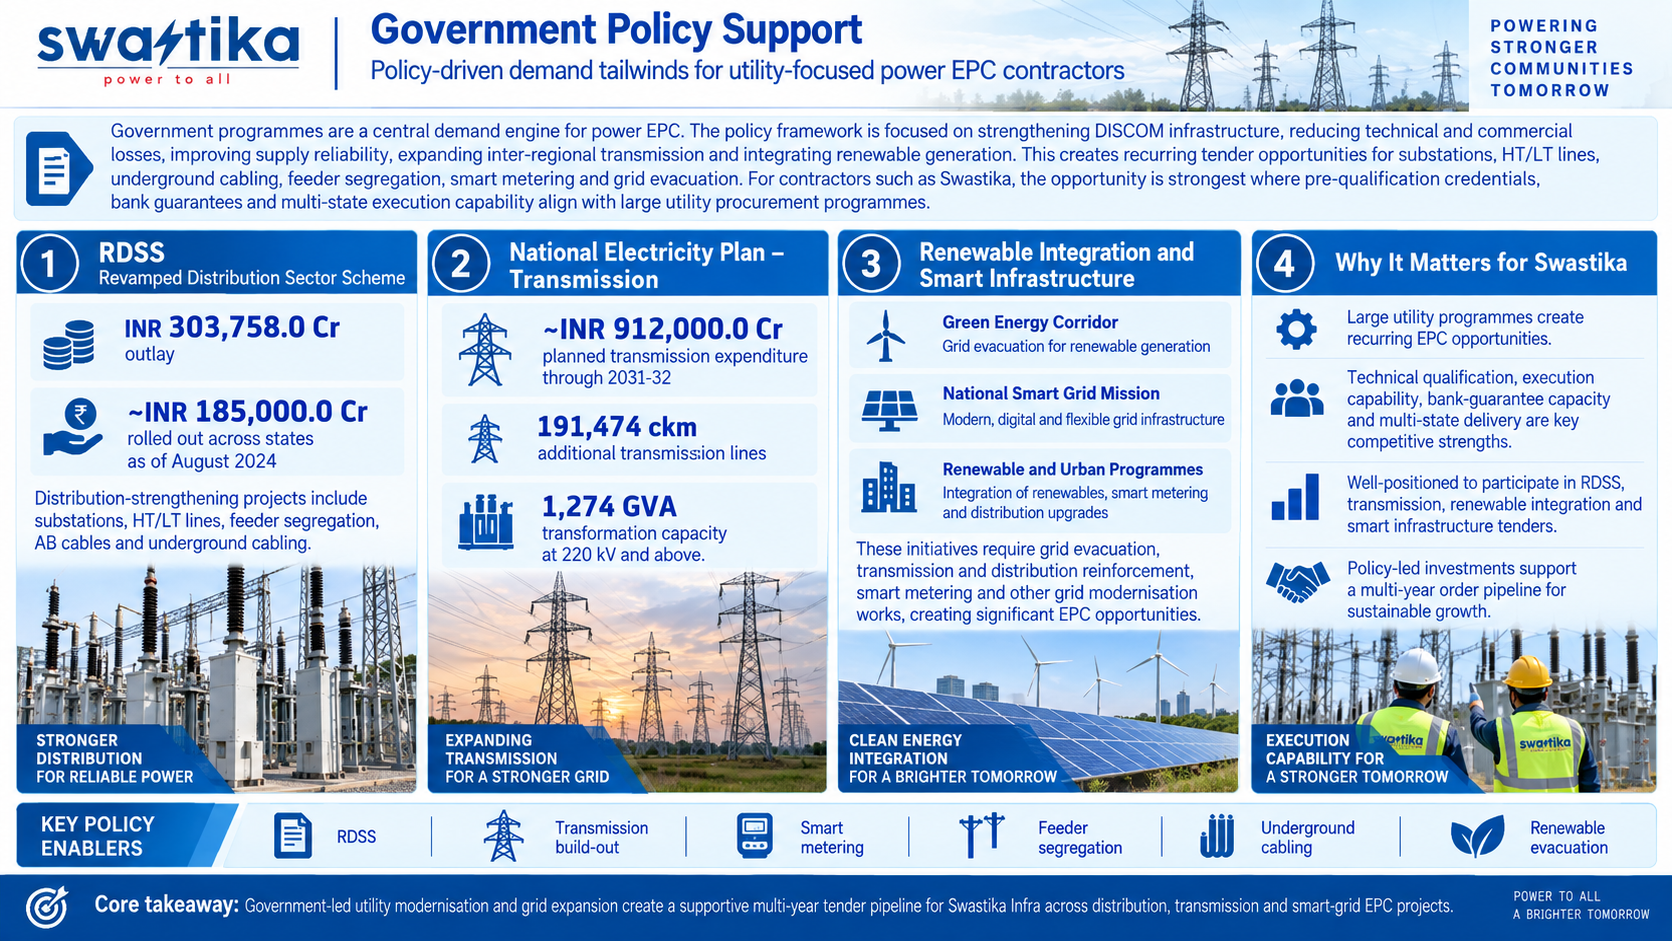
Government Policy Support
Government programmes are a central demand engine for power EPC. The policy framework is focused on strengthening DISCOM infrastructure, reducing technical and commercial losses, improving supply reliability, expanding inter-regional transmission and integrating renewable generation. This results in recurring tender opportunities for substations, HT/LT lines, underground cabling, feeder segregation, smart metering and grid evacuation. For contractors such as Swastika, the opportunity is strongest where pre-qualification credentials, bank guarantees and multi-state execution capability align with large utility procurement programmes.
The key policies are:
RDSS: The Revamped Distribution Sector Scheme carries an outlay of approximately INR 303,758.0 Cr. As of August 2024, distribution-strengthening projects aggregating about INR 185,000.0 Cr had been rolled out across states for substations, HT/LT lines, feeder segregation, AB cables and underground cabling
National Electricity Plan - Transmission: Planned transmission expenditure is approximately INR 912,000.0 Cr through 2031-32, with 191,474 ckm of additional transmission lines and 1,274 GVA of transformation capacity envisaged at 220 kV and above
Renewable integration and smart infrastructure: The Green Energy Corridor, National Smart Grid Mission and related renewable / urban programmes require evacuation, grid reinforcement, smart metering and distribution upgrades, broadening the addressable EPC opportunity beyond conventional electrification projects
Fundraise/Future Plans
Shareholding
Pre-issue shareholding
Promoter Holding 0.0%
Post-Issue Shareholding
Promoter Holding 0.0%
Category
Pre-Issue%Post-Issue%
Promoters
Babulal Gupta
2.7%2.2%
Vinay Gupta
25.9%19.8%
Ruchira Gupta
18.8%14.1%
Biren Parnami
14.6%10.6%
Manoj Modi
14.6%10.6%
Total Promoter Holding
76.6%57.3%
Additional Shareholders
Other Shareholders
23.4%42.7%
Total Additional Holding
23.4%42.7%
Total Shareholding
100.0%100.0%
- Overview
- Business
- Financial Highlights
- Industry Overview
- Fundraise/Future Plans
- Documentation
Get the Preqt App and keep in touch around the clock!
 Monitor your investments in real-time.
- Receive tailored deal suggestions.
- Get real-time updates and alerts.
