

TRL Krosaki Refractories Ltd.
Engineering Refractory ExcellenceStrength Beyond Heat
Unlisted Review and Rating
Considerable
DRHP Not FiledOverall Recommendation
TRL Krosaki combines strong Japanese parentage, entrenched customer relationships, healthy operating margins, low leverage, positive cash generation and attractive peer-relative valuation. However, FY25 earnings were materially supported by an exceptional asset-sale gain, revenue growth remains moderate, exports weakened, board independence is low and unlisted-share liquidity is limited. The investment remains attractive around the supplied INR 1,755 price only if investors assess value using normalized earnings of approximately INR 231–247 crore rather than the reported INR 343.64 crore PAT.
PARAMETER
WEIGHT
SCORE
KEY FACTORS
Financial Performance
25.0%
4.5/5
Strong revenue growth, improving EBITDA margins, asset-light model
Show more
Detailed Analysis
FY23–FY25 revenue increased from INR 2,295.0 crore to INR2,600.0 crore, representing a moderate 6.4% CAGR
FY25 EBITDA was approximately INR 363.6 crore, producing a healthy but sub-15% 13.8% margin
Reported consolidated PAT margin reached 13.2%, although an exceptional asset-sale gain materially supported profit
Borrowings of INR 108.84 crore against equity of INR 1,203.04 crore produce a conservative 0.1x D/E ratio
Reported PAT on average FY24–FY25 equity produces an excellent 32.3% ROE
FY25 included a INR 129.72 crore pre-tax exceptional gain from the sale of assets
Industry
25.0%
3.0/5
Domestic steel expansion supports demand, but mature competition, imported raw-material dependence and soft exports constrain industry quality
Show more
Detailed Analysis
Indian refractory demand is expected to grow approximately 6–8%, supported by steel and cement capacity expansion
Mining, environmental and import regulations create compliance exposure, while domestic-manufacturing policies provide partial support
Global refractory demand is growing approximately 4%, but TRL Krosaki’s FY25 exports declined 7% to INR 297 crore
Management
25.0%
3.0/5
Deep technical experience and strong parentage are offset by low board independence, related-party exposure and manageable litigation
Show more
Detailed Analysis
The Company has operated since 1958, while Japanese parent Krosaki Harima has more than a century of refractory experience
Only 2 of 11 directors, or approximately 18.2%, were independent at FY25-end
Gross operating related-party transactions were approximately 8.8% of revenue
Valuation Metrics
25.0%
4.0/5
Peer-relative valuation appears attractive, but normalized earnings raise the effective P/E and unlisted liquidity remains limited
Show more
Detailed Analysis
Reported P/E of 10.7 x represents a 59.9% discount to the supplied industry P/E of 26.6x
Estimated EV/EBITDA of approximately 10.3x is materially below listed refractory peers trading around 16–23x
The supplied 3.0x P/B falls within the framework’s 3–4x scoring band
TOTAL
100%
3.6/5
Weighted Composite Score
Per Share Price
₹1755.0
As of 14 Oct 2026
Lot Size
25.0 Shares
Minimum Investment
₹43,875.0 / 25 shares
Market Cap. (₹ Cr)
Revenue FY’25
PAT FY’25
P/E Multiple
Face Value
₹ 10.0Lot Size
25.0 sharesSale Type
Secondary SalePAT FY’25
₹ 343.6 CrPAT Margin (%)
13.1 %P/E Multiple
10.7xCAGR Growth 3Y
6.8 %ROE (FY’25)
28.6 %ROCE (FY’25)
32.8 %Price to Book Value ratio
3.0xDebt/Equity (FY’25)
0.1xMerchant banker appointed
❌ NoCompany Website
www.trlkrosaki.comDisclaimer: Unlisted shares are unregulated & illiquid. This is NOT investment advice. Please do your own due diligence before investing.
Minimum Investment
₹43,875.0 / 25 sharesShares Lot 25 X 1
Investment amount
₹43,875.0
Overview
Business
Products
Business Model
Geographical Presence
Sales Channel
Key Risk Factor
Financial Highlights
Income Statement
Revenue growth with EBITDA and PAT margins
| Financial Metric | FY 2023 | FY 2024 | FY 2025 |
|---|---|---|---|
| Revenue (₹ Cr) | 2,289.8 | 2,502.6 | 2,600.1 |
| Growth (%) | 19.2% | 9.3% | 3.9% |
| EBITDA (₹ Cr) | 272.1 | 332.4 | 363.6 |
| EBITDA Margin (%) | 11.9% | 13.3% | 14.0% |
| PAT (₹ Cr) | 158.3 | 243.3 | 343.6 |
| PAT Margin (%) | 6.9% | 9.7% | 13.2% |
OBSERVATIONS & INSIGHTS
• Revenue increased at a 6.6% two-year CAGR, but annual growth moderated from 19.2% in FY23 to 3.9% in FY25, indicating slower top-line momentum in the latest year
• Pre-exceptional EBITDA increased at a 15.6% two-year CAGR and margin expanded by 2.1 percentage points to 14.0%, supported by cost reduction, product performance and operating efficiencies identified by management
• Reported PAT increased at a 47.4% two-year CAGR, but FY24 and FY25 included pre-tax exceptional gains of ₹43.6 Cr and ₹129.7 Cr. Those gains must be separated when assessing maintainable earnings
Balance Sheet
| Financial Metric | FY 2023 | FY 2024 | FY 2025 |
|---|---|---|---|
| EQUITY & LIABILITIES | ₹ 1,527.7 Cr | ₹ 1,569.1 Cr | ₹ 1,781.9 Cr |
| Net Worth | ₹ 729.2 Cr | ₹ 923.2 Cr | ₹ 1,203.0 Cr |
| Share Capital | ₹ 20.9 Cr | ₹ 20.9 Cr | ₹ 20.9 Cr |
| Reserves & Surplus | ₹ 708.3 Cr | ₹ 902.3 Cr | ₹ 1,182.1 Cr |
| Total Liabilities | ₹ 798.5 Cr | ₹ 645.9 Cr | ₹ 578.9 Cr |
| Current Liabilities | ₹ 698.3 Cr | ₹ 543.9 Cr | ₹ 425.7 Cr |
| Borrowings | ₹ 235.8 Cr | ₹ 127.4 Cr | ₹ 33.7 Cr |
| Trade Payables | ₹ 311.6 Cr | ₹ 298.6 Cr | ₹ 301.5 Cr |
| Other Current Liabilities | ₹ 150.9 Cr | ₹ 117.9 Cr | ₹ 90.5 Cr |
| Non-Current Liabilities | ₹ 100.2 Cr | ₹ 102.0 Cr | ₹ 153.2 Cr |
| Borrowings | ₹ 27.3 Cr | ₹ 26.1 Cr | ₹ 75.1 Cr |
| Other Non-Current Liabilities | ₹ 72.9 Cr | ₹ 75.9 Cr | ₹ 78.1 Cr |
| ASSETS | ₹ 1,427.9 Cr | ₹ 1,569.2 Cr | ₹ 1,782.1 Cr |
| Current Assets | ₹ 836.6 Cr | ₹ 905.1 Cr | ₹ 1,004.4 Cr |
| Trade Receivables | ₹ 337.3 Cr | ₹ 370.5 Cr | ₹ 351.9 Cr |
| Inventory | ₹ 470.3 Cr | ₹ 461.5 Cr | ₹ 540.3 Cr |
| Cash & Cash Equivalents | ₹ 0.5 Cr | ₹ 34.2 Cr | ₹ 41.4 Cr |
| Other Current Assets | ₹ 28.5 Cr | ₹ 38.9 Cr | ₹ 70.8 Cr |
| Non-Current Assets | ₹ 591.3 Cr | ₹ 664.1 Cr | ₹ 777.7 Cr |
| Fixed Assets | ₹ 522.8 Cr | ₹ 591.9 Cr | ₹ 702.2 Cr |
| Other Non-Current Assets | ₹ 68.5 Cr | ₹ 72.2 Cr | ₹ 75.5 Cr |
OBSERVATIONS & INSIGHTS
• Shareholders’ wealth increased by ₹473.8 Cr between FY23 and FY25, while share capital remained unchanged at ₹20.9 Cr; the balance-sheet expansion was therefore funded mainly by retained earnings
• Current borrowings reduced from ₹235.8 Cr to ₹33.7 Cr, although non-current borrowings increased to ₹75.1 Cr in FY25 as the Company continued capacity expansion and modernisation
• Fixed assets increased by ₹179.4 Cr over two years and inventory rose to ₹540.3 Cr. The asset build supports future capacity but raises execution, utilisation and working-capital requirements
Cash Flow
| Financial Metric | FY 2023 | FY 2024 | FY 2025 |
|---|---|---|---|
CFO (₹ Cr) Cash generated from core business operations. | +182.9 Cr | +235.7 Cr | +219.5 Cr |
CFI (₹ Cr) Cash used for investments and long-term assets. | -86.5 Cr | -21.6 Cr | -94.5 Cr |
CFF (₹ Cr) Cash flow related to funding and borrowings. | -99.8 Cr | -180.4 Cr | -117.8 Cr |
Working Capital
| Efficiency Metric | FY 2023 | FY 2024 | FY 2025 |
|---|---|---|---|
Debtor Days Average number of days taken to collect customer payments. | - | - | - |
Creditor Days Average time taken to pay suppliers and vendors. | - | - | - |
Inventory Days Average number of days inventory remains unsold. | - | - | - |
CCC (Cash Conversion Cycle) (Debtor Days + Inventory Days - Creditor Days) | - | - | - |
Financial Ratios
Measures the company’s leverage relative to shareholder equity.
OBSERVATIONS & INSIGHTS
• Debt-to-equity reduced to 0.1x and interest coverage expanded to 27.2x in FY25, reflecting lower current borrowings, stronger earnings and proceeds from land disposal
• The current ratio improved to 2.4x as current liabilities declined and inventories increased, creating a stronger liquidity buffer but also tying more funds in working capital
• Reported ROE and ROA rose because headline PAT included exceptional gains; pre-exceptional ROCE declined from 26.4% to 23.7% in FY25, providing a more cautious operating-return signal
Industry Overview
Industry Drivers
Expansion of Technological Capabilities
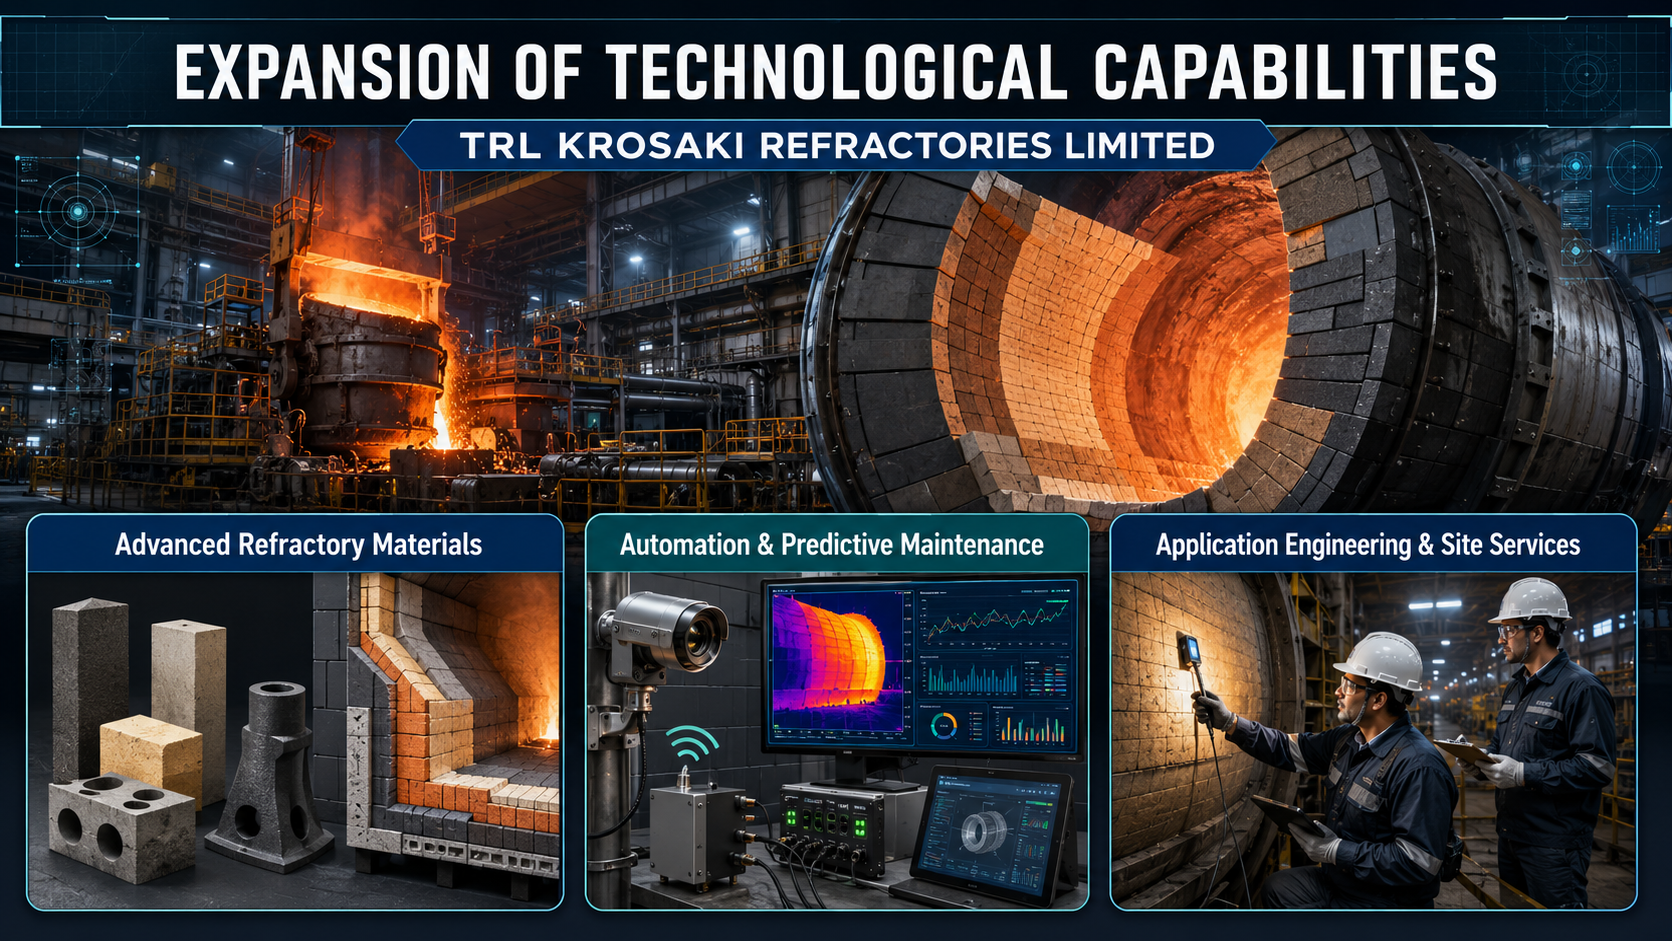
Steelmakers increasingly require refractory products that provide longer lining life, withstand higher operating temperatures and reduce energy consumption. TRL Krosaki can use its R&D capabilities and access to Krosaki Harima Corporation’s technology to develop specialised products for taphole clay, flow control, alumina-graphite, BOF, RH snorkel and monolithic applications
Sensors, robotics, remote monitoring and data analytics can help identify refractory wear before failures occur. These technologies can reduce manual intervention, improve worker safety, prevent unplanned shutdowns and allow customers to schedule maintenance more efficiently
Refractory performance depends on product selection, installation quality and the customer’s operating conditions. The Company’s site engineers, refractory-health audits and design-optimisation capabilities enable it to provide application-specific solutions rather than only supplying products
Capacity Expansion
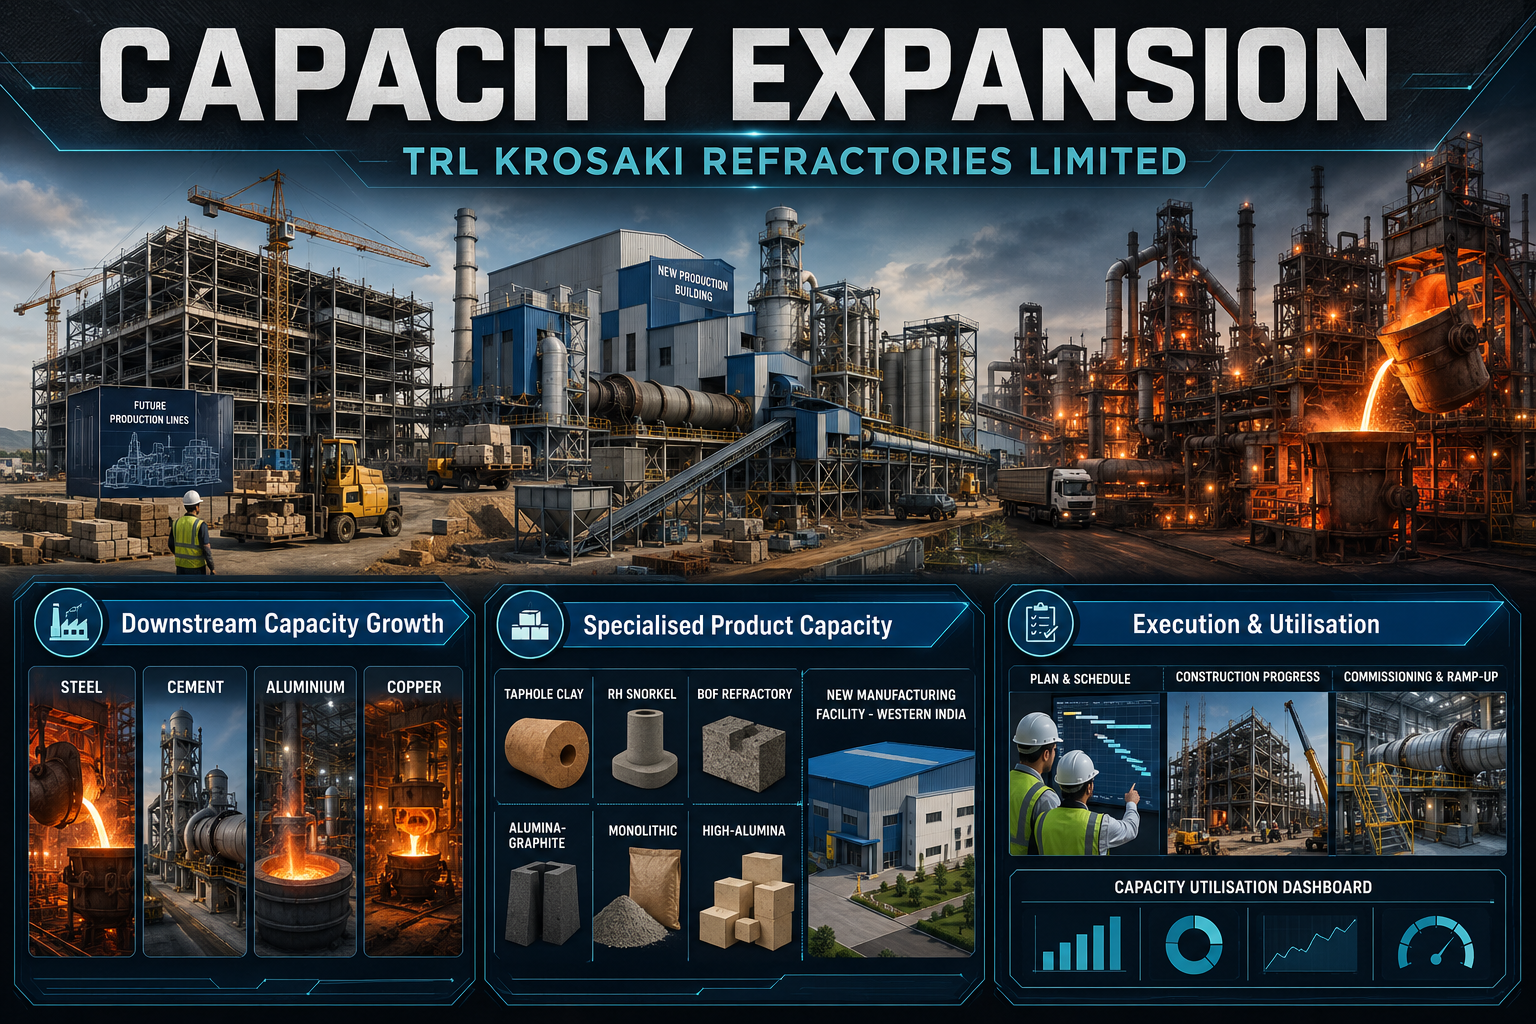
Expansion and modernisation by Indian steel, cement, aluminium, copper and other process industries create demand for initial furnace linings, replacement refractories and lifecycle services. Growth in steel production is particularly important because steel-sector customers account for a substantial portion of the Company’s revenue and consume refractories continuously during production
TRL Krosaki is expanding capabilities in taphole clay, RH snorkel, BOF refractories, alumina-graphite products, monolithics and high-alumina refractories. The planned Gujarat facility can improve proximity to customers in western India, reduce delivery times and support regional market penetration
The returns generated by the expansion programme will depend on timely construction, controlled project costs, customer approvals and adequate utilisation after commissioning. Delays, cost overruns or commissioning during a downturn in steel demand could weaken returns. Investors should monitor project timelines, capital expenditure, utilisation, incremental revenue and the effect of expansion on borrowings and cash flows
Domestic Market Penetration
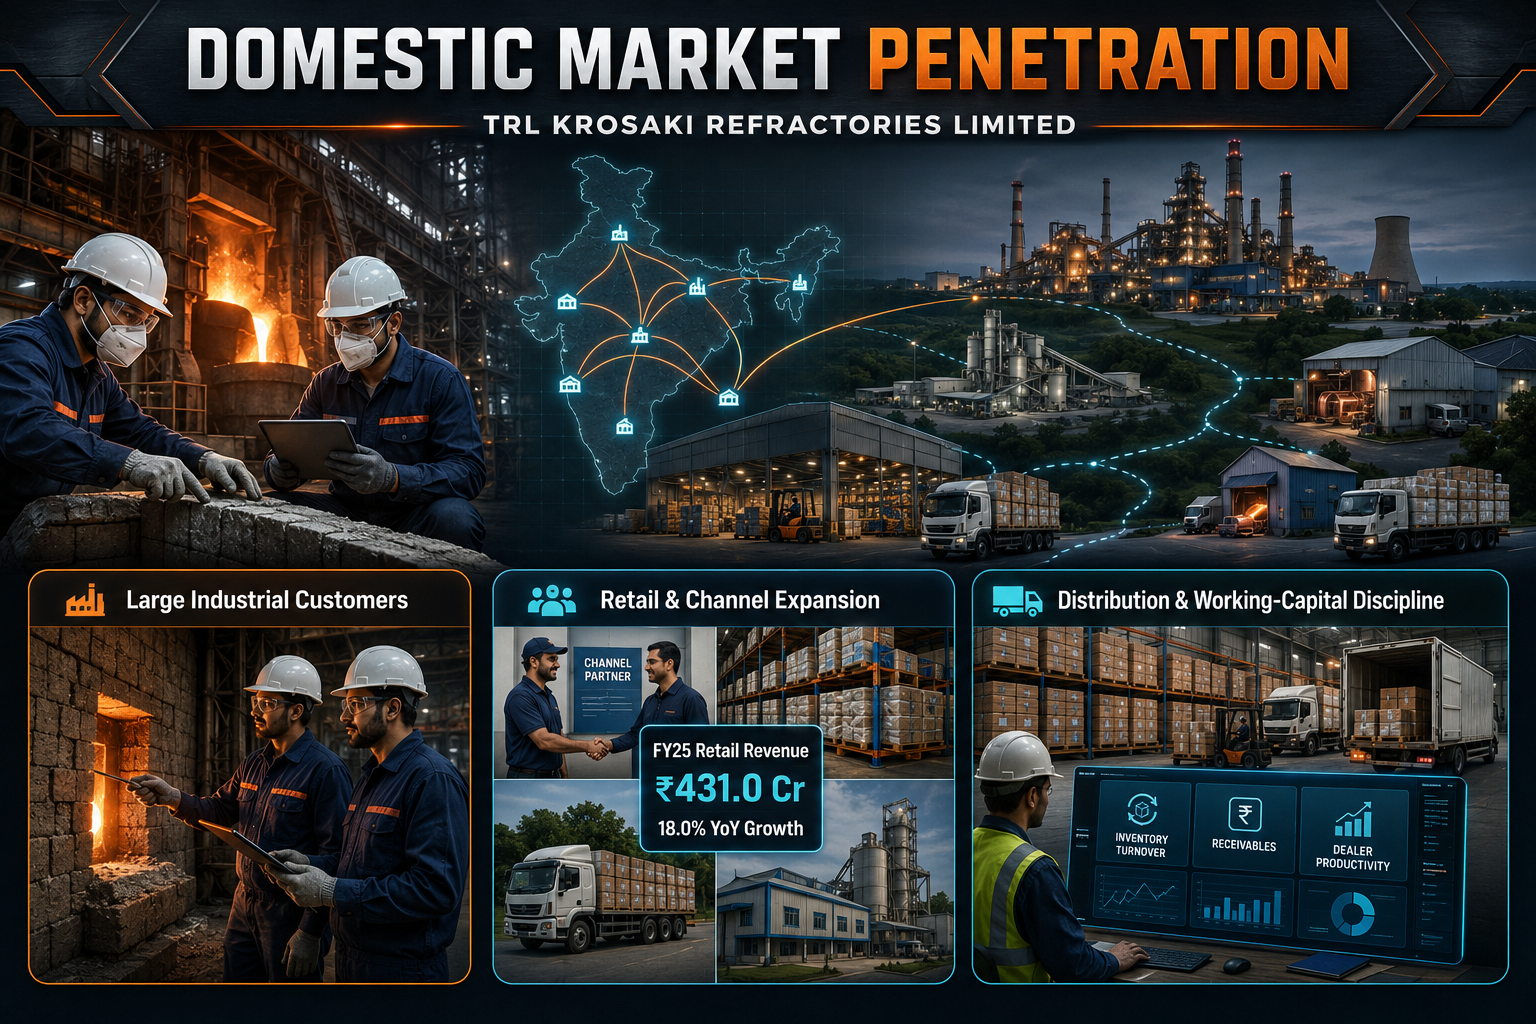
Large steel, cement and non-ferrous customers require reliable product supply, application engineering and rapid technical support. The Company’s site-engineer presence allows it to monitor refractory performance, resolve operating issues and identify opportunities for product upgrades
Smaller steelmakers, cement producers and MSME customers can be served more efficiently through distributors, channel partners and regional sales teams. The Company’s FY25 retail revenue of ₹431.0 Cr, which increased by 18.0% year on year, demonstrates the growing importance of this channel
Wider domestic penetration requires sufficient regional inventory, dependable logistics and appropriately structured customer-credit arrangements. Excess inventory or weak collections from smaller customers could increase working-capital requirements and credit losses. The Company must therefore balance market expansion with dealer productivity, inventory turnover, receivable ageing and service quality across its distribution network
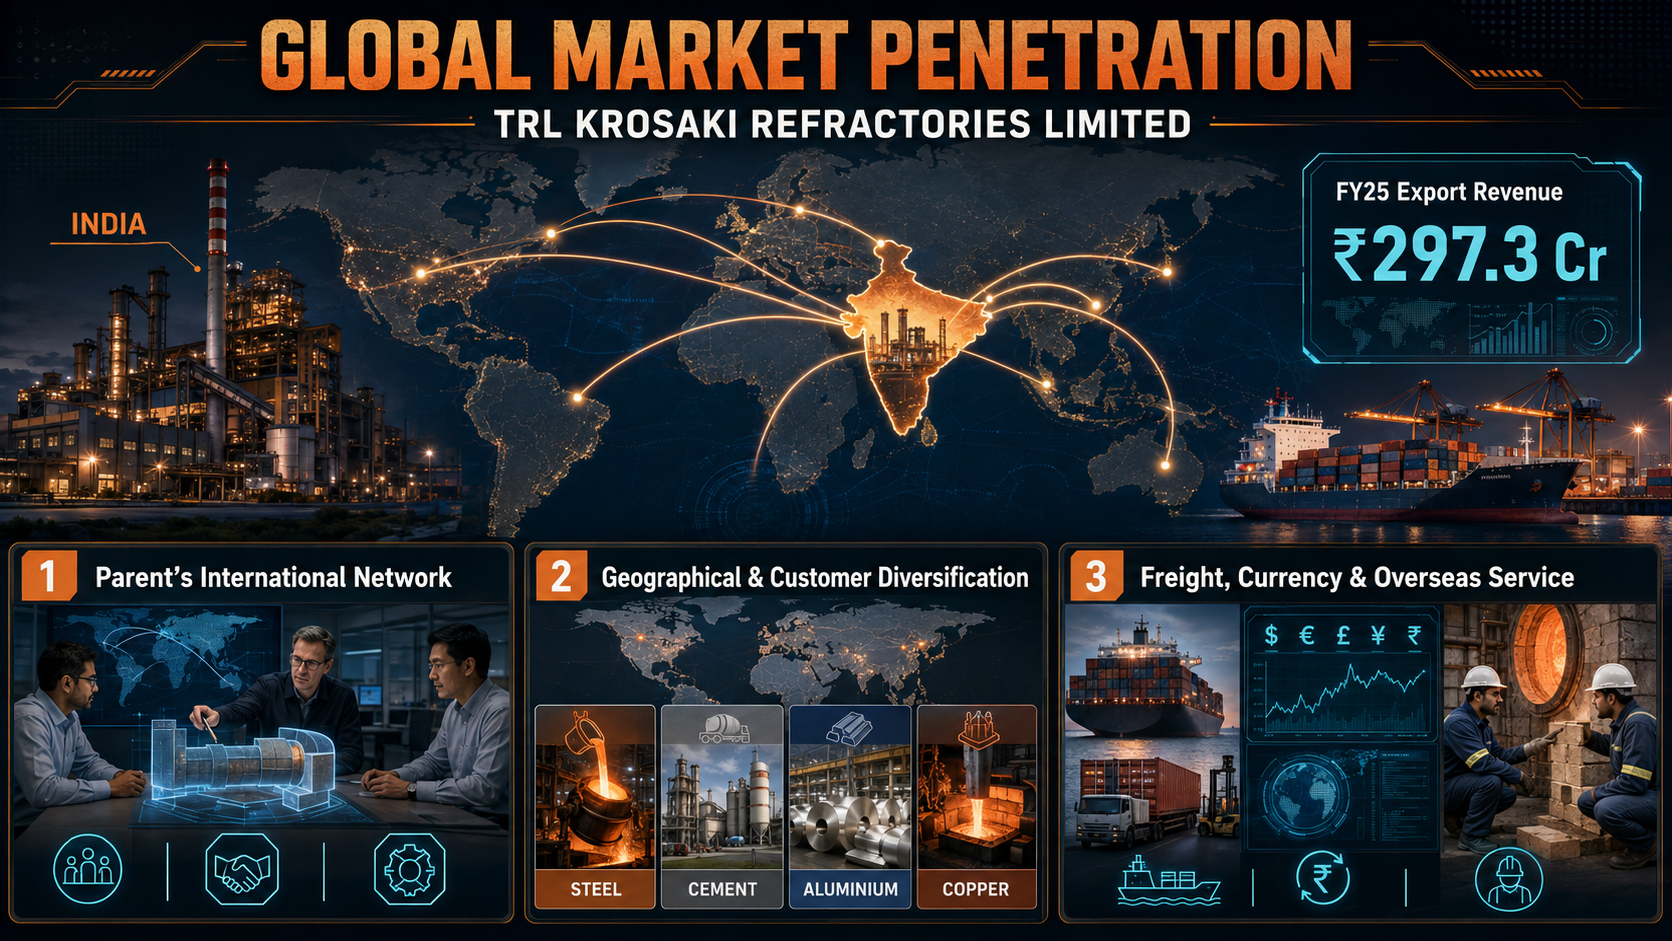
Global Market Expansion
Krosaki Harima Corporation’s global presence can provide TRL Krosaki with access to overseas customers, technical expertise and established market relationships. Collaboration with the parent can help the Company enter specialised refractory applications and participate in international projects. However, sustained exports will depend on competitive product performance, customer qualification and adherence to destination-specific quality standards
International expansion can reduce dependence on the Indian steel cycle and provide access to customers across steel, cement, aluminium, copper and other industries. FY25 export revenue declined to ₹297.3 Cr, indicating that overseas growth may not remain consistent across periods
Export profitability is affected by freight costs, exchange-rate movements, raw-material availability, import duties and international competition. Refractory products also require technical support during installation and operation, making reliable overseas service capabilities important
Government Policy Support
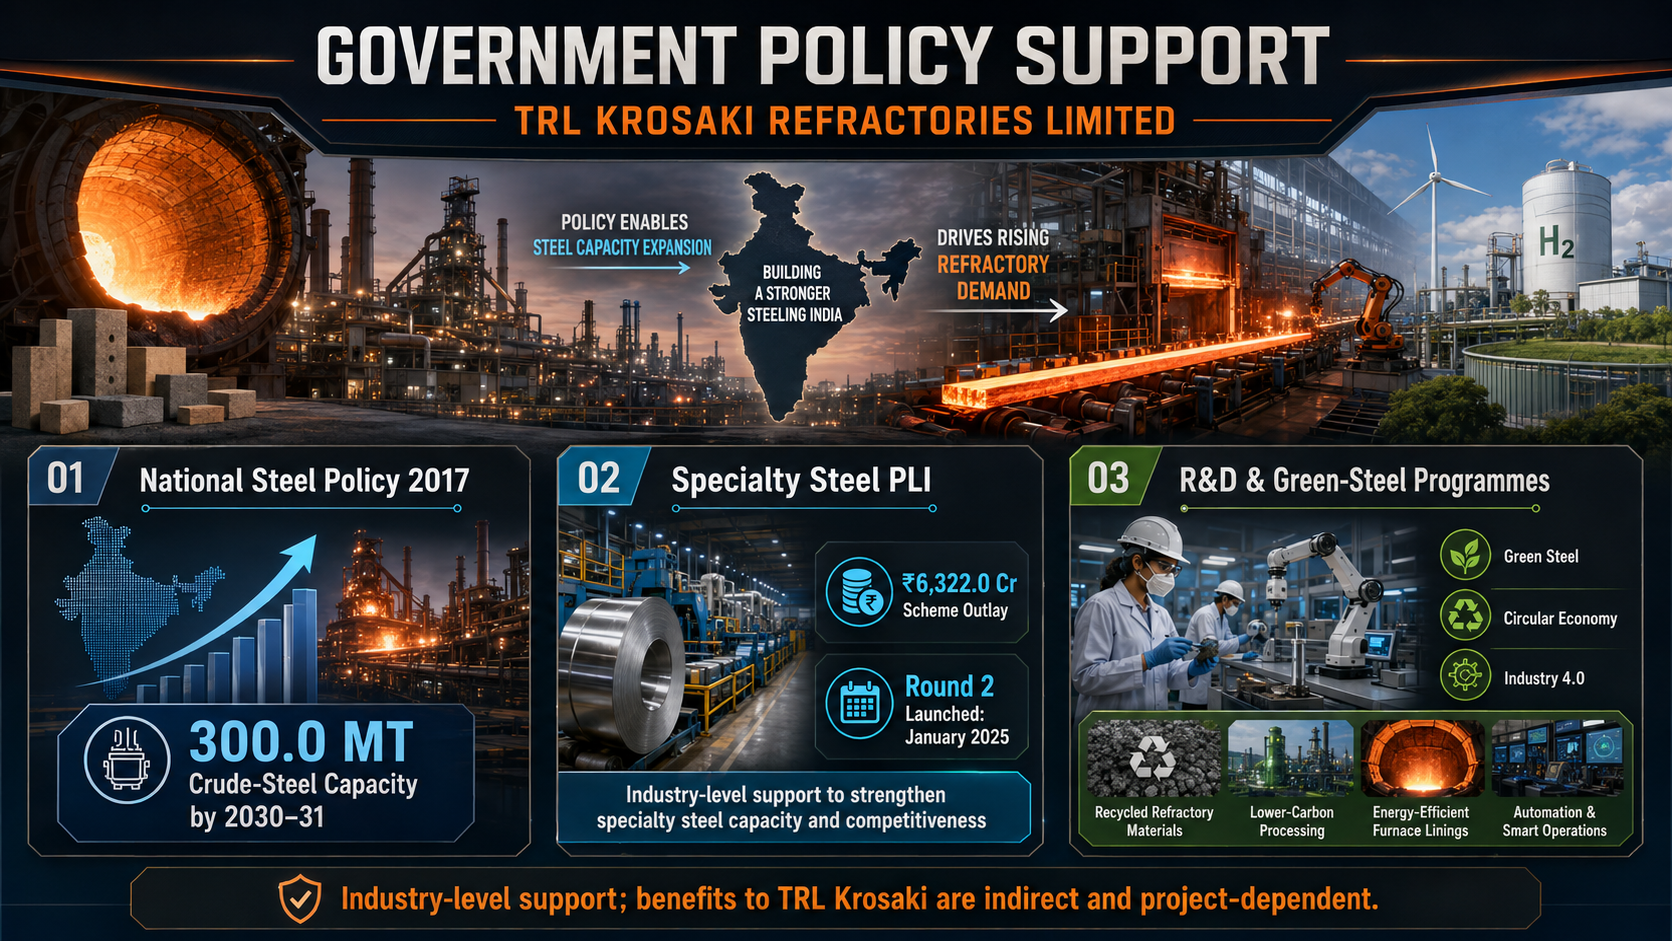
The National Steel Policy 2017 seeks a technologically advanced and globally competitive steel industry and targets 300.0 million tonnes of crude-steel capacity by 2030–31. If implemented, this capacity expansion should enlarge the addressable market for refractory products, relining work and technical services
The Production Linked Incentive scheme for specialty steel carries a ₹6,322.0 Cr budget and is intended to attract investment, add capacity and reduce imports. The second round launched in January 2025. Higher domestic specialty-steel production can support demand for more sophisticated refractory systems, although the benefit to TRL Krosaki is indirect and project-dependent
The Steel Research and Technology Mission of India supports collaboration in green steel, circular economy, advanced steel, Industry 4.0 and operational excellence. These priorities can stimulate demand for lower-carbon refractories, recycled raw materials, process automation and energy-efficient lining solutions, aligning with the Company’s R&D agenda
- Overview
- Business
- Financial Highlights
- Industry Overview
- Documentation
Get the Preqt App and keep in touch around the clock!
 Monitor your investments in real-time.
- Receive tailored deal suggestions.
- Get real-time updates and alerts.
