


Varmora Granito
Design Meets DurabilityBuilt for Beautiful Living
IPO Summary (PreQT)
Varmora Granito Limited is a Gujarat-headquartered building-materials company focused on tiles and bathware, with a premiumizing product mix led by glazed vitrified tiles (GVT) and technical products. FY26 revenue from operations was INR 1,512.5 Cr, EBITDA was INR 221.6 Cr and PAT was INR 55.1 Cr, translating into an EBITDA margin of 14.2% and PAT margin of 3.5%. Tiles contributed 87.9% of FY26 revenue, while GVT and technical products represented 84.2% of tile revenue, reflecting a material shift toward higher-realisation categories. The Company operates eight in-house manufacturing facilities through the Company and Subsidiaries in the Morbi cluster, while the wider Technopak peer-comparison footprint includes 12 plants across the Company, Subsidiaries, Associates and Joint Ventures. Its distribution platform comprised 305 EBOs and 2,758 MBOs within a 3,063-dealer network, and products were sold in 988 Indian cities in FY26. The IPO comprises 4,78,39,255 shares at INR 140.0-INR 148.0 per share, including a fresh issue of 2,16,21,621 shares and an OFS of 2,62,17,634 shares by Katsura Investments. At the upper band, the issue size is approximately INR 708.0 Cr and post-issue market capitalisation approximately INR 3,345.0 Cr. INR 245.0 Cr of fresh proceeds is earmarked for debt repayment, making deleveraging the principal use of primary capital.
IPO Review Rating
Average
MainboardCombining Design, Durability, and Craftsmanship for Contemporary Spaces
Varmora Granito's operating business has several attractive characteristics: a broad branded distribution network, increasing premium-product contribution, improving EBITDA Margin, strong operating cash generation and relatively low dealer concentration. The main weakness is the lack of strong topline growth. FY24–FY26 Revenue CAGR is only ~2.7%, while ROE remains modest at 6.8%. The improvement in profitability has therefore been driven primarily by margin expansion and manufacturing efficiencies rather than rapid growth in sales. The IPO also has an important balance-sheet positive. The Fresh Issue proceeds are primarily directed toward debt repayment, which should substantially reduce net debt and finance costs. This can support future profitability and improve the Company's capital structure. However, valuation is demanding. Using the required Market Cap ÷ PAT methodology, Varmora's post-issue P/E is approximately 60.7x, representing a ~29.5% premium to the listed-peer average and ~61.5% premium to the peer median. EV/EBITDA and P/B are much closer to peers, but the Company's 7.8% RoNW does not currently provide a strong fundamental justification for such a large P/E premium. Accordingly, Varmora may be viewed as a good operating business offered at an expensive earnings valuation. The final assessment could improve meaningfully if the anchor book and QIB subscription demonstrate strong institutional willingness to underwrite the premium; weak institutional demand would reinforce concerns that the IPO has been priced too aggressively.
PARAMETER
WEIGHT
SCORE
KEY FACTORS
Financial Performance
40.0%
3.0/5
Varmora demonstrates strong margin improvement, healthy operating cash conversion and improving leverage, but its Revenue CAGR remains modest and FY26 ROE of 6.8% is not particularly strong. Earnings improvement is therefore more margin-led than growth-led
Show more
Detailed Analysis
Revenue increased from INR 1,435.5 Cr in FY24 to INR 1,512.5 Cr in FY26, implying only ~2.7% CAGR
FY26 EBITDA Margin improved materially to 14.2%, versus 13.3% in FY25 and 10.2% in FY24
FY26 PAT Margin was 3.5%, remaining relatively thin despite improvement
FY26 net gearing declined to approximately 24.5%, indicating meaningful deleveraging
FY26 ROE was only 6.8%, below leading peer Kajaria and modest in absolute terms
FY26 operating cash flow was a strong INR 234.1 Cr, substantially exceeding reported PAT
Industry
15.0%
3.0/5
Varmora operates in a structurally growing but competitive tiles industry, supported by premiumisation, organised-brand penetration and housing demand. Its branded network, product mix and export exposure are positives, while energy costs, fragmentation and real-estate cyclicality remain key risks
Show more
Detailed Analysis
Indian domestic tiles market is projected to grow at approximately 9.7% CAGR during FY25–FY29
Environmental compliance, gas/power costs and construction-cycle exposure create moderate risk
Approximately 21.1% of FY26 product sales came from outside India, providing meaningful geographical diversification
Management
15.0%
5.0/5
Varmora benefits from experienced promoter leadership, substantial retained ownership and broad independent Board representation. Governance is broadly adequate, though promoter-group share pledges, group-company transactions and outstanding legal matters warrant monitoring after listing
Show more
Detailed Analysis
Promoter-led business with a long operating history in ceramics and tiles since 2003
Independent Directors constitute 50.0% of the Board, with 3 Independent Directors out of a total Board strength of 6
Certain promoter-group shares are pledged and material proceedings exist, resulting in a governance deduction
Group structure involves associates, joint ventures and promoter-linked entities; disclosed transactions require monitoring
Valuation
20.0%
2.0/5
Varmora is aggressively valued on earnings, with a ~30% P/E premium to the peer average and ~62% premium to the median. EV/EBITDA and P/B are closer to peers, but current RoNW does not clearly justify the sizeable P/E premium
Show more
Detailed Analysis
The P/E is 60.7x, ~29.5% premium to peer average and ~61.5% premium to median
EV/EBITDA is 14.8x, approximately ~4.7% premium to peer average
Pro-forma P/B is ~3.0x, approximately ~11% premium to peer average
Merchant Banker Track Record
10.0%
5.0/5
Varmora is backed by an exceptionally strong BRLM consortium with extensive institutional distribution capability and hundreds of completed mainboard mandates. Execution quality is therefore a major positive, although merchant-banker strength cannot compensate for an expensive IPO valuation
Show more
Detailed Analysis
Strong historical franchise quality and extensive mainboard execution
Deep institutional distribution and strong book-building capability
JM ~81–85%, SBI ~81–83% and Goldman Sachs ~73% of historic IPOs have listed positively
All three are established top-tier institutional ECM franchises
TOTAL
100%
3.3/5
Weighted Composite Score
Issue Price
₹140.0 to ₹148.0
As of 18 Sep 2026
GMP
₹10.0
As of 18 Sep 2026
Estimated Gain / Loss
+6.8%
Lot Size
101.0 Shares
Grey Market Premium (GMPs) are shared for knowledge purpose only. PrEqt doesn’t promote or execute the trades.
| Issue Size (in Cr) | |
|---|---|
| Overall | ₹708.0 Cr |
| Fresh Issue | ₹320.0 Cr |
| Offer for Sale | ₹388.0 Cr |
Minimum Investment
₹14,948.0 / 10,201 shares

Merchant Banker
JM Financial Ltd., Goldman Sachs (India) Securities Pvt. Ltd, SBI Capital Markets
JM Financial Ltd.
Goldman Sachs (India) Securities Pvt. Ltd
SBI Capital Markets
IPO Document
Offer Start Date
Offer End Date
Valuation
Revenue (FY'26)
PAT (FY'26)
Issue Size (in Cr)
Face Value
₹ 2.0Offer Price
₹ 148.0Lot Size
101.0 sharesSale Type
Fresh capital cum OFSPAT (FY'26)
₹ 55.1 CrPAT Margin (FY'26)
3.5 %P/E Multiple
60.7xEBITDA (FY'26)
₹ 221.6 CrCAGR Growth 2Y
2.7 %ROE (FY'26)
6.8 %ROCE (FY'26)
9.9 %Price to Book Value
3.0xDebt/Equity
0.4xCompany Website
www.varmora.comExplore new deals
Overview
Fund Allocation
Total: ₹0 CrSource:Company DRHP
Timeline
IPO Open Date
To Be Announced
IPO Close Date
To Be Announced
Tentative Allotment
To Be Announced
Initiation of Refunds
To Be Announced
Credit of Shares to Demat
To Be Announced
Tentative Listing Date
To Be Announced
Business
Products
Business Model
Geographical Presence
Sales Channel
Key Risk Factor
Financial Highlights
Income Statement
Revenue growth with EBITDA and PAT margins
| Financial Metric | FY 2024 | FY 2025 | FY 2026 |
|---|---|---|---|
| Revenue (₹ Cr) | 1,472.6 | 1,492.7 | 1,562.5 |
| Growth (%) | - | 0.7% | 4.6% |
| EBITDA (₹ Cr) | 150.3 | 198.3 | 221.6 |
| EBITDA Margin (%) | 10.2% | 13.3% | 14.2% |
| PAT (₹ Cr) | 44.9 | 30.8 | 55.1 |
| PAT Margin (%) | 3.1% | 2.1% | 3.5% |
OBSERVATIONS & INSIGHTS
Revenue growth remained moderate, rising 0.7% in FY25 and 4.6% in FY26. The business mix improved faster than topline as premium GVT / technical products gained share
EBITDA increased from INR 150.3 Cr in FY24 to INR 221.6 Cr in FY26, while margin expanded from 10.2% to 14.2%, supported by higher in-house manufacturing and premium product mix
PAT declined in FY25 to INR 30.8 Cr before recovering 79.0% to INR 55.1 Cr in FY26. The FY26 recovery reflects stronger operating profit and lower finance cost, partly offset by depreciation. PAT margin improved to 3.5% in FY26 but remained materially below EBITDA margin because depreciation, finance cost and taxes absorb a significant portion of operating profit
Balance Sheet
| Financial Metric | FY 2024 | FY 2025 | FY 2026 |
|---|---|---|---|
| Net Worth | ₹ 678.6 Cr | ₹ 722.9 Cr | ₹ 0.0 Cr |
| Total Assets | ₹ 1,476.2 Cr | ₹ 1,589.8 Cr | ₹ 1,509.9 Cr |
| Total Borrowing | ₹ 412.9 Cr | ₹ 505.2 Cr | ₹ 0.0 Cr |
| Reserves & Surplus | ₹ 625.0 Cr | ₹ 677.6 Cr | ₹ 740.0 Cr |
OBSERVATIONS & INSIGHTS
Total assets peaked at INR 1,589.8 Cr in FY25 and reduced to INR 1,509.9 Cr in FY26 as fixed assets and inventory moderated
Equity increased consistently to INR 810.2 Cr in FY26, while total borrowings declined from INR 505.2 Cr in FY25 to INR 357.9 Cr in FY26
Inventory reduced by approximately INR 37.6 Cr in FY26, supporting working-capital release and operating cash generation
Trade receivables remained broadly flat at INR 382.7 Cr in FY26, keeping debtor days elevated relative to FY24
Cash Flow
| Financial Metric | FY 2024 | FY 2025 | FY 2026 |
|---|---|---|---|
CFO (₹ Cr) Cash generated from core business operations. | +88.3 Cr | +63.2 Cr | +234.1 Cr |
CFI (₹ Cr) Cash used for investments and long-term assets. | -336.6 Cr | -119.9 Cr | -46.0 Cr |
CFF (₹ Cr) Cash flow related to funding and borrowings. | +115.1 Cr | +46.6 Cr | -188.3 Cr |
Working Capital
| Efficiency Metric | FY 2023 | FY 2024 | FY 2025 |
|---|---|---|---|
Debtor Days Average number of days taken to collect customer payments. | - | - | - |
Creditor Days Average time taken to pay suppliers and vendors. | - | - | - |
Inventory Days Average number of days inventory remains unsold. | - | - | - |
CCC (Cash Conversion Cycle) (Debtor Days + Inventory Days - Creditor Days) | - | - | - |
Financial Ratios
Measures the company’s leverage relative to shareholder equity.
OBSERVATIONS & INSIGHTS
ROE declined from 6.4% in FY24 to 4.1% in FY25 following weaker profitability, before recovering to 6.8% in FY26 as PAT improved materially
ROCE moderated from 8.0% in FY24 to 6.3% in FY25, then increased to 9.9% in FY26, reflecting stronger operating profitability and a lower borrowing base
Debt / Equity increased slightly to 0.7x in FY25 before improving to 0.4x in FY26. Net Debt / Equity similarly reduced to 0.3x in FY26, reflecting deleveraging and a stronger equity base
The current ratio remained above 1.0x throughout the period and improved from 1.5x in FY25 to 1.7x in FY26, indicating better short-term liquidity
Interest coverage weakened from 3.1x in FY24 to 1.9x in FY25, before recovering to 2.9x in FY26 as EBIT improved and finance costs declined
Industry Overview
Industry Drivers
Housing, Real Estate and Renovation
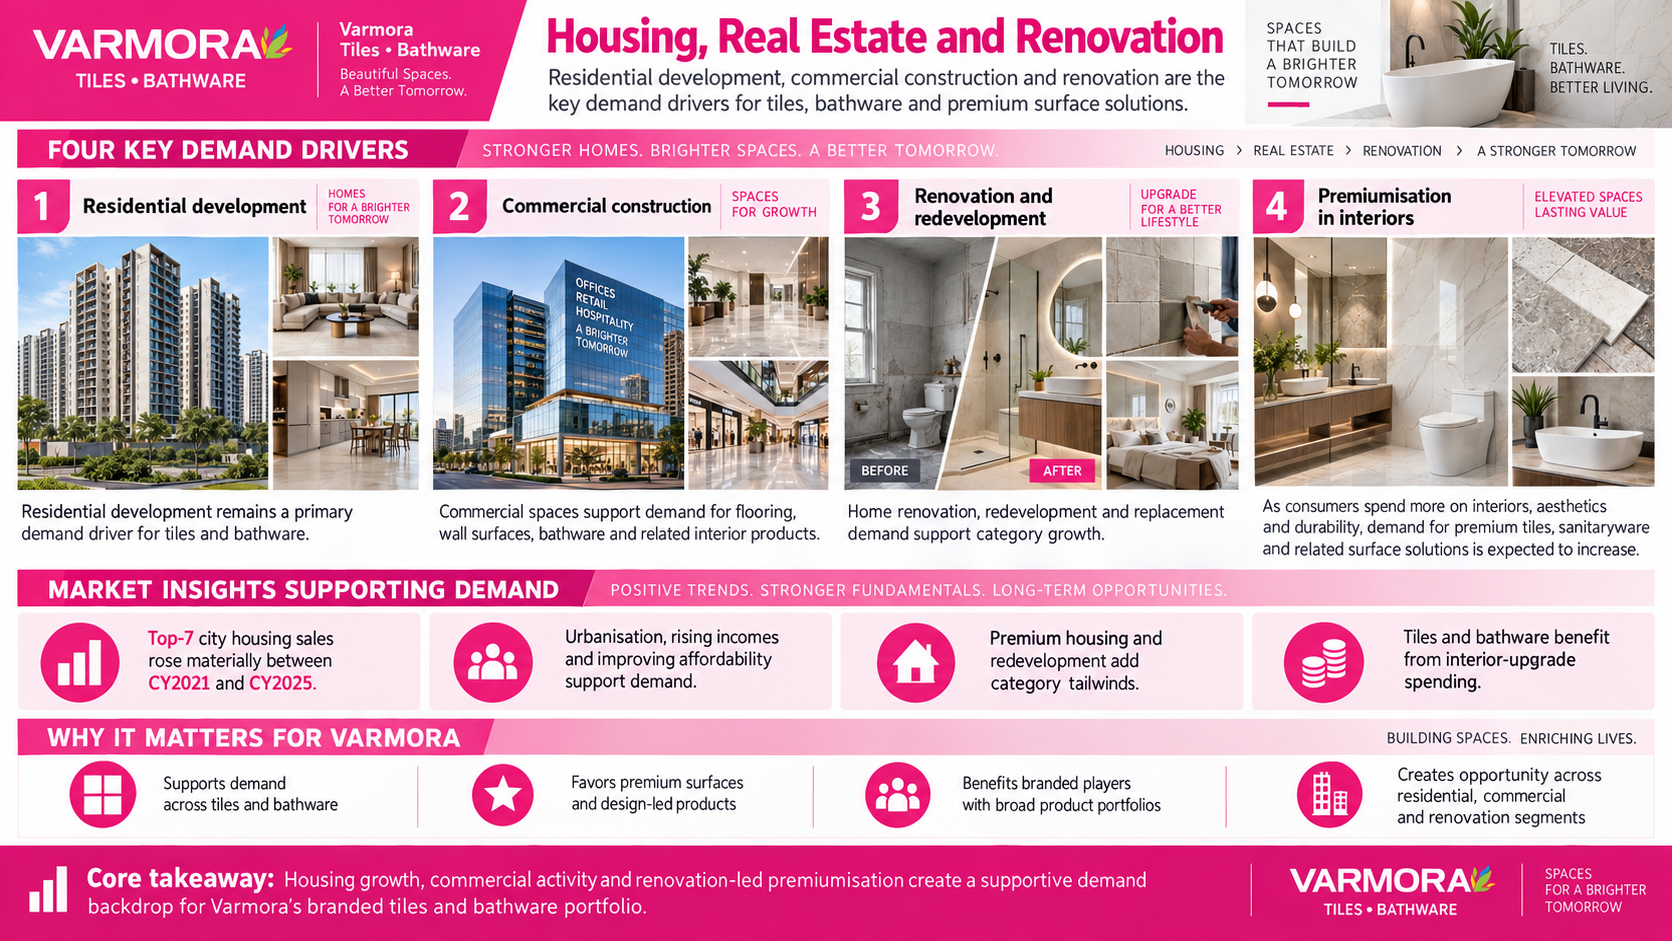
India’s relatively low tile penetration provides significant structural headroom for long-term industry growth. Per-capita tile consumption stood at approximately 0.8 sq. m. in FY24, considerably below around 4.0 sq. m. in China and 3.4 sq. m. in Brazil, indicating scope for greater adoption as incomes, urbanisation and housing quality improve. Technopak expects domestic tile consumption to increase to approximately 1.0 sq. m. by FY30. Growth is likely to be supported by sustained residential construction, redevelopment of existing properties, home renovation and increasing preference for tiles over conventional flooring materials such as natural stone. Expansion of urban housing, improving affordability and greater consumer focus on aesthetics, hygiene and ease of maintenance are also broadening the addressable market. Replacement and renovation demand can further complement new-construction demand, creating a more diversified growth base for organised tile manufacturers over the medium to long term.
The key points are:
Low domestic penetration: India’s per-capita tile consumption of approximately 0.8 sq. m. remains substantially below major international markets, providing long-term growth headroom
Residential construction: New housing development and urbanisation continue to increase demand for flooring, wall tiles and related surface solutions
Renovation and redevelopment: Upgradation of existing homes and redevelopment projects are creating recurring demand beyond new construction
Premiumisation Toward GVT and Large-Format Surfaces
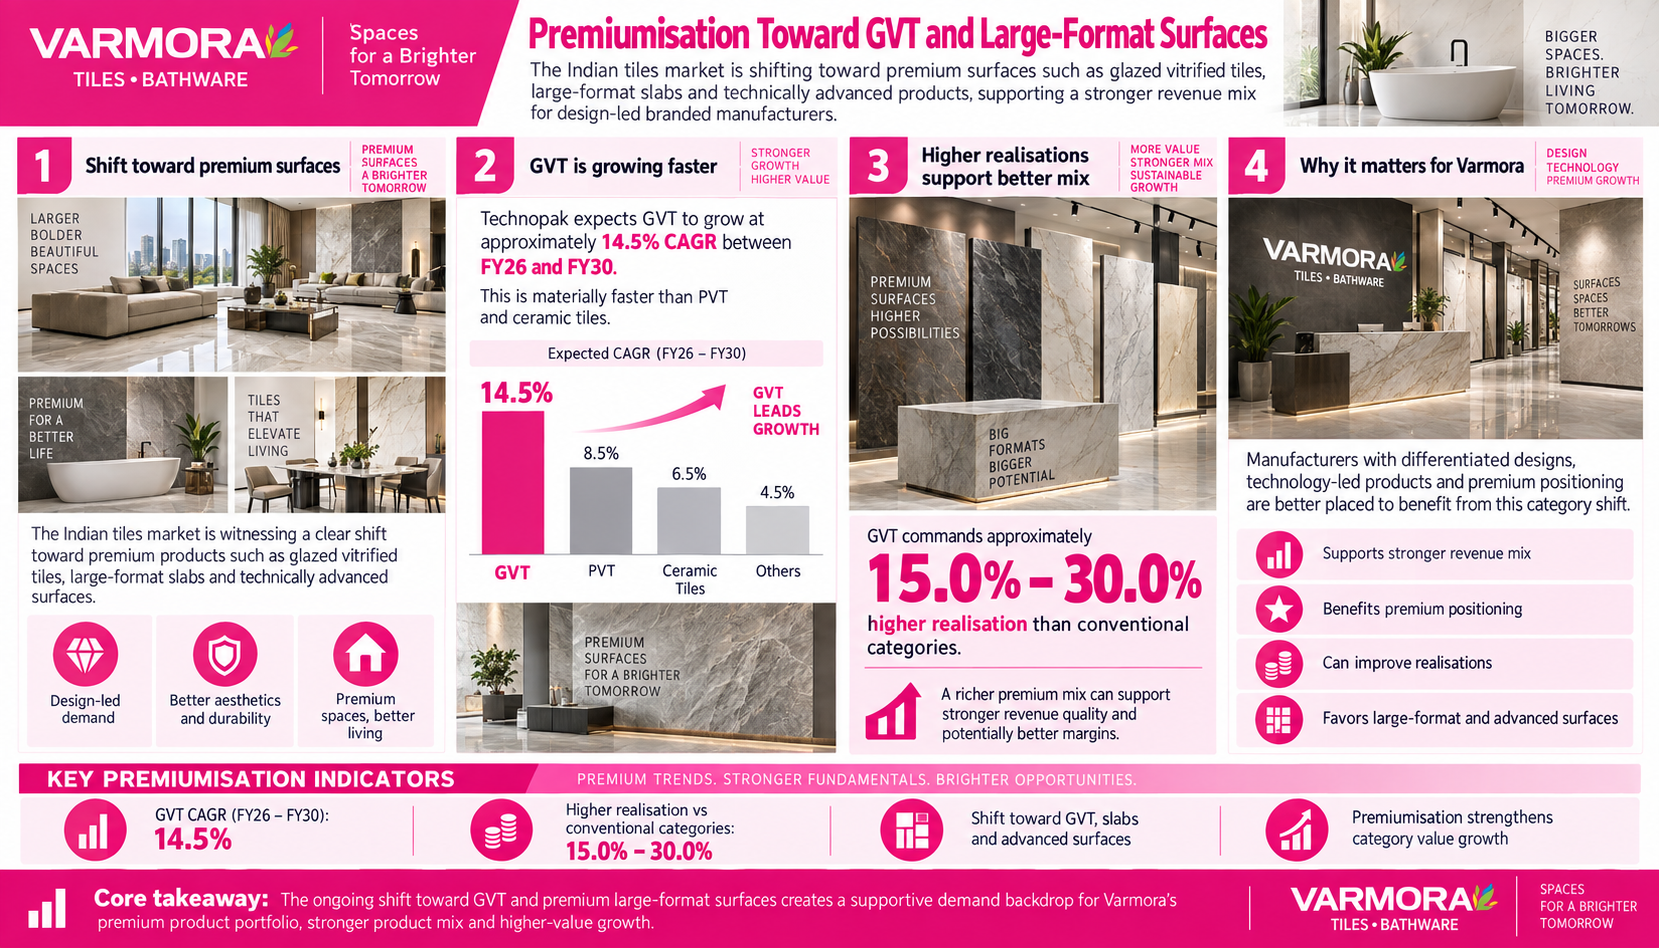
The Indian tile industry is witnessing a gradual premiumisation of its product mix, with consumers increasingly moving toward Glazed Vitrified Tiles (GVT) and larger-format surfaces. GVT offers greater design flexibility, durability, lower maintenance requirements and a wider range of premium finishes compared with conventional ceramic and polished vitrified tiles. These characteristics have increased adoption across premium residential developments, commercial properties and renovation projects. GVT accounted for approximately 36.5% of Indian tile-industry revenue in FY26 and is expected to increase to approximately 45.5% by FY30, reflecting a meaningful structural shift in demand. Technopak projects the category to expand at approximately 14.5% CAGR during FY26-FY30, faster than conventional ceramic and PVT categories. Importantly, GVT can command approximately 15.0%-30.0% higher realisations, meaning that a rising share of premium products can support revenue growth, better product mix and potentially stronger profitability for manufacturers with appropriate design and production capabilities.
The key points are:
Faster-growing category: GVT is projected to grow at approximately 14.5% CAGR during FY26-FY30, materially faster than traditional tile categories
Rising revenue share: GVT’s industry revenue contribution is expected to increase from approximately 36.5% in FY26 to 45.5% by FY30
Higher realisations: Premium GVT products can command approximately 15.0%-30.0% higher realisations than conventional alternatives
Shift Toward Organised and Branded Players
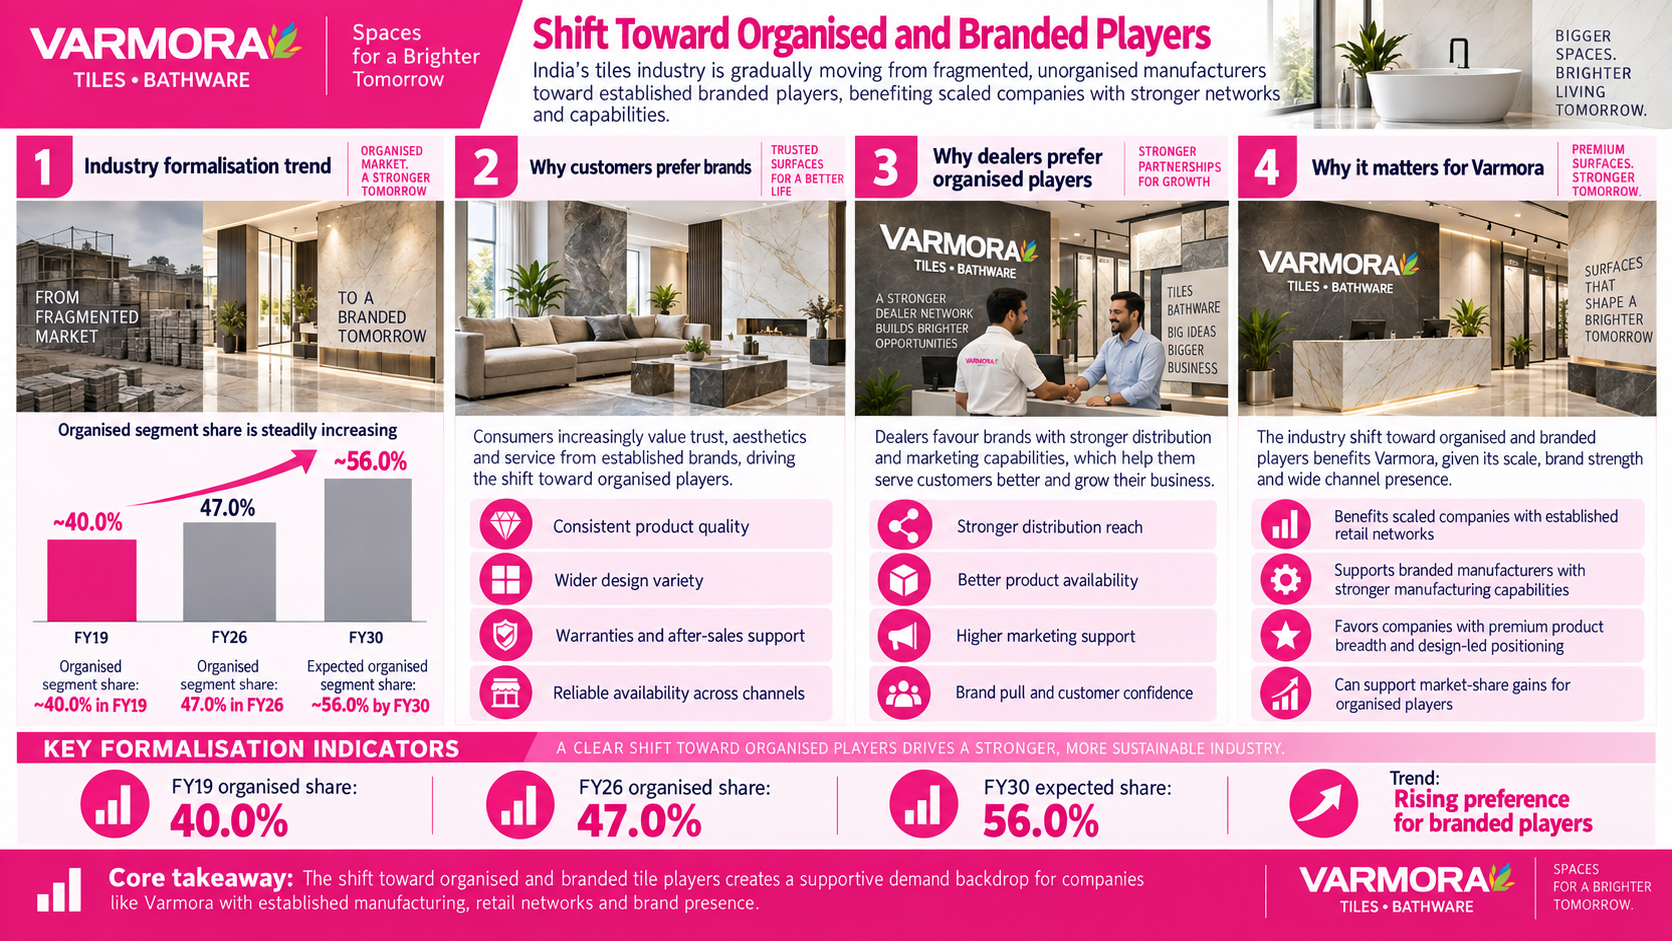
India’s tile market is gradually transitioning from fragmented regional manufacturing toward larger organised brands with stronger distribution networks, manufacturing capabilities and consumer recall. The organised segment’s share increased from approximately 40.0% in FY19 to 47.0% in FY26 and is expected to reach approximately 56.0% by FY30, highlighting a structural consolidation of industry demand. Consumers are increasingly placing greater importance on consistent product quality, modern designs, warranties, reliable availability and after-sales service, while dealers generally prefer brands that provide dependable supply, broad portfolios and stronger marketing support. Organised manufacturers are therefore better positioned to benefit from increasing brand awareness and formalisation of retail distribution. National reach, product consistency, extensive dealer networks and the ability to introduce new designs at scale can strengthen customer preference and improve competitive positioning. As purchasing decisions become increasingly influenced by brand reputation and service quality, established players can potentially gain share from smaller unorganised manufacturers.
The key points are:
Industry formalisation: The organised segment’s share is expected to increase from approximately 47.0% in FY26 to 56.0% by FY30
Greater brand preference: Consumers increasingly value product consistency, design variety, warranties and dependable after-sales support
Dealer-network advantage: Organised manufacturers benefit from wider distribution, better product availability and stronger dealer relationships
Risks in the Industry
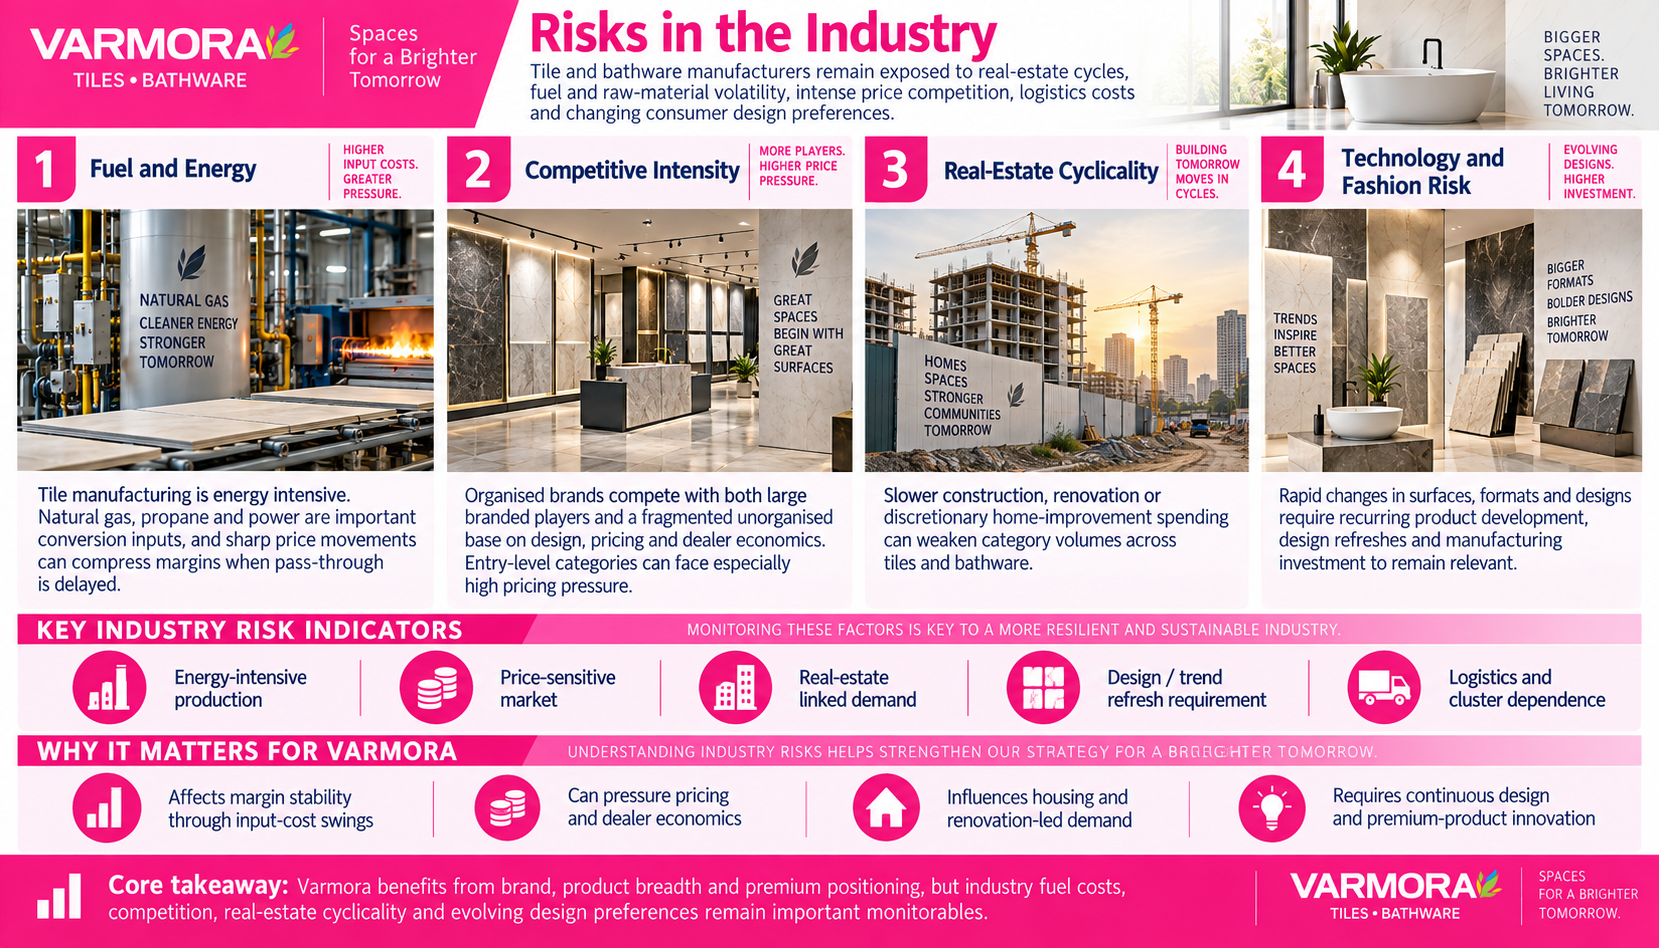
The tiles industry remains cyclical and exposed to movements in residential and commercial construction activity. A slowdown in real-estate launches, housing sales or renovation spending can directly affect demand and capacity utilisation. The sector is also highly competitive, with organised manufacturers competing against both large branded peers and numerous regional and unorganised producers, which can create pricing pressure, particularly in commoditised product categories. Manufacturing is energy-intensive, with natural gas, propane, electricity and transportation representing important operating inputs. Sharp increases in fuel or logistics costs can compress industry margins where manufacturers are unable to pass costs through immediately. The concentration of Indian tile manufacturing around the Morbi cluster also provides supply-chain efficiencies but creates exposure to regional infrastructure, fuel availability and regulatory developments. Product preferences are also changing rapidly as consumers move toward larger formats, premium finishes and technically differentiated surfaces. Manufacturers therefore require continuous investment in product development, machinery, design and distribution. Companies that fail to adapt their portfolio to changing design trends may face weaker realisations, inventory obsolescence or loss of market share.
The key risks are:
Fuel and energy: natural gas, propane and power are important conversion inputs; sharp price movements can compress margins where pass-through is delayed
Competitive intensity: organised brands compete with both large branded players and a fragmented unorganised base on design, pricing and dealer economics
Real-estate cyclicality: slower construction, renovation or discretionary home-improvement spending can weaken volumes
Technology and fashion risk: rapid changes in surfaces, formats and designs require recurring product development and manufacturing investment
Government Policy Support
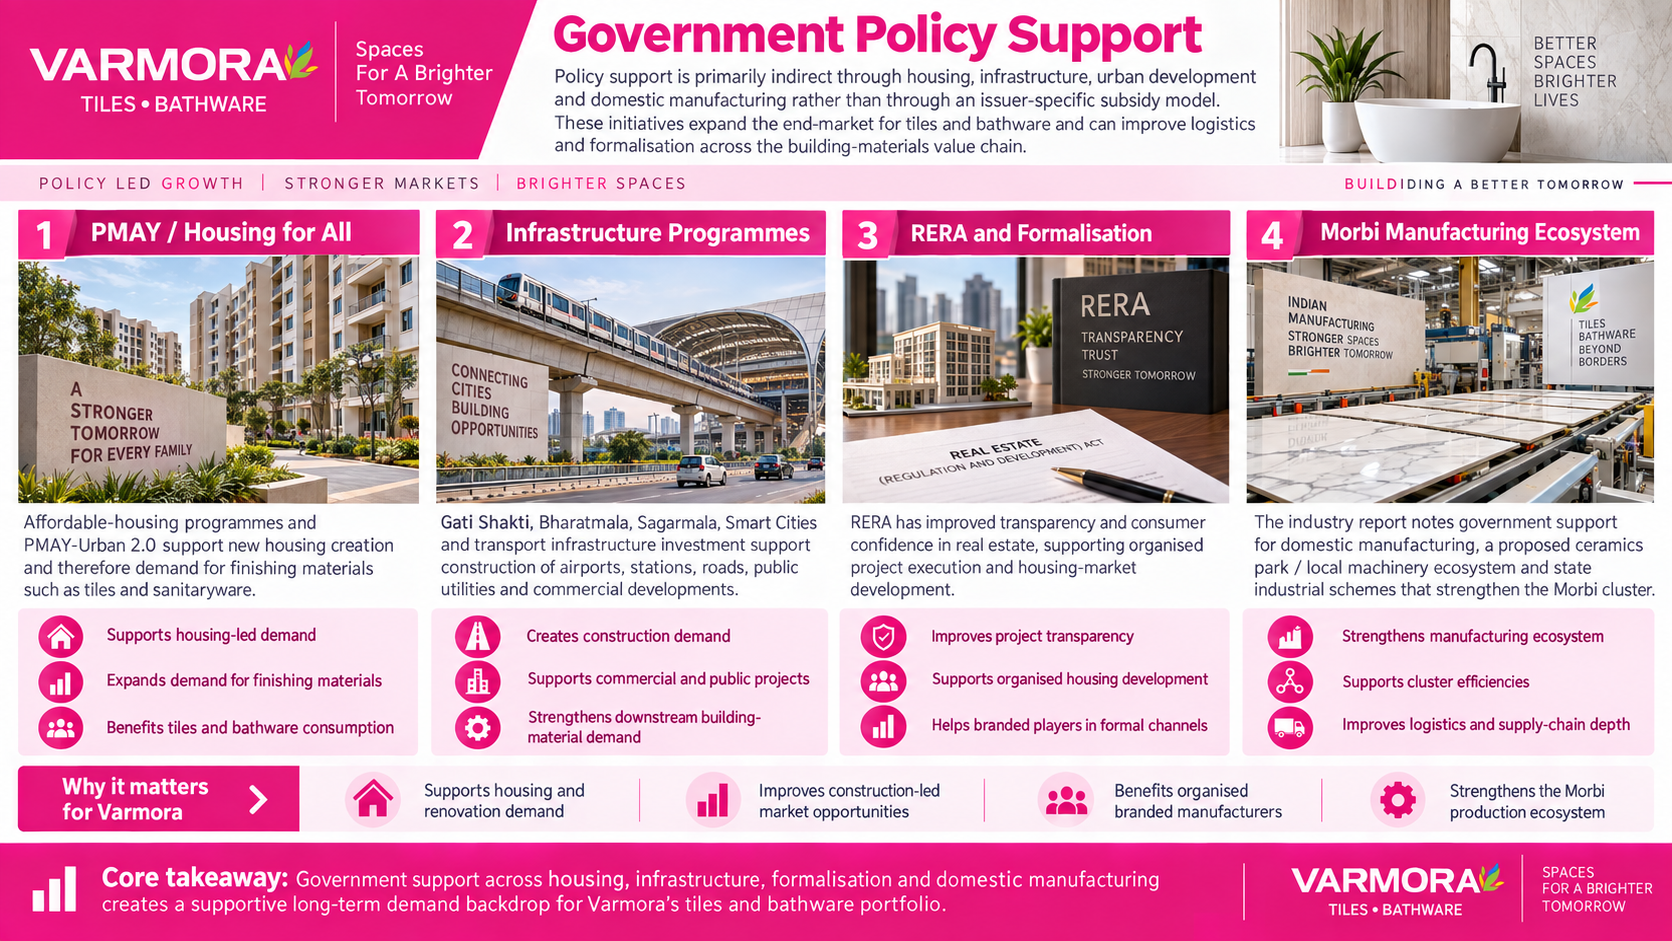
Policy support is primarily indirect through housing, infrastructure, urban development and domestic manufacturing rather than through an issuer-specific subsidy model. These initiatives expand the end-market for tiles and bathware and can improve logistics and formalisation across the building-materials value chain.
Key policies are:
PMAY / Housing for All: affordable-housing programmes and PMAY-Urban 2.0 support new housing creation and therefore demand for finishing materials such as tiles and sanitaryware
Infrastructure programmes: Gati Shakti, Bharatmala, Sagarmala, Smart Cities and transport infrastructure investment support construction of airports, stations, roads, public utilities and commercial developments
RERA and formalisation: RERA has improved transparency and consumer confidence in real estate, supporting organised project execution and housing-market development
Morbi manufacturing ecosystem: the industry report notes government support for domestic manufacturing, a proposed ceramics park / local machinery ecosystem and state industrial schemes that strengthen the Morbi cluster
Fundraise/Future Plans
Shareholding
Pre-issue shareholding
Promoter Holding 0.0%
Post-Issue Shareholding
Promoter Holding 0.0%
Category
Pre-Issue%Post-Issue%
Promoters
Bhavesh Vallabhdas Varmora
9.5%8.6%
Hiren R Varmora
9.4%8.5%
Pramodkumar Parsotambhai Patel
6.6%5.9%
Promoter Group
26.5%24.0%
Total Promoter Holding
52.0%47.0%
Additional Shareholders
Other Shareholders
48.0%53.0%
Total Additional Holding
48.0%53.0%
Total Shareholding
100.0%100.0%
- Overview
- Business
- Financial Highlights
- Industry Overview
- Fundraise/Future Plans
- Documentation
Get the Preqt App and keep in touch around the clock!
 Monitor your investments in real-time.
- Receive tailored deal suggestions.
- Get real-time updates and alerts.
