


Vivriti Capital
Financing emerging enterprisesPowering business ambitions
IPO Review and Rating
Considerable
Overall Recommendation
The operating business has scaled strongly, with total income increasing at a 35.4% FY23-FY26 CAGR. FY26 income reaching INR 1,665.0 Cr, PAT increasing 20.1% to INR 264.3 Cr, AUM increasing 27.0% to INR 11,513 Cr, PAT margin at 15.9%, ROE at 12.4% and CRAR at 21%. The principal financial constraints are 3.9x leverage, negative operating cash flow in both comparable years and GNPA increasing to 2.2% from 1.9% in FY25, although NNPA remains contained at 1.2%, Management metrics are comparatively strong, with 20+ years of founder experience and 66.7% Board independence
PARAMETER
WEIGHT
SCORE
KEY FACTORS
Financial Performance
25.0%
3.0/5
35.4% 3-year income CAGR, 26.9% 3-year PAT CAGR, 15.9%
Show more
Detailed Analysis
Total income increased from approximately INR 671.0 Cr in FY23 to INR 1,050.7 Cr in FY24, INR 1,364.0 Cr in FY25 and INR 1,665.0 Cr in FY26, resulting in a 35.4% 3-year CAGR
PAT increased from INR 129.3 Cr in FY23 to INR 191.3 Cr in FY24, INR 220.0 Cr in FY25 and INR 264.3 Cr in FY26, representing a 20.1% FY26 YoY growth
FY26 reported D/E stood at 3.9x, or 3.6x adjusted, while borrowings stood at approximately INR 9,119 Cr
CRAR stood at 21% in FY26, comfortably above the 15.0% regulatory requirement, while the capital base reached approximately INR 2,431.8 Cr
Industry
25.0%
2.6/5
16.1% systemic-credit growth, 24.5% growth in bank funding to NBFCs
Show more
Detailed Analysis
India's systemic credit expanded 16.1% in FY26, while bank credit to NBFCs grew 24.5%, reversing the 5.7% decline in FY25
Competition remains structurally high. RBI maintains a broad universe of registered NBFCs, while Vivriti competes against banks
INR 11,513 Cr AUM in a highly fragmented multi-player NBFC market
Management
25.0%
4.2/5
20+ years of founder experience
Show more
Detailed Analysis
Founder Vineet Sukumar has 20+ years of financial-services experience, including prior roles at Northern Arc, Standard Chartered and Tata Group
Current Board comprises 6 directors, including 4 Independent Directors, resulting in 66.7% independent representation
No material promoter pledge or major promoter litigation is identified
RPTs at approximately 9.0% of revenue
Valuation Metrics
25.0%
2.6/5
A ~60% P/E premium and 4.6x P/B
Show more
Detailed Analysis
The company has a P/E of ~45, where the median P/E among its peer is ~22
The unlisted price showed roughly 20% movement in a 52-week range
TOTAL
100%
3.1/5
Weighted Composite Score
Per Share Price
₹925.0
As of 14 Oct 2026
Lot Size
1,000.0 Shares
Minimum Investment
₹9,25,000.0 / 1,000 shares
Market Cap. (₹ Cr)
Revenue FY’26
PAT FY’26
P/E Multiple
Face Value
₹ 10.0Lot Size
1,000.0 sharesPAT FY’26
₹ 264.3 CrPAT Margin (%)
15.9 %P/E Multiple
19.7xCAGR Growth 3Y
35.4 %ROE (FY’26)
12.5 %ROCE (FY’26)
11.2 %Price to Book Value ratio
4.6xDebt/Equity (FY’26)
4.0xMerchant banker appointed
❌ NoCompany Website
www.vivriticapital.comDisclaimer: Unlisted shares are unregulated & illiquid. This is NOT investment advice. Please do your own due diligence before investing.
Minimum Investment
₹9,25,000.0 / 1,000 sharesShares Lot 1000 X 1
Investment amount
₹9,25,000.0
Overview
Business
Services
Business Model
Geographical Presence
Sales Channel
Financial Highlights
Income Statement
Revenue growth with EBITDA and PAT margins
| Financial Metric | FY 2024 | FY 2025 | FY 2026 |
|---|---|---|---|
| Revenue (₹ Cr) | 1,050.7 | 1,364.0 | 1,665.0 |
| Growth (%) | 56.5% | 29.8% | 22.1% |
| EBITDA (₹ Cr) | 255.4 | 290.6 | 356.8 |
| EBITDA Margin (%) | 24.3% | 21.3% | 21.4% |
| PAT (₹ Cr) | 191.3 | 220.0 | 264.3 |
| PAT Margin (%) | 18.2% | 16.1% | 15.9% |
OBSERVATIONS & INSIGHTS
Total income increased from INR 1,050.7 Cr in FY24 to INR 1,665.0 Cr in FY26
Growth remained strong but moderated from 56.5% in FY24 to 22.1% in FY26 as the platform scaled from a larger base
The financing-profit / PBT proxy increased from INR 255.4 Cr in FY24 to INR 356.8 Cr in FY26. Margin compressed from 24.3% to roughly 21.4%, reflecting higher funding costs, credit provisions and the changing portfolio mix
PAT increased from INR 191.3 Cr in FY24 to INR 264.3 Cr in FY26, implying a roughly 17.6% two-year CAGR
PAT margin moderated from 18.2% to 15.9%, so future earnings growth will increasingly depend on scale, funding-cost optimisation and asset-quality discipline rather than margin expansion
Balance Sheet
| Financial Metric | FY 2024 | FY 2025 | FY 2026 |
|---|---|---|---|
| EQUITY & LIABILITIES | ₹ 9,188.6 Cr | ₹ 10,468.4 Cr | ₹ 12,638.9 Cr |
| Net Worth | ₹ 1,893.9 Cr | ₹ 2,146.9 Cr | ₹ 2,431.8 Cr |
| Share Capital | ₹ 1,893.9 Cr | ₹ 2,146.9 Cr | ₹ 2,431.8 Cr |
| Reserves & Surplus | ₹ 0.0 Cr | ₹ 0.0 Cr | ₹ 0.0 Cr |
| Total Liabilities | ₹ 7,294.7 Cr | ₹ 8,321.5 Cr | ₹ 10,207.1 Cr |
| Current Liabilities | ₹ 7,274.3 Cr | ₹ 8,305.6 Cr | ₹ 10,186.3 Cr |
| Borrowings | ₹ 6,568.4 Cr | ₹ 7,470.5 Cr | ₹ 9,118.7 Cr |
| Subordinated Liability | ₹ 0.0 Cr | ₹ 0.0 Cr | ₹ 202.9 Cr |
| Other Current Liabilities | ₹ 705.9 Cr | ₹ 835.1 Cr | ₹ 864.7 Cr |
| Non-Current Liabilities | ₹ 20.4 Cr | ₹ 15.9 Cr | ₹ 20.8 Cr |
| Borrowings | ₹ 0.0 Cr | ₹ 0.0 Cr | ₹ 0.0 Cr |
| Other Non-Current Liabilities | ₹ 20.4 Cr | ₹ 15.9 Cr | ₹ 20.8 Cr |
| ASSETS | ₹ 9,188.6 Cr | ₹ 10,468.4 Cr | ₹ 12,638.8 Cr |
| Current Assets | ₹ 9,037.9 Cr | ₹ 10,305.7 Cr | ₹ 12,482.6 Cr |
| Investments | ₹ 709.2 Cr | ₹ 576.8 Cr | ₹ 904.1 Cr |
| Loans | ₹ 7,302.0 Cr | ₹ 8,646.7 Cr | ₹ 10,780.3 Cr |
| Cash & Cash Equivalents | ₹ 941.5 Cr | ₹ 988.6 Cr | ₹ 602.5 Cr |
| Other Current Assets | ₹ 85.2 Cr | ₹ 93.6 Cr | ₹ 195.7 Cr |
| Non-Current Assets | ₹ 150.7 Cr | ₹ 162.7 Cr | ₹ 156.2 Cr |
| Fixed Assets | ₹ 0.0 Cr | ₹ 0.0 Cr | ₹ 0.0 Cr |
| Other Non-Current Assets | ₹ 150.7 Cr | ₹ 162.7 Cr | ₹ 156.2 Cr |
OBSERVATIONS & INSIGHTS
The balance sheet has scaled rapidly: total assets increased from INR 9,189 Cr in FY24 to INR 12,639 Cr in FY26, driven primarily by loan-book growth
Net worth increased by approximately INR 538 Cr over FY24-FY26, but borrowings expanded faster. Gross debt/equity therefore rose to 3.9x in FY26, while total debt reached roughly 74% of assets
Loans increased to approximately INR 10,780 Cr by FY26. The continued growth supports earnings scale but raises the importance of portfolio seasoning, concentration limits, underwriting consistency and collections
CRAR remained around 21%, providing a buffer above regulatory minimums. Maintaining this buffer is important because growth consumes capital and asset-quality deterioration can increase risk-weighted assets / provisioning needs
Cash Flow
| Financial Metric | FY 2023 | FY 2024 | FY 2025 |
|---|---|---|---|
CFO (₹ Cr) Cash generated from core business operations. | -1,393.4 Cr | -2,369.8 Cr | -1,076.4 Cr |
CFI (₹ Cr) Cash used for investments and long-term assets. | -362.4 Cr | +468.5 Cr | +1.7 Cr |
CFF (₹ Cr) Cash flow related to funding and borrowings. | +1,616.4 Cr | +2,032.1 Cr | +962 Cr |
Financial Ratios
Measures the company’s leverage relative to shareholder equity.
OBSERVATIONS & INSIGHTS
ROE has remained broadly in the 12% range, improving modestly to 12.4% in FY26 on the adjusted basis used by management
The return profile is solid but below the strongest listed NBFC peers, leaving room for operating and funding-efficiency gains
Leverage remains high by non-financial-company standards. FY26 gross debt/equity was 3.9x; management also presents an adjusted 3.6x ratio after treating holding-company subordinated debt as equity
Capital adequacy nevertheless remained around 21%
Interest coverage is structurally low at roughly 1.4x because interest is the principal operating cost of a lender
The more important monitorable is whether portfolio yields, fee income and credit costs preserve adequate spreads as borrowing costs change
Industry Overview
Industry Drivers
Expansion of Technological Capabilities
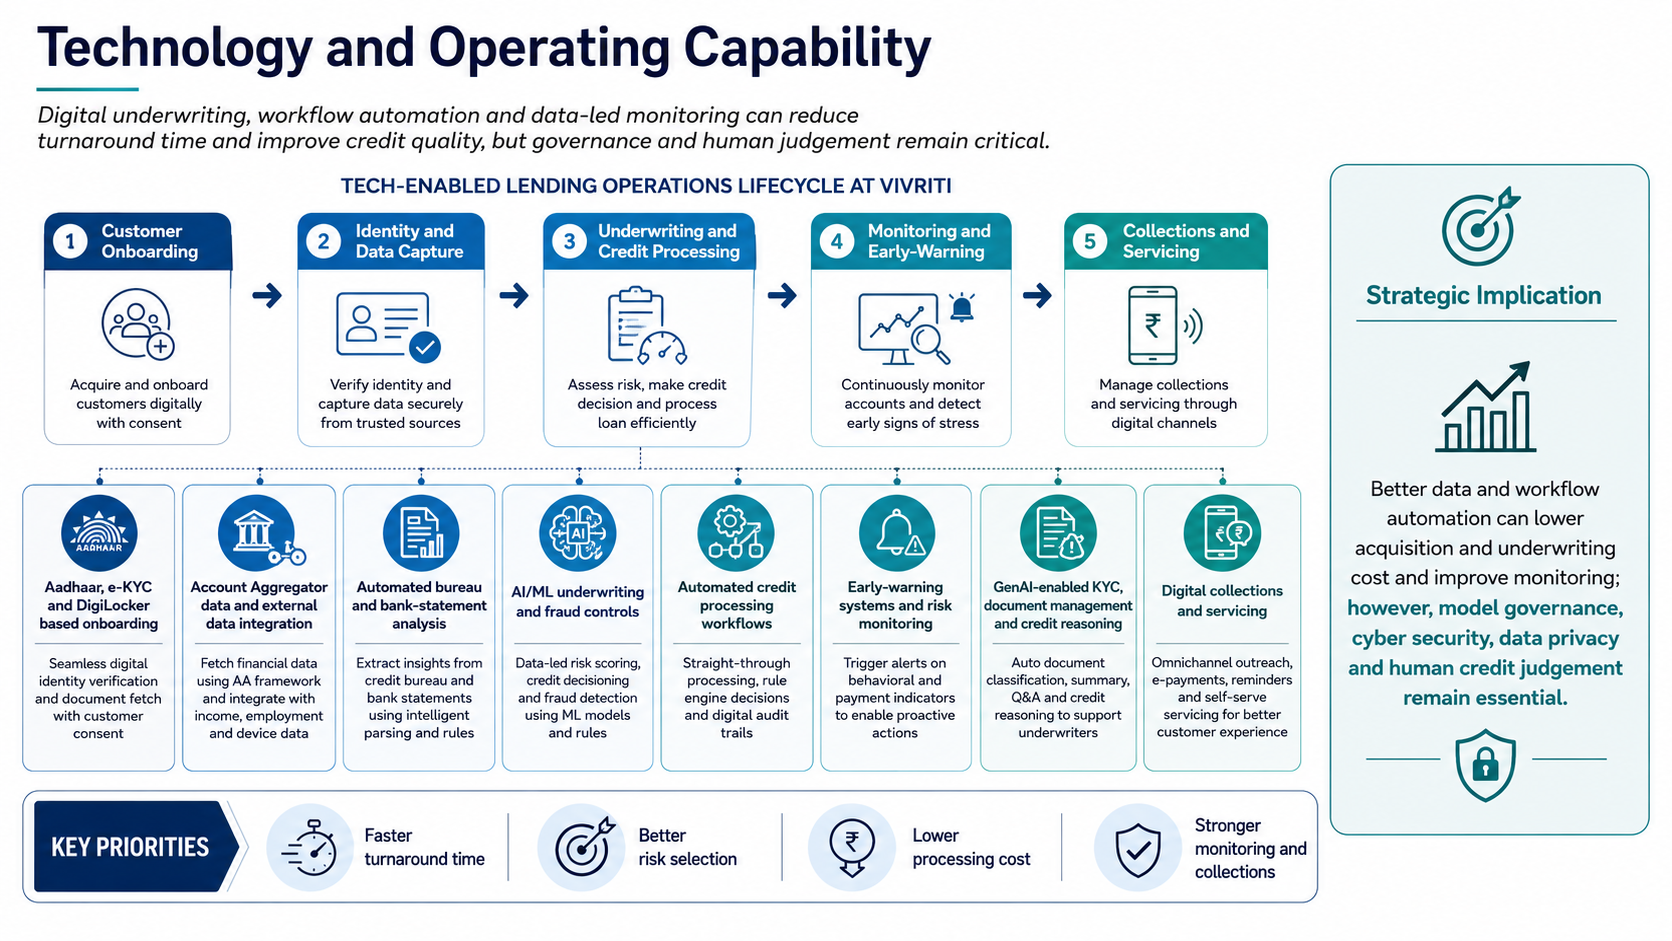
NBFCs are increasingly using Aadhaar, e-KYC, DigiLocker, Account Aggregator data, automated bureau / bank-statement analysis, AI/ML underwriting, fraud controls and digital collections to reduce turnaround times and improve risk selection
Vivriti has invested in automated credit processing, external data, early-warning systems and GenAI-enabled KYC, document management and credit reasoning
Strategic implication: better data and workflow automation can lower acquisition / underwriting cost and improve monitoring, but model governance, cyber security, data privacy
Capacity Expansion
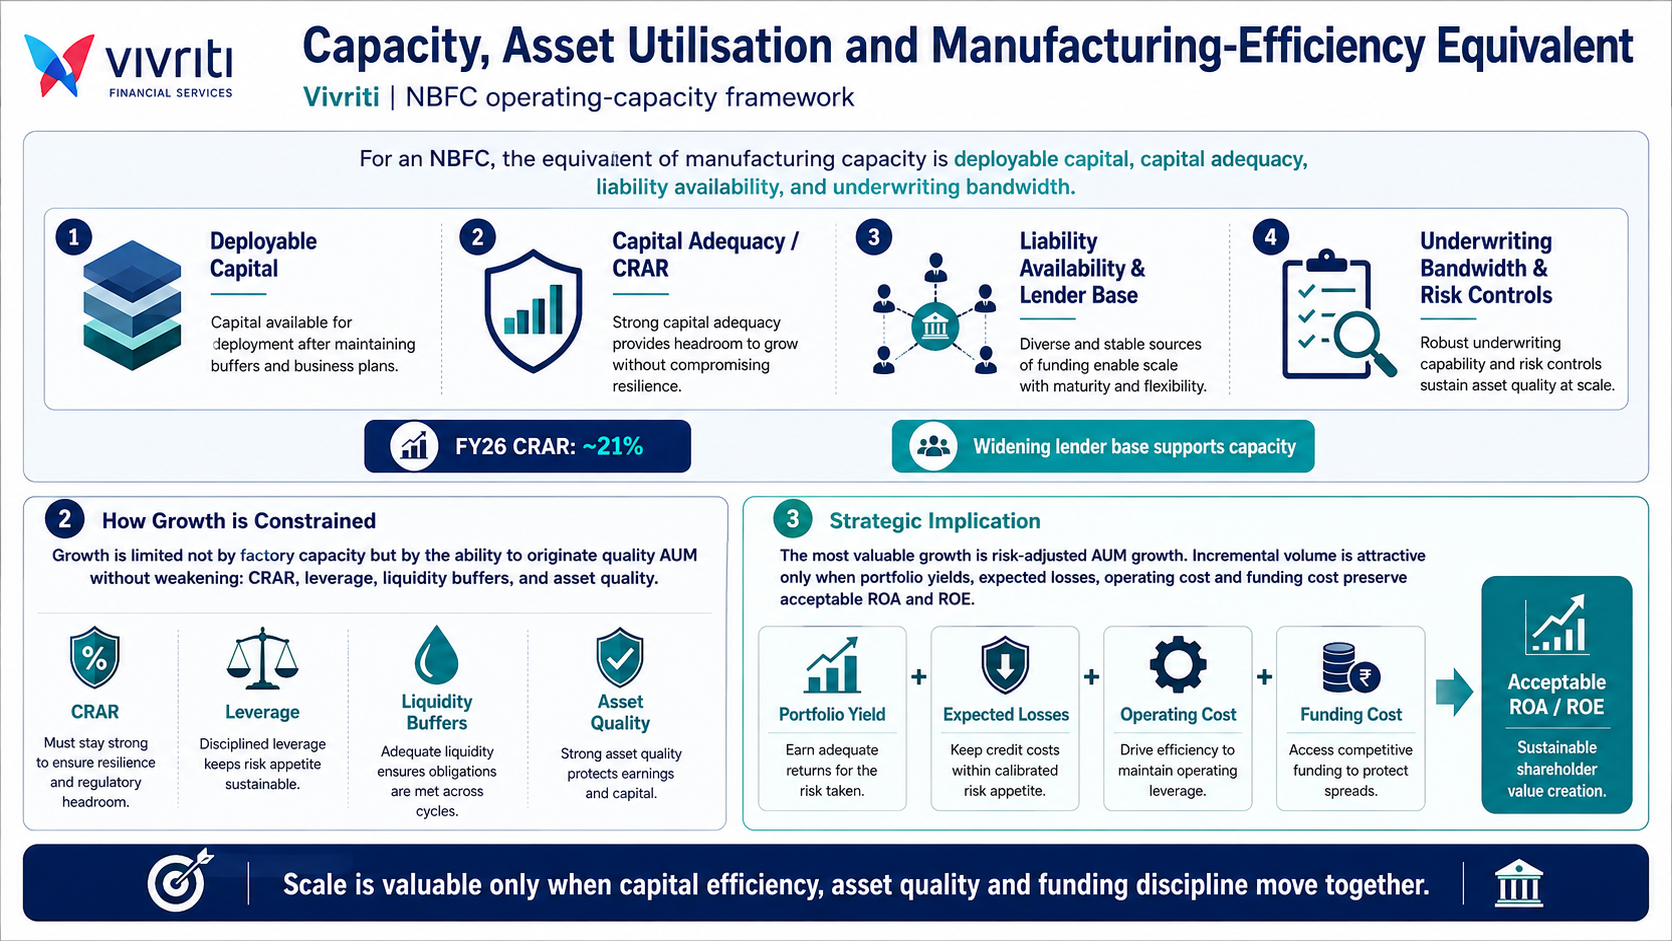
For an NBFC, the equivalent of manufacturing capacity is deployable capital, capital adequacy, liability availability and underwriting bandwidth
Growth is constrained not by factory capacity but by how much quality AUM can be originated without weakening CRAR, leverage, liquidity buffers or asset quality
Vivriti's FY26 CRAR of about 21% and widening lender base provide capacity, but rapid balance-sheet expansion continues to consume capital
Customer Relationship and Revenue Depth
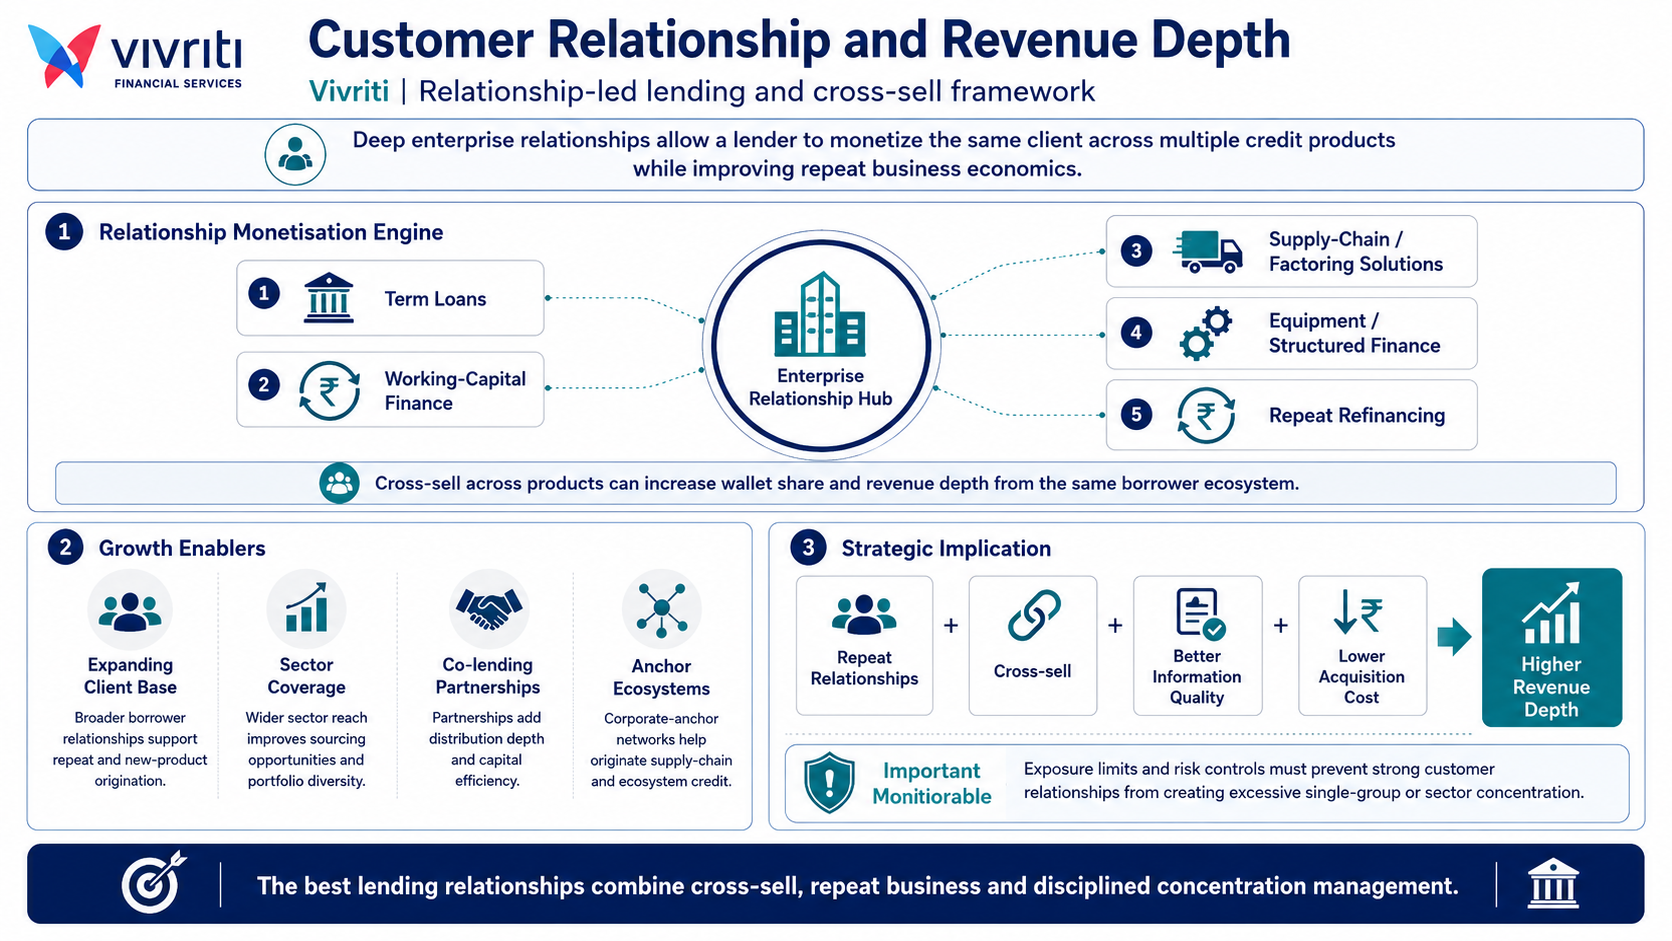
A lender with deep enterprise relationships can monetise the same client through term loans, working-capital finance, supplychain / factoring solutions, equipment structures and repeat refinancing
Vivriti's expanding client base and sector coverage support cross-sell and repeat business, while co-lending and anchor ecosystems add distribution depth
Government Policy Support
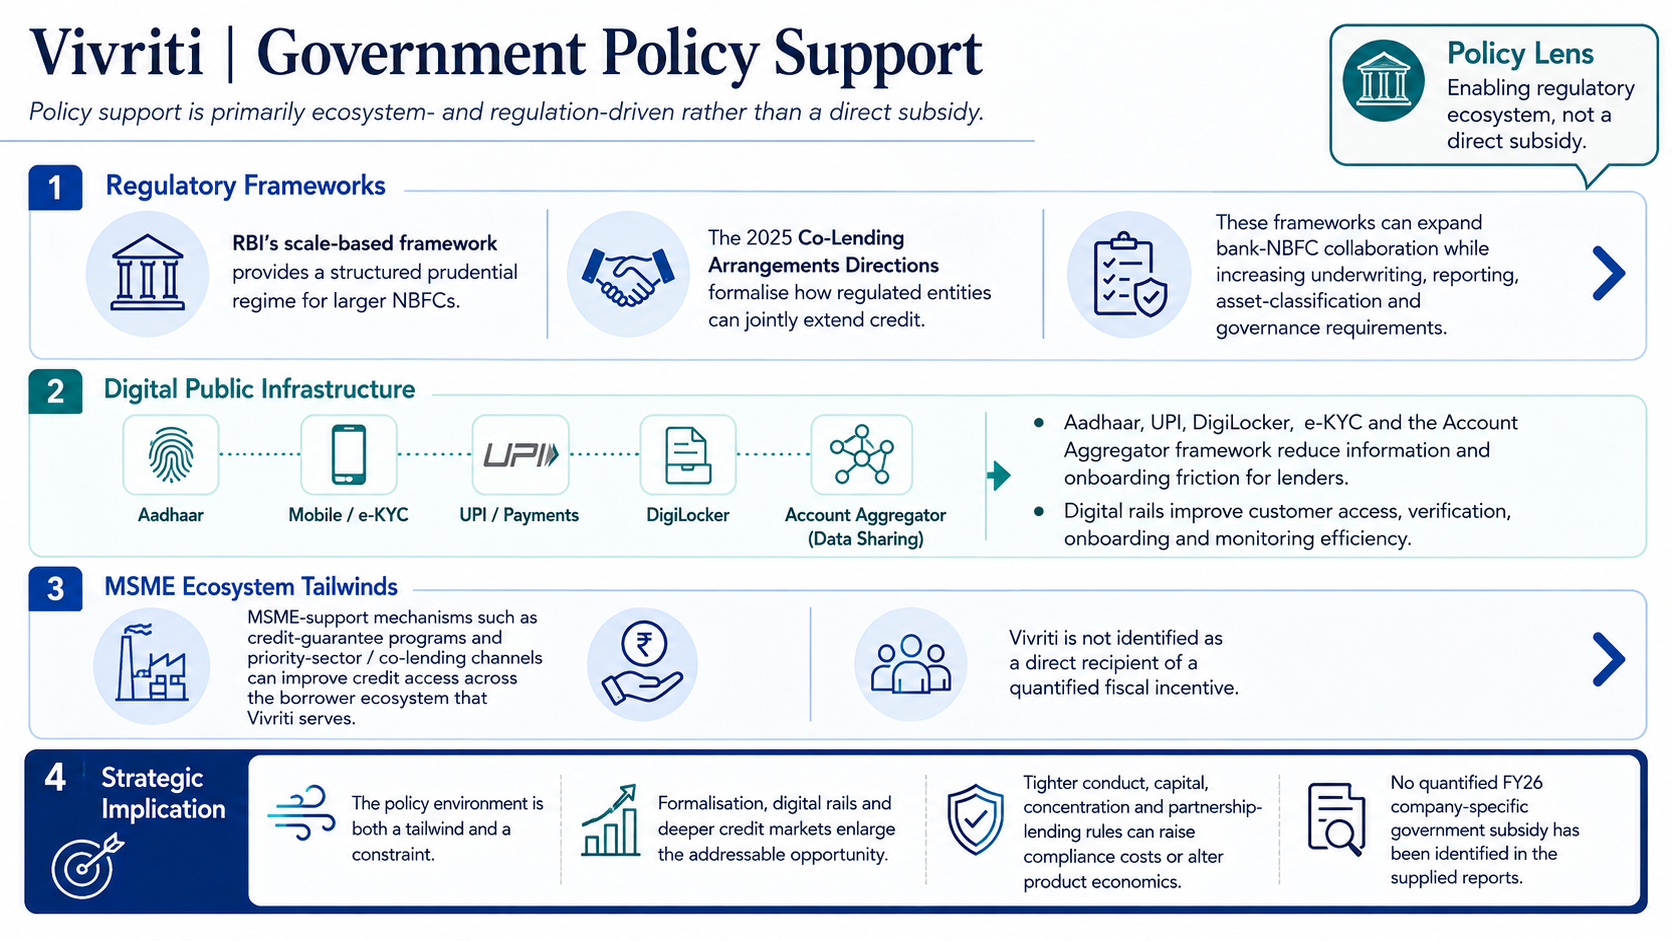
Policy support for the sector is primarily ecosystem- and regulation-driven rather than a direct subsidy to Vivriti
RBI's scalebased framework provides a structured prudential regime for larger NBFCs, while the 2025 Co-Lending Arrangements Directions formalise how regulated entities can jointly extend credit
These frameworks can expand bank-NBFC collaboration while increasing requirements around underwriting, reporting, asset classification and governance. India's digital public infrastructure - Aadhaar, UPI, DigiLocker, e-KYC and the Account Aggregator framework - reduces information and onboarding friction for lenders
MSME-support mechanisms such as credit-guarantee programs and prioritysector / co-lending channels can improve credit access across the borrower ecosystem that Vivriti serves, even when Vivriti itself is not the direct recipient of a fiscal incentive
- Overview
- Business
- Financial Highlights
- Industry Overview
- Documentation
Get the Preqt App and keep in touch around the clock!
 Monitor your investments in real-time.
- Receive tailored deal suggestions.
- Get real-time updates and alerts.
