

Zepto Limited
Speed meets convenienceDelivering everyday faster
IPO Review and Rating
Speculative
DRHP ApprovedOverall Recommendation
Revenue increased from INR 4,454.5 Cr in FY24 to INR 22,623.6 Cr in FY26, representing a 125.4% 2-year CAGR, while FY26 adjusted EBITDA and PAT remained negative at INR (5,041.6) Cr and INR (5,905.2) Cr, with margins of (20.3)% and (26.1)%, respectively. Conventional D/E was 0.0x, ROE was approximately (81.0)%, and FY26 OCF remained negative at INR (3,462.4) Cr. The quick-commerce market is projected to grow at approximately 39.6%-49.1% CAGR, while Zepto held approximately 35.2% of Q4 FY26 orders. Management metrics include 4.5+ years promoter experience, 33.3% board independence, 0.0% promoter pledge and approximately 0.06% RPT/revenue. At the current valuation, P/E and EV/EBITDA are not meaningful because earnings and EBITDA remain negative, P/B stands at 6.8x, P/S at 1.8x, and the unlisted share-price reference declined approximately 25.6% over 30 days.
PARAMETER
WEIGHT
SCORE
KEY FACTORS
Financial Performance
25.0%
2.4/5
Revenue recorded a 125.4% 2-year CAGR and 103.6% FY26 growth. Adjusted EBITDA margin remained negative at (20.3)%, PAT margin stood at (26.1)%, D/E was 0.0x.
Show more
Detailed Analysis
Revenue increased from INR 4,454.5 Cr in FY24 to INR 11,109.9 Cr in FY25 and INR 22,623.6 Cr in FY26, representing a 2-year CAGR of 125.4%. FY26 revenue growth was 103.6% YoY
Adjusted EBITDA stood at INR (1,124.6) Cr in FY24, INR (4,521.7) Cr in FY25 and INR (5,041.6) Cr in FY26; FY26 adjusted EBITDA margin improved to (20.3)% from (35.6)% in FY25
PAT loss increased from INR (1,214.8) Cr in FY24 to INR (4,699.7) Cr in FY25 and INR (5,905.2) Cr in FY26; FY26 PAT margin stood at (26.1)%
Conventional borrowings were NIL in FY26 against total equity of INR 5,997.9 Cr, resulting in conventional D/E of 0.0x; lease liabilities stood at INR 2,710.1 Cr
FY26 loss of INR (5,905.2) Cr against average FY25-FY26 equity of approximately INR 7,292.0 Cr resulted in an ROE of approximately (81.0)%
Operating cash flow remained negative at INR (4,624.8) Cr in FY25 and INR (3,462.4) Cr in FY26, although the cash outflow improved by approximately 25.1% YoY
Industry
25.0%
4.1/5
The quick-commerce market is projected to grow at approximately 39.6%-49.1% CAGR through CY2030 and remains in the Growth stage.
Show more
Detailed Analysis
India's quick-commerce market was approximately INR 0.96 Tn in CY2025 and is projected to reach INR 5.1-7.1 Tn by CY2030, implying an approximate CAGR range of 39.6%-49.1%
Quick-commerce GMV and order volumes increased by approximately 95.0% and 81.0%, respectively, between CY2022 and CY2025, supporting classification in the Growth stage
Q4 FY26 order share among the three scaled platforms was approximately 45.9% Blinkit, 35.2% Zepto and 18.9% Instamart, resulting in an estimated HHI of approximately 3,703
The sector is subject to food-safety, labour, municipal and e-commerce regulations; Maharashtra FDA inspected 86 establishments, issued 60 improvement notices and suspended permits of 12 warehouses, including five Zepto-linked warehouses, in August 2026
Management
25.0%
3.2/5
Promoter operating experience stands at 4.5+ years, independent directors represent 33.3% of the Board, promoter pledge is 0.0%.
Show more
Detailed Analysis
Aadit Palicha and Kaivalya Vohra each have over 4.5 years of quick-commerce experience and have been associated with Zepto since incorporation
The Board comprises 6 directors, including 2 Independent Directors, resulting in independent representation of 33.3%
0.0% promoter pledge was disclosed; no material civil or criminal litigation was reported against the Company, while 2 promoters received ED summons in April 2026 in relation to FEMA proceedings
Valuation Metrics
25.0%
1.3/5
P/E is negative at approximately (7.1)x, EV/EBITDA is not meaningful due to INR (5,041.6) Cr adjusted EBITDA.
Show more
Detailed Analysis
The Company is valued at a displayed P/E of (7.1)x; market capitalisation of INR 40,960.4 Cr against FY26 loss of INR (5,905.2) Cr implies approximately (6.9)x, making P/E economically not meaningful due to negative earnings
Adjusted enterprise value is approximately INR 38,900.1 Cr against FY26 adjusted EBITDA of INR (5,041.6) Cr, resulting in a mechanically negative (7.7)x EV/EBITDA
The Company is valued at 6.8x P/B, based on market capitalisation of INR 40,960.4 Cr against FY26 total equity of approximately INR 5,997.9 Cr
TOTAL
100%
2.8/5
Weighted Composite Score
Per Share Price
₹33.5
As of 14 Oct 2026
Lot Size
100.0 Shares
Minimum Investment
₹3,350.0 / 100 shares
Market Cap. (₹ Cr)
Revenue FY’26
PAT FY’26
P/E Multiple
Face Value
₹ 5.0Lot Size
100.0 sharesPAT FY’26
₹ -5,905.2 CrPAT Margin (%)
-26.1 %P/E Multiple
-7.1xCAGR Growth 2Y
125.4 %ROE (FY’26)
-81.0 %ROCE (FY’26)
-68.8 %Price to Book Value ratio
6.8xDebt/Equity (FY’26)
0.0xMerchant banker appointed
✅ YesAxis Capital Limited, Morgan Stanley India Company Private Limited, Goldman Sachs (India) Securities Private Limited, HSBC Securities & Capital Market
Company Website
www.zepto.comDisclaimer: Unlisted shares are unregulated & illiquid. This is NOT investment advice. Please do your own due diligence before investing.
Minimum Investment
₹3,350.0 / 100 sharesShares Lot 100 X 1
Investment amount
₹3,350.0
Overview
Business
Services
Business Model
Geographical Presence
Sales Channel
Financial Highlights
Income Statement
Revenue growth with EBITDA and PAT margins
| Financial Metric | FY 2024 | FY 2025 | FY 2026 |
|---|---|---|---|
| Revenue (₹ Cr) | 4,454.5 | 11,109.9 | 22,623.6 |
| Growth (%) | 120.0% | 149.4% | 103.6% |
| EBITDA (₹ Cr) | -1,029.2 | -4,153.7 | -4,746.1 |
| EBITDA Margin (%) | -23.1% | -37.4% | -21.0% |
| PAT (₹ Cr) | -1,214.8 | -4,699.7 | -5,905.2 |
| PAT Margin (%) | -27.3% | -42.3% | -26.1% |
OBSERVATIONS & INSIGHTS
Revenue increased approximately 5.1x from INR 4,454.5 Cr in FY24 to INR 22,623.6 Cr in FY26, representing a 125.4% CAGR across the three reported years; FY26 revenue growth remained very high at 103.6%
The EBITDA loss widened in absolute terms from INR -1,029.2 Cr in FY24 to INR -4,746.1 Cr in FY26, but EBITDA margin recovered materially to -21.0% in FY26 from -37.4% in FY25, indicating improving cost absorption from the FY25 trough
PAT loss widened to INR -5,905.2 Cr in FY26; however, PAT margin improved to -26.1% from -42.3% in FY25. Profitability remains the central financial monitorable despite rapid scale
Advertisement revenue increased from INR 49.2 Cr in FY24 to INR 1,635.7 Cr in FY26. Adjusted EBITDA per order also improved from INR -136.2 in FY25 to INR -78.8 in FY26, providing evidence of improving unit economics even though absolute EBITDA remains negative
Balance Sheet
| Financial Metric | FY 2024 | FY 2025 | FY 2026 |
|---|---|---|---|
| EQUITY & LIABILITIES | ₹ 2,898.2 Cr | ₹ 13,800.1 Cr | ₹ 13,510.1 Cr |
| Net Worth | ₹ 1,717.2 Cr | ₹ 8,586.1 Cr | ₹ 5,997.9 Cr |
| Share Capital | ₹ 0.0 Cr | ₹ 1,258.2 Cr | ₹ 1,275.3 Cr |
| Reserves & Surplus | ₹ 1,717.2 Cr | ₹ 7,327.9 Cr | ₹ 4,722.6 Cr |
| Total Liabilities | ₹ 1,181.0 Cr | ₹ 5,214.0 Cr | ₹ 7,512.2 Cr |
| Current Liabilities | ₹ 834.6 Cr | ₹ 3,347.3 Cr | ₹ 5,307.7 Cr |
| Borrowings | ₹ 106.9 Cr | ₹ 0.0 Cr | ₹ 0.0 Cr |
| Trade Payables | ₹ 581.5 Cr | ₹ 2,326.8 Cr | ₹ 3,724.8 Cr |
| Other Current Liabilities | ₹ 146.2 Cr | ₹ 1,020.5 Cr | ₹ 1,582.9 Cr |
| Non-Current Liabilities | ₹ 346.4 Cr | ₹ 1,866.7 Cr | ₹ 2,204.5 Cr |
| Borrowings | ₹ 64.7 Cr | ₹ 0.0 Cr | ₹ 0.0 Cr |
| Other Non-Current Liabilities | ₹ 281.7 Cr | ₹ 1,866.7 Cr | ₹ 2,204.5 Cr |
| ASSETS | ₹ 2,898.2 Cr | ₹ 13,800.1 Cr | ₹ 13,510.0 Cr |
| Current Assets | ₹ 2,363.9 Cr | ₹ 10,124.9 Cr | ₹ 9,638.3 Cr |
| Trade Receivables | ₹ 323.7 Cr | ₹ 1,790.8 Cr | ₹ 2,423.5 Cr |
| Inventory | ₹ 126.5 Cr | ₹ 610.4 Cr | ₹ 897.0 Cr |
| Cash & Cash Equivalents | ₹ 1,659.7 Cr | ₹ 565.8 Cr | ₹ 973.1 Cr |
| Other Current Assets | ₹ 254.0 Cr | ₹ 7,157.9 Cr | ₹ 5,344.7 Cr |
| Non-Current Assets | ₹ 534.3 Cr | ₹ 3,675.2 Cr | ₹ 3,871.7 Cr |
| Fixed Assets | ₹ 468.0 Cr | ₹ 3,005.5 Cr | ₹ 3,563.4 Cr |
| Other Non-Current Assets | ₹ 66.3 Cr | ₹ 669.7 Cr | ₹ 308.3 Cr |
OBSERVATIONS & INSIGHTS
The balance sheet expanded sharply between FY24 and FY25 following the India holding-company restructuring, preference-share funding and treasury investments; total assets then moderated from INR 13,800.1 Cr in FY25 to INR 13,510.1 Cr in FY26
Total consolidated equity declined from INR 8,586.1 Cr in FY25 to INR 5,997.9 Cr in FY26 as the FY26 loss absorbed a material portion of the capital base
Conventional financial borrowings were nil in FY25 and FY26, but lease liabilities were substantial at approximately INR 2,710.1 Cr in FY26 because the dark-store, warehouse and office network is predominantly leased or licensed
Trade receivables increased from INR 323.7 Cr in FY24 to INR 2,423.5 Cr in FY26, while trade payables increased from INR 581.5 Cr to INR 3,724.8 Cr over the same period as operating scale expanded
Inventory increased to INR 897.0 Cr in FY26, although inventory days improved versus FY25, indicating faster throughput relative to purchase volumes
Fixed Assets increased from INR 468.0 Cr in FY24 to INR 3,563.4 Cr in FY26, driven substantially by the expansion of leased dark stores, right-of-use assets and technology/intangible assets
Liquidity remains sizeable but less comfortable than FY25: current assets were INR 9,638.4 Cr against current liabilities of INR 5,307.7 Cr in FY26, translating to a current ratio of 1.8x
Cash Flow
| Financial Metric | FY 2024 | FY 2025 | FY 2026 |
|---|---|---|---|
CFO (₹ Cr) Cash generated from core business operations. | -1,097.9 Cr | -4,624.8 Cr | -3,462.4 Cr |
CFI (₹ Cr) Cash used for investments and long-term assets. | +348.9 Cr | -7,361.8 Cr | +1,807.9 Cr |
CFF (₹ Cr) Cash flow related to funding and borrowings. | +1,860.4 Cr | +10,784.6 Cr | +1,895.2 Cr |
Working Capital
| Efficiency Metric | FY 2023 | FY 2024 | FY 2025 |
|---|---|---|---|
Debtor Days Average number of days taken to collect customer payments. | - | - | - |
Creditor Days Average time taken to pay suppliers and vendors. | - | - | - |
Inventory Days Average number of days inventory remains unsold. | - | - | - |
CCC (Cash Conversion Cycle) (Debtor Days + Inventory Days - Creditor Days) | - | - | - |
Financial Ratios
Measures the company’s leverage relative to shareholder equity.
OBSERVATIONS & INSIGHTS
ROE remained deeply negative at -81.0% in FY26, while ROCE deteriorated to - 68.8%, showing that the current scale has not yet translated into positive returns on capital
Debt/equity reduced to 0.0x in FY25 and FY26 because conventional financial borrowings were nil. However, current and non-current lease liabilities together stood at approximately INR 2,710.1 Cr in FY26 and remain an important fixed-commitment monitorable
The current ratio declined from 3.0x in FY25 to 1.8x in FY26 as current liabilities, particularly trade payables and lease/other financial liabilities, scaled faster than current assets
Interest coverage remains negative because EBITDA is negative, even though conventional borrowing-related interest is limited. Finance costs are primarily influenced by lease liabilities and the operating footprint
ROA improved to -43.2% in FY26 from -56.3% in FY25 but remains materially negative, consistent with continued losses despite a large asset and liquidity base
Industry Overview
Industry Drivers
Expansion of Technological Capabilities
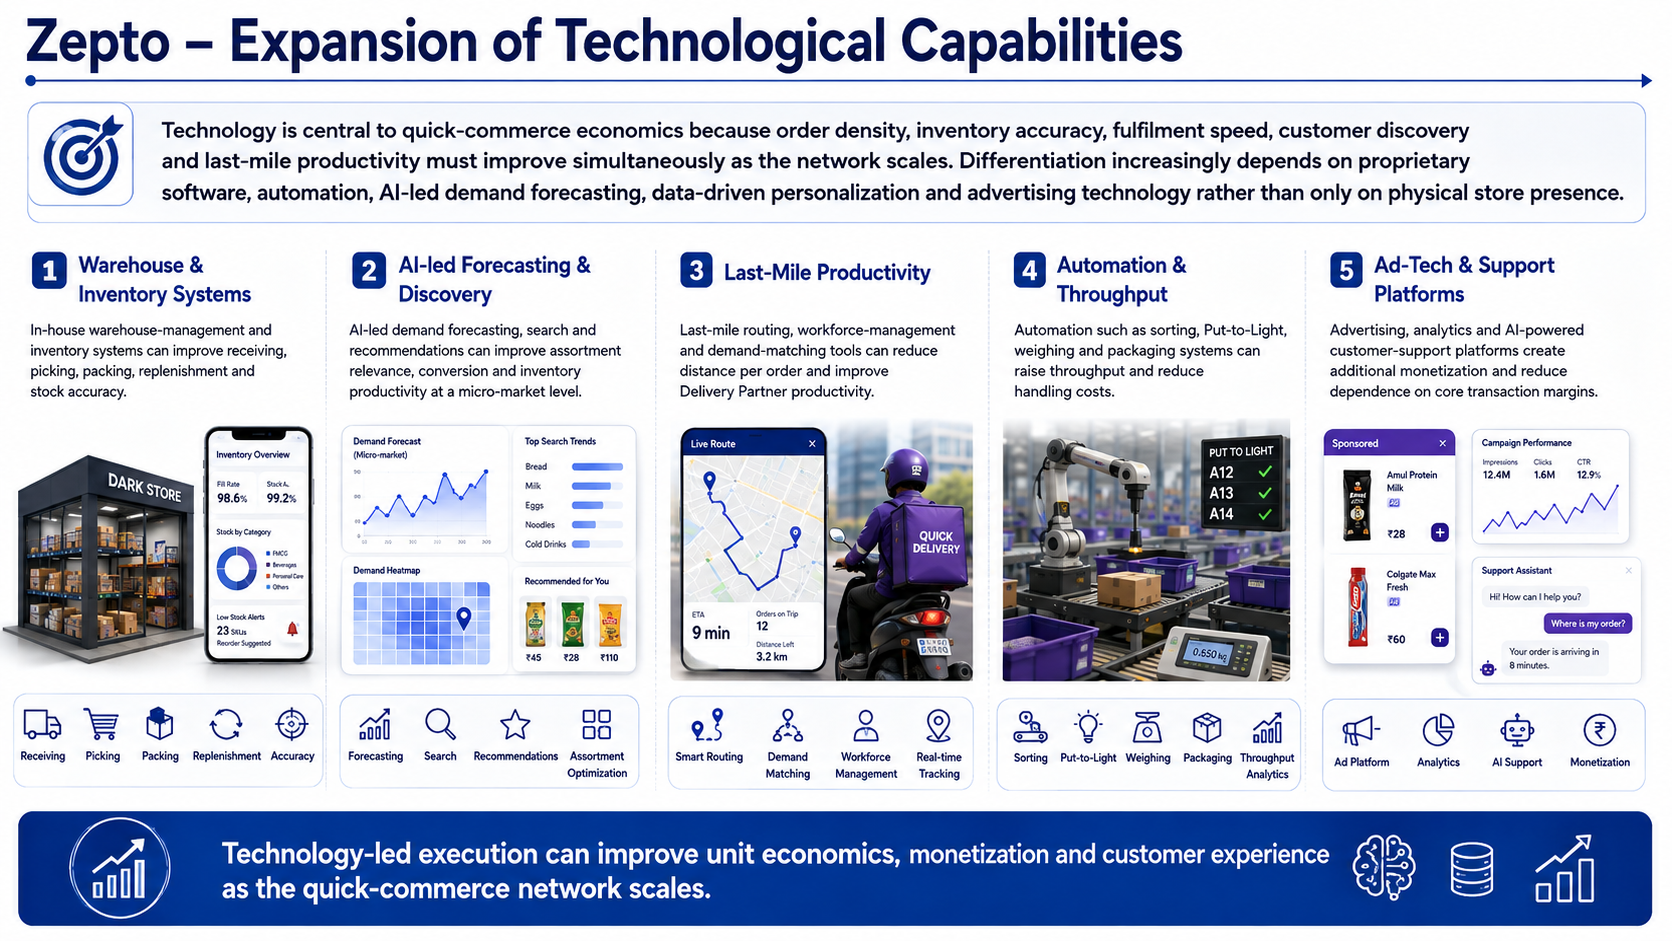
In-house warehouse-management and inventory systems can improve receiving, picking, packing, replenishment and stock accuracy
AI-led demand forecasting, search and recommendations can improve assortment relevance, conversion and inventory productivity at a micro-market level
Last-mile routing, workforce-management and demand-matching tools can reduce distance per order and improve delivery partner productivity
Automation such as sorting, Put-to-Light, weighing and packaging systems can raise throughput and reduce handling costs
Advertising, analytics and AI-powered customer-support platforms create additional monetization and reduce dependence on core transaction margins
Capacity Expansion
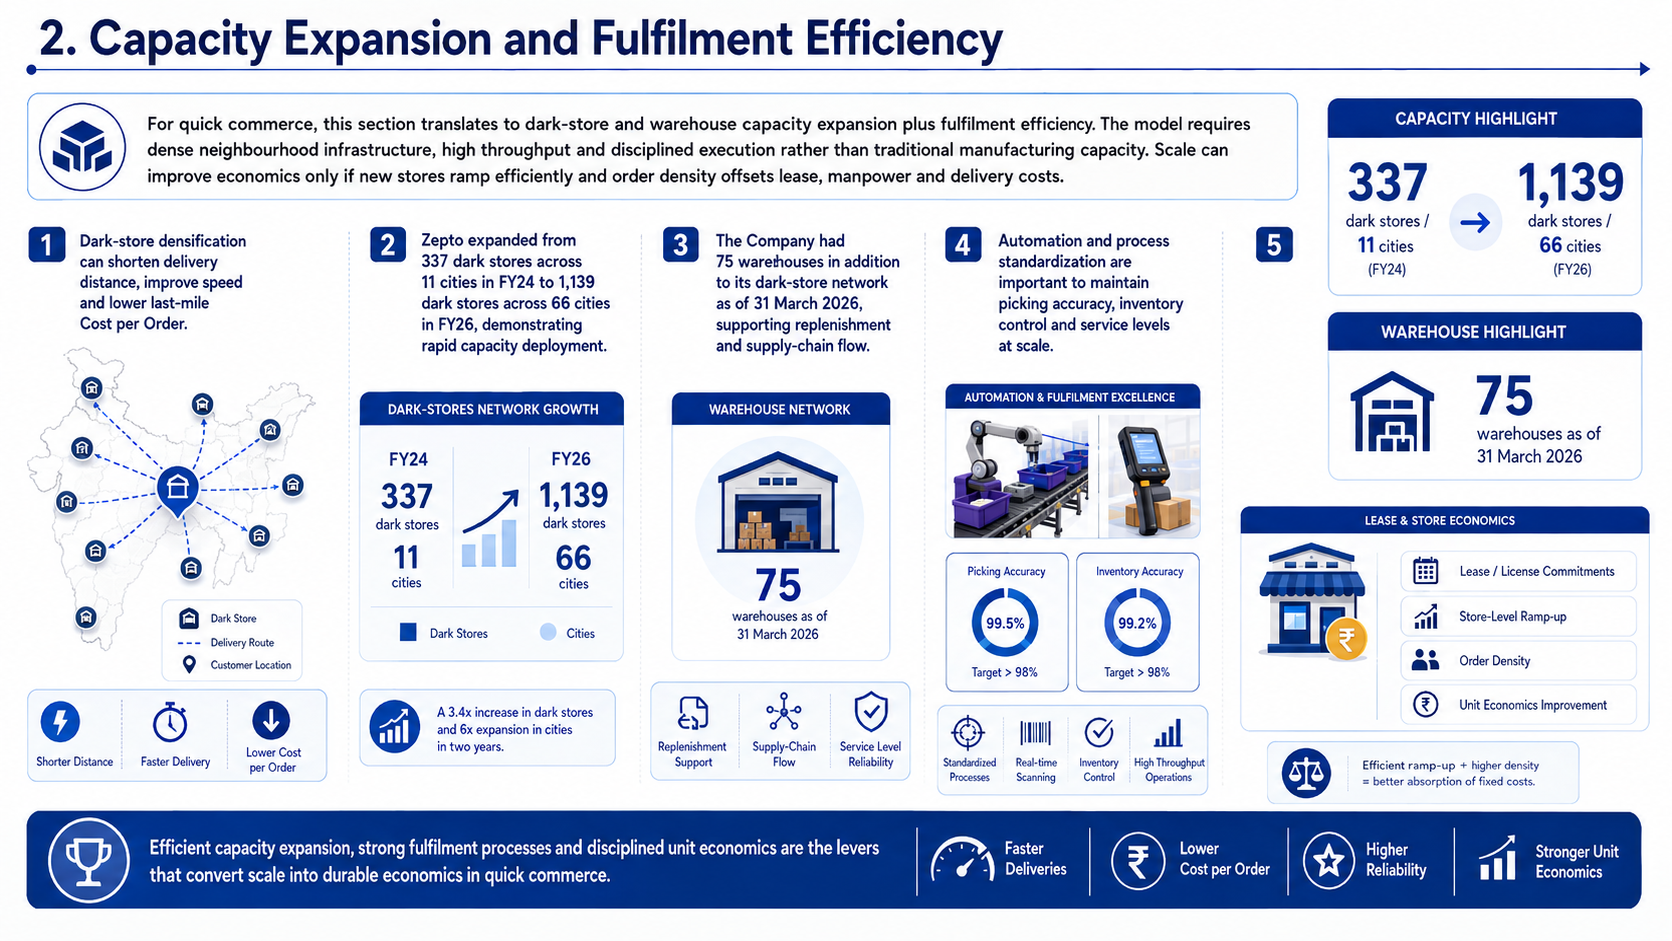
Dark-store densification can shorten delivery distance, improve speed and lower last-mile cost per order
Zepto expanded from 337 dark stores across 11 cities in FY24 to 1,139 dark stores across 66 cities in FY26, demonstrating rapid capacity deployment
The Company had 75 warehouses in addition to its dark-store network as of 31 March 2026, supporting replenishment and supply-chain flow
Automation and process standardization are important to maintain picking accuracy, inventory control and service levels at scale
Lease economics and store-level ramp-up remain critical because the operating network is predominantly leased/licensed and therefore carries recurring fixed commitments
Global Market Penetration
Quick-commerce penetration remains low relative to total retail spend, leaving substantial headroom in large Indian cities
The Company has already expanded to 66 cities, but densification within existing markets can be as important as entering additional cities
The top urban markets benefit from dense catchments, higher incomes and convenience-oriented consumption, which can support better order economics
Non-grocery categories are expected to increase their share of quick-commerce GMV, broadening the addressable wallet beyond grocery and essentials
No international operating presence is currently disclosed; any future overseas expansion would introduce additional logistics, regulatory and execution complexity
Government Policy Support
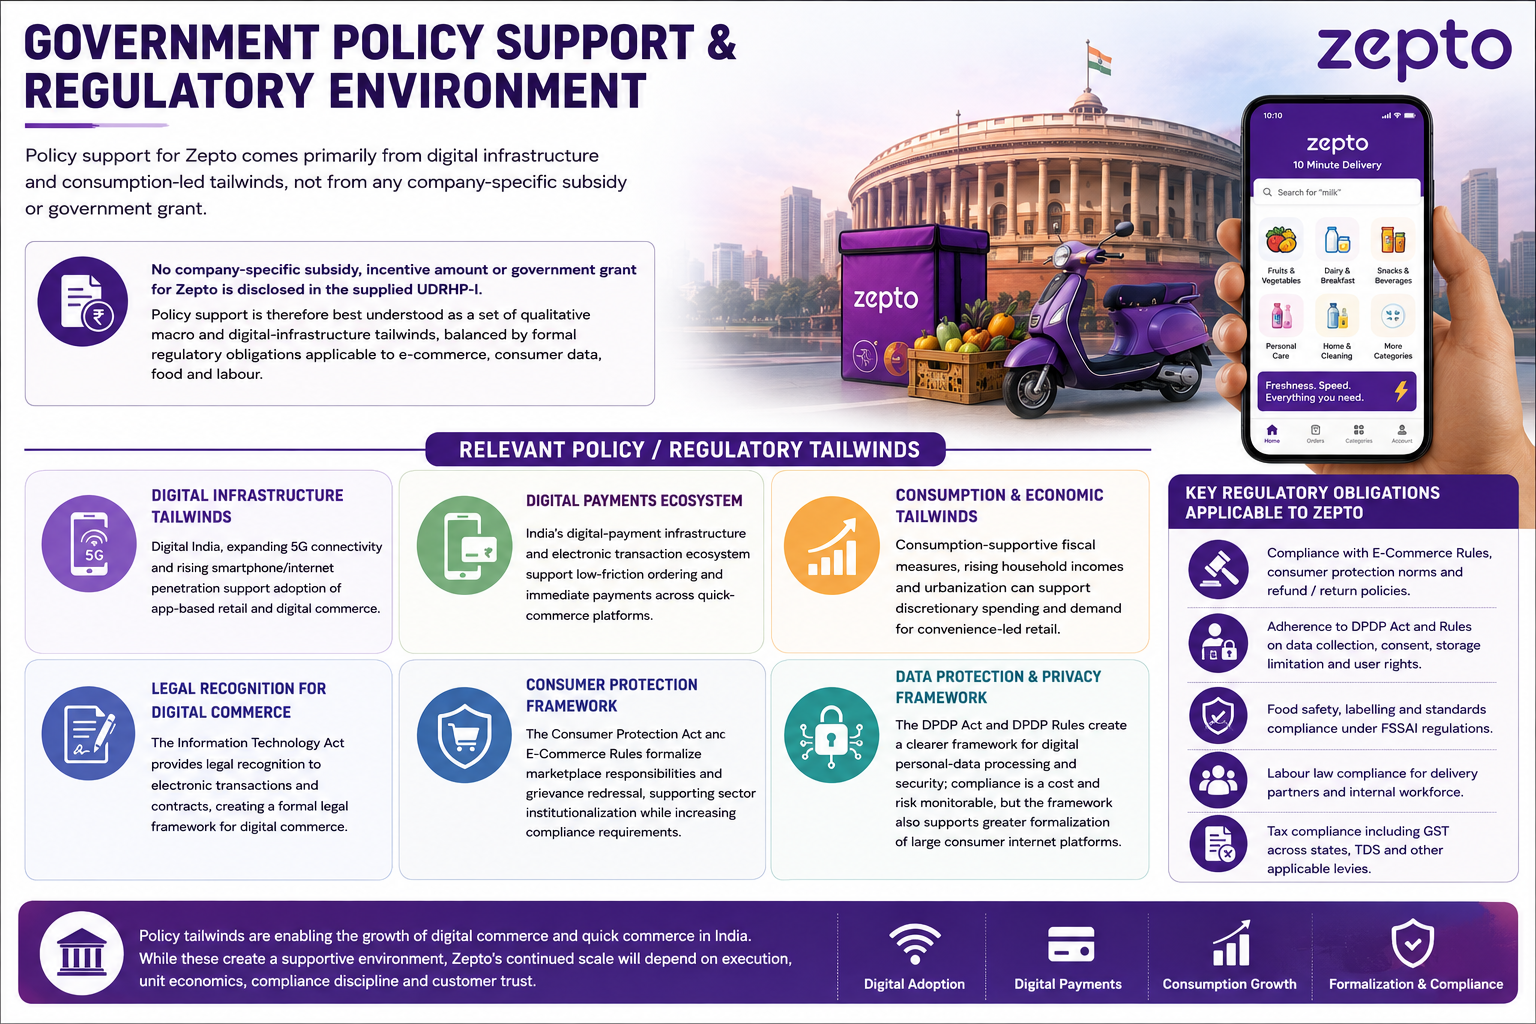
Digital India, expanding 5G connectivity and rising smartphone/internet penetration support adoption of app-based retail and digital commerce
India's digital-payment infrastructure and electronic transaction ecosystem support low-friction ordering and immediate payments across quick-commerce platforms
Consumption-supportive fiscal measures, rising household incomes and urbanization can support discretionary spending and demand for convenience-led retail
The Information Technology Act provides legal recognition to electronic transactions and contracts, creating a formal legal framework for digital commerce
The Consumer Protection Act and E-Commerce rules formalize marketplace responsibilities and grievance redressal, supporting sector institutionalization while increasing compliance requirements
The DPDP Act and DPDP rules create a clearer framework for digital personal-data processing and security; compliance is a cost and risk monitorable, but the framework also supports greater formalization of large consumer internet platforms
Documentation
Documents & Filings
No documents available
- Overview
- Business
- Financial Highlights
- Industry Overview
- Documentation
Get the Preqt App and keep in touch around the clock!
 Monitor your investments in real-time.
- Receive tailored deal suggestions.
- Get real-time updates and alerts.
