

Zetwerk Manufacturing Business
Building Global Manufacturing
IPO Summary (PreQT)
The Company is a technology-enabled manufacturing and procurement platform combining third-party production capacity with selective owned manufacturing assets. It supplies Energy Products, Precision Products and Capital Goods, and separately operates an Ecosystem raw-materials business.
Fresh issue up to INR 2,830.0 Cr plus OFS of up to 14,45,25,036 existing shares; price band INR 143–151 per share per IPO snapshot.
FY26 continuing-operations revenue rose 40.4% to INR 15,913.3 Cr; adjusted EBITDA increased to INR 421.3 Cr, but total restated loss widened to INR 1,606.2 Cr. Operating cash flow remained negative at INR 681.5 Cr.
IPO Review Rating
Speculative
MainboardPowering Industrial Growth Through Technology-Enabled Manufacturing and Supply Chains
Zetwerk is an attractive business operating in an attractive industry, but that does not automatically make it an attractive IPO at any valuation. Revenue growth, order-book expansion, geographic reach, experienced management and the manufacturing-platform opportunity are genuine positives.
The central problem is financial quality versus valuation. FY26 RoNW is -21.1%, operating cash flow has been negative for three consecutive years, consolidated adjusted EBITDA margin is only 2.7%, and the company remains loss-making. Yet the cap price implies a market capitalisation of roughly INR 25,583.2 Cr and an illustrative EV/adjusted EBITDA multiple around 58x.
The fresh issue and debt repayment are positive, and a ~15% GMP provides some listing sentiment, but these do not compensate sufficiently for the earnings, cash-flow and valuation weaknesses.
PARAMETER
WEIGHT
SCORE
KEY FACTORS
Financial Performance
40.0%
2.0/5
Zetwerk has delivered a sharp recovery in revenue and EBITDA, but financial quality remains weak because consolidated margins are thin, the company remains loss-making, RoNW is negative and operating cash flow has remained consistently negative
Show more
Detailed Analysis
Revenue grew at a 13.4% CAGR between FY24 and FY26, increasing from ₹12,364.4 Cr to ₹15,913.3 Cr. Revenue declined 8.4% in FY25 before rebounding strongly by 40.4% in FY26
EBITDA improved from INR 97.0 Cr in FY24 to INR 421.3 Cr in FY26, but consolidated EBITDA margin remains thin at only 2.7%
Continuing operations remained loss-making, with FY26 loss increasing to approximately INR 964.4 Cr, versus INR 215.1 Cr in FY25
Zetwerk's gross Debt/Equity stood at 0.4x in FY26, increasing to approximately 0.5x as of June 2026. Leverage remains moderate, although debt has increased compared with earlier periods
FY26 RoNW was -21.1%, following -4.8% in FY25 and -21.0% in FY24. Returns to equity holders therefore remain weak
Operating cash flow was negative at INR 681.5 Cr in FY26, following negative INR 386.3 Cr in FY25 and INR 281.5 Cr in FY24
Top 10 customers contributed 35.9% of FY26 revenue, up substantially from 22.4% in FY24, indicating rising customer concentration
Industry
15.0%
3.0/5
The industry is a major positive, supported by China+1, localisation, infrastructure, defence, renewable energy and supply-chain outsourcing. Zetwerk addresses a very large and growing market, although competition and execution complexity prevent a maximum industry score
Show more
Detailed Analysis
Indian durable-goods manufacturing procurement is expected to grow at approximately 9.7%–11.5% CAGR between FY26 and FY31, while the addressable manufacturing-platform market also has strong structural growth prospects
Traditional manufacturing is mature, but technology-led manufacturing aggregation and supply-chain orchestration remain relatively early-stage, benefiting from outsourcing and supply-chain diversification
Exposure spans defence, energy, electronics and industrial manufacturing, creating meaningful certification, environmental, safety, import/export and sector-specific compliance requirements
Management
15.0%
3.0/5
Management quality and Board composition are strong, with experienced founders and 50% independent representation. The deductions arise from relatively low promoter ownership, promoter selling in the OFS, historical share pledges and complexity created by numerous subsidiaries and transactions
Show more
Detailed Analysis
Founders Amrit Acharya and Srinath Ramakkrushnan have over 13 and 15 years of relevant experience respectively, supported by experienced functional and independent leadership
Four of eight directors are independent, giving the Board 50.0% independence, including one woman Independent Director
Historical promoter/promoter-group pledges and disclosed litigation create some governance overhang, despite significant promoter pledges being released for the IPO
Related-party sales represented approximately 1.5% of FY26 revenue, while related-party purchases represented around 0.9% of relevant procurement costs, indicating relatively limited operational related-party dependence
Valuation
20.0%
2.0/5
Valuation is the biggest weakness. Zetwerk is being offered at a large market capitalisation despite negative earnings, negative RoNW, thin consolidated EBITDA margins and expensive book-value and EV/EBITDA multiples, leaving limited fundamental valuation comfort
Show more
Detailed Analysis
FY26 EPS is negative at INR -6.7, making P/E non-meaningful. The RHP also states that no listed company operates an adequately similar business model
Zetwerk's implied FY26 EV/Adjusted EBITDA of approximately 58.4x is significantly above the selected peer average of 24.8x, representing a premium of roughly 136%. Even versus the highest-valued selected peer, Kaynes at 40.2x, Zetwerk trades at a sizeable premium
P/B Cap price equals approximately 5.8x June-26 NAV; even illustrative post-fresh-issue book value implies roughly 3.8x, which remains demanding for a loss-making company
FY26 RoNW of -21.1% provides no return-based support for the proposed valuation
Merchant Banker Track Record
10.0%
5.0/5
The seven-member banking syndicate is a clear strength, combining major global and domestic investment banks with substantial Mainboard execution capability. Historical aftermarket performance is broadly positive, although JM Financial, HSBC and Pantomath have comparatively mixed records
Show more
Detailed Analysis
Overall syndicate record is favourable, though performance varies materially between BRLMs
Consistent comparable subscription data is not available from the RHP's BRLM summary tables
Multiple BRLMs have executed large and successful recent Mainboard offerings, although aftermarket results are not uniformly strong
TOTAL
100%
2.6/5
Weighted Composite Score
Issue Price
₹143.0 to ₹151.0
As of 15 Oct 2026
GMP
₹22.0
As of 15 Oct 2026
Estimated Gain / Loss
+14.6%
Lot Size
99.0 Shares
Grey Market Premium (GMPs) are shared for knowledge purpose only. PrEqt doesn’t promote or execute the trades.
| Issue size | |
|---|---|
| Overall | ₹5,012.0 Cr |
| Fresh Issue | ₹2,830.0 Cr |
| Offer for Sale | ₹2,182.0 Cr |
Minimum Investment
₹14,949.0 / 9,801 shares

Merchant Banker
Kotak Mahindra Capital Co.Ltd., Morgan Stanley India, Goldman Sachs India, Avendus Capital, JM Financial, HSBC Securities, Pantomath Capital Advisors
Kotak Mahindra Capital Co.Ltd.
Morgan Stanley India
Goldman Sachs India
Avendus Capital
JM Financial
HSBC Securities
Pantomath Capital Advisors
IPO Document
No Document
Offer Start Date
Offer End Date
Valuation
Revenue (FY'26)
PAT (FY'26)
Issue Size
Face Value
₹ 1.0Offer Price
₹ 151.0Lot Size
99.0 sharesSale Type
Fresh capital cum OFSPAT (FY'26)
₹ -964.4 CrPAT Margin (FY'26)
-6.1 %EBITDA (FY'26)
₹ 421.3 CrCAGR Growth 2Y
13.4 %ROE (FY'26)
-21.1 %Price to Book Value
3.8xDebt/Equity
0.4xCompany Website
www.zetwerk.comExplore new deals
Overview
Fund Allocation
Total: ₹0 CrSource:Company DRHP
Timeline
IPO Open Date
To Be Announced
IPO Close Date
To Be Announced
Tentative Allotment
To Be Announced
Initiation of Refunds
To Be Announced
Credit of Shares to Demat
To Be Announced
Tentative Listing Date
To Be Announced
Business
Business Model
Geographical Presence
Sales Channel
Key Risk Factors
Financial Highlights
Income Statement
Revenue growth with EBITDA and PAT margins
| Financial Metric | FY 2024 | FY 2025 | FY 2026 |
|---|---|---|---|
| Revenue (₹ Cr) | 12,364.4 | 11,331.9 | 15,913.3 |
| Growth (%) | - | -8.4% | 40.4% |
| EBITDA (₹ Cr) | 97.0 | 322.6 | 421.3 |
| EBITDA Margin (%) | 0.8% | 2.8% | 2.6% |
| PAT (₹ Cr) | -917.9 | -370.7 | -1,606.2 |
| PAT Margin (%) | -7.3% | -3.2% | -10.0% |
OBSERVATIONS & INSIGHTS
Revenue: Revenue declined 8.4% from INR 12,364.4 Cr. in FY24 to INR 11,331.9 Cr. in FY25, primarily due to exiting apparel, textile and other non-core trading activities, which reduced Ecosystem revenue by INR 1,199.8 Cr. In FY26, revenue grew 40.4% to INR 15,913.3 Cr., driven by a 50.0% increase in Manufacturing revenue following the scale-up of Energy Products and a 28.6% increase in Ecosystem revenue due to higher commodity transaction volumes
EBITDA: Increased significantly from INR 97.0 Cr. in FY24 to INR 322.6 Cr. in FY25, primarily due to improved gross margins from 7.7% to 12.1%, supported by lower cost of goods sold following the exit from non-core trading activities. In FY26, EBITDA further increased 30.6% to INR 421.3 Cr., driven by the scale-up of Energy Products manufacturing and higher Ecosystem business volumes. However, adjusted EBITDA margin declined due to a sharp increase in freight, subcontracting and employee expenses, which grew faster than operating profitability
PAT: Consolidated losses narrowed from INR 917.9 Cr. in FY24 to INR 370.7 Cr. in FY25, mainly due to improved gross profitability, lower joint venture losses, reduced exceptional charges and lower tax expenses. However, losses widened sharply to INR 1,606.2 Cr. in FY26, primarily due to INR 796.4 Cr. of exceptional fair-value adjustments, INR 453.0 Cr. of impairment in the discontinued Civil Infrastructure Works business, higher finance costs and increased tax expenses. These charges outweighed improvements in underlying operating profitability
Balance Sheet
| Financial Metric | FY 2024 | FY 2025 | FY 2026 |
|---|---|---|---|
| Net Worth | ₹ 4,062.5 Cr | ₹ 4,453.8 Cr | ₹ 4,813.7 Cr |
| Total Assets | ₹ 10,330.9 Cr | ₹ 10,355.4 Cr | ₹ 13,384.6 Cr |
| Total Borrowing | ₹ 1,232.1 Cr | ₹ 1,746.6 Cr | ₹ 1,936.2 Cr |
| Reserves & Surplus | ₹ 4,025.0 Cr | ₹ 4,355.2 Cr | ₹ -16.0 Cr |
OBSERVATIONS & INSIGHTS
Total equity increased 18.5% from INR 4,062.5 Cr in FY24 to INR 4,813.7 Cr in FY26. The increase was supported by equity and preference-share capital movements rather than accumulated profits, as the company continued reporting substantial losses
Total Assets Increased 29.3% YoY to INR 13,384.6 Cr in FY26, driven by higher goodwill, trade receivables, capital expenditure and INR 1,387.7 Cr of assets classified as held for sale. The expansion includes acquisition-related and reclassification effects
Total Borrowings Rose 57.1% from INR 1,232.1 Cr in FY24 to INR 1,936.2 Cr in FY26, reflecting greater debt funding requirements. Higher borrowings contributed to increasing finance costs, creating additional pressure on profitability and cash flows
Other equity declined sharply from INR 4,355.2 Cr in FY25 to negative INR 16.0 Cr in FY26, primarily reflecting the INR 4,522.6 Cr bonus CCPS issuance and accumulated losses. This is substantially an equity-component movement and should not be interpreted as an equivalent cash outflow
Cash Flow
| Financial Metric | FY 2024 | FY 2025 | FY 2026 |
|---|---|---|---|
CFO (₹ Cr) Cash generated from core business operations. | -281.5 Cr | -386.3 Cr | -681.5 Cr |
CFI (₹ Cr) Cash used for investments and long-term assets. | -621.9 Cr | -147.9 Cr | -394.1 Cr |
CFF (₹ Cr) Cash flow related to funding and borrowings. | +763.2 Cr | +150.6 Cr | +1,789.3 Cr |
Working Capital
| Efficiency Metric | FY 2023 | FY 2024 | FY 2025 |
|---|---|---|---|
Debtor Days Average number of days taken to collect customer payments. | - | - | - |
Creditor Days Average time taken to pay suppliers and vendors. | - | - | - |
Inventory Days Average number of days inventory remains unsold. | - | - | - |
CCC (Cash Conversion Cycle) (Debtor Days + Inventory Days - Creditor Days) | - | - | - |
Financial Ratios
Measures the company’s leverage relative to shareholder equity.
OBSERVATIONS & INSIGHTS
ROE improved from -22.6% in FY24 to -8.3% in FY25 as consolidated losses narrowed, before deteriorating to -35.1% in FY26. The decline was driven by exceptional fair-value adjustments and impairment-related losses, including discontinued operations
Debt-to-Equity Increased from 0.3x in FY24 to 0.4x in FY26 as total borrowings rose from INR 1,232.1 Cr to INR 1,936.2 Cr. This indicates increasing reliance on borrowings despite expansion in the equity base
Interest Coverage Improved from -1.5x in FY24 to 0.4x in FY25 but declined to -1.5x in FY26. Exceptional charges significantly affected reported EBIT, while finance costs increased to INR 366.2 Cr, indicating insufficient reported earnings to cover interest obligations
Current Ratio Declined from 1.4x in FY24 to 1.3x in FY26 as current liabilities increased faster than current assets. Higher short-term obligations, including borrowings and liabilities associated with assets held for sale, affected the reported liquidity position
Return on Assets Improved from -8.9% in FY24 to -3.6% in FY25 before falling to -12.0% in FY26. The deterioration reflects substantially higher consolidated losses despite asset growth, indicating weaker reported returns on the expanded asset base
ROCE improved from -11.1% in FY24 to 2.8% in FY25 but declined to -9.1% in FY26. Exceptional charges and losses from associates and joint ventures weighed on reported operating returns, while capital employed increased
Industry Overview
Industry Drivers
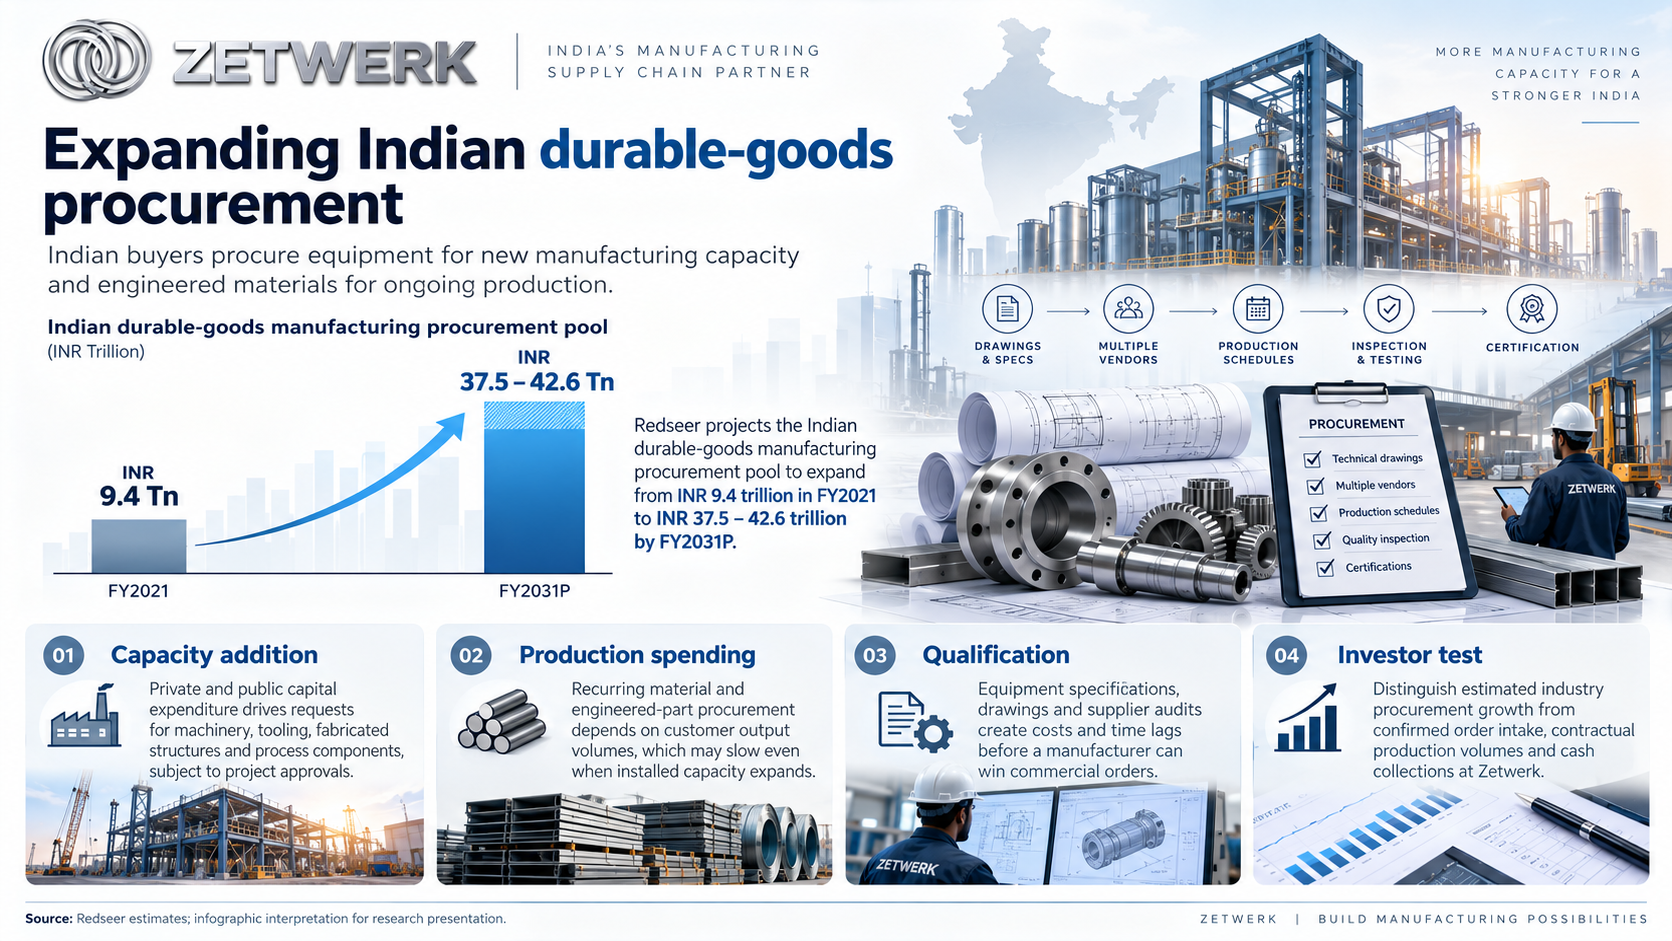
Expanding Indian durable-goods procurement
The most measurable sector tailwind is the expected rise in Indian procurement of durable manufactured goods from INR 17,37,000.0 Cr. in FY26 to INR 37,54,000.0-42,57,000.0 Cr. by FY31P, a 16.7%-19.6% forecast CAGR. The historic pool grew from INR 9,42,000.0 Cr. in FY21, indicating a substantial base effect as well as increasing procurement complexity. Redseer classifies electrical equipment, consumer electronics and energy/power equipment among the high-growth industries with larger procurement bases; aerospace and defence, industrial machinery and semiconductors are among smaller, faster-growing pools. A manufacturing execution platform can address qualified orders within these groups, but only a fraction of the entire estimated industry spend is realistically addressable by any single business.
The key points are:
Growth trajectory: The FY26 procurement base of INR 17,37,000.0 Cr. is forecast to add INR 20,17,000.0- 25,20,000.0 Cr. by FY31P. This incremental industry spending is a scenario estimate, not a committed order pipeline
Capex versus production inputs: The estimated market combines production-equipment capex with material procurement within specified end-use industries. This distinction matters because project-based machinery orders are less recurring than operating-material purchases
Industry composition: Redseer identifies energy/power equipment, electrical equipment and consumer electronics as large high-growth pools, while aerospace/defence and semiconductors expand from smaller bases. Their individual growth rates cannot be substituted for the total-market CAGR
Investment filter: Track awarded purchase orders, execution milestones, repeat buyer activity and realised margin separately from an industry forecast. Higher aggregate procurement does not necessarily produce equivalent growth in Zetwerk's higher-value manufacturing business
Supply-Chain Diversification and Fragmented Supplier Networks
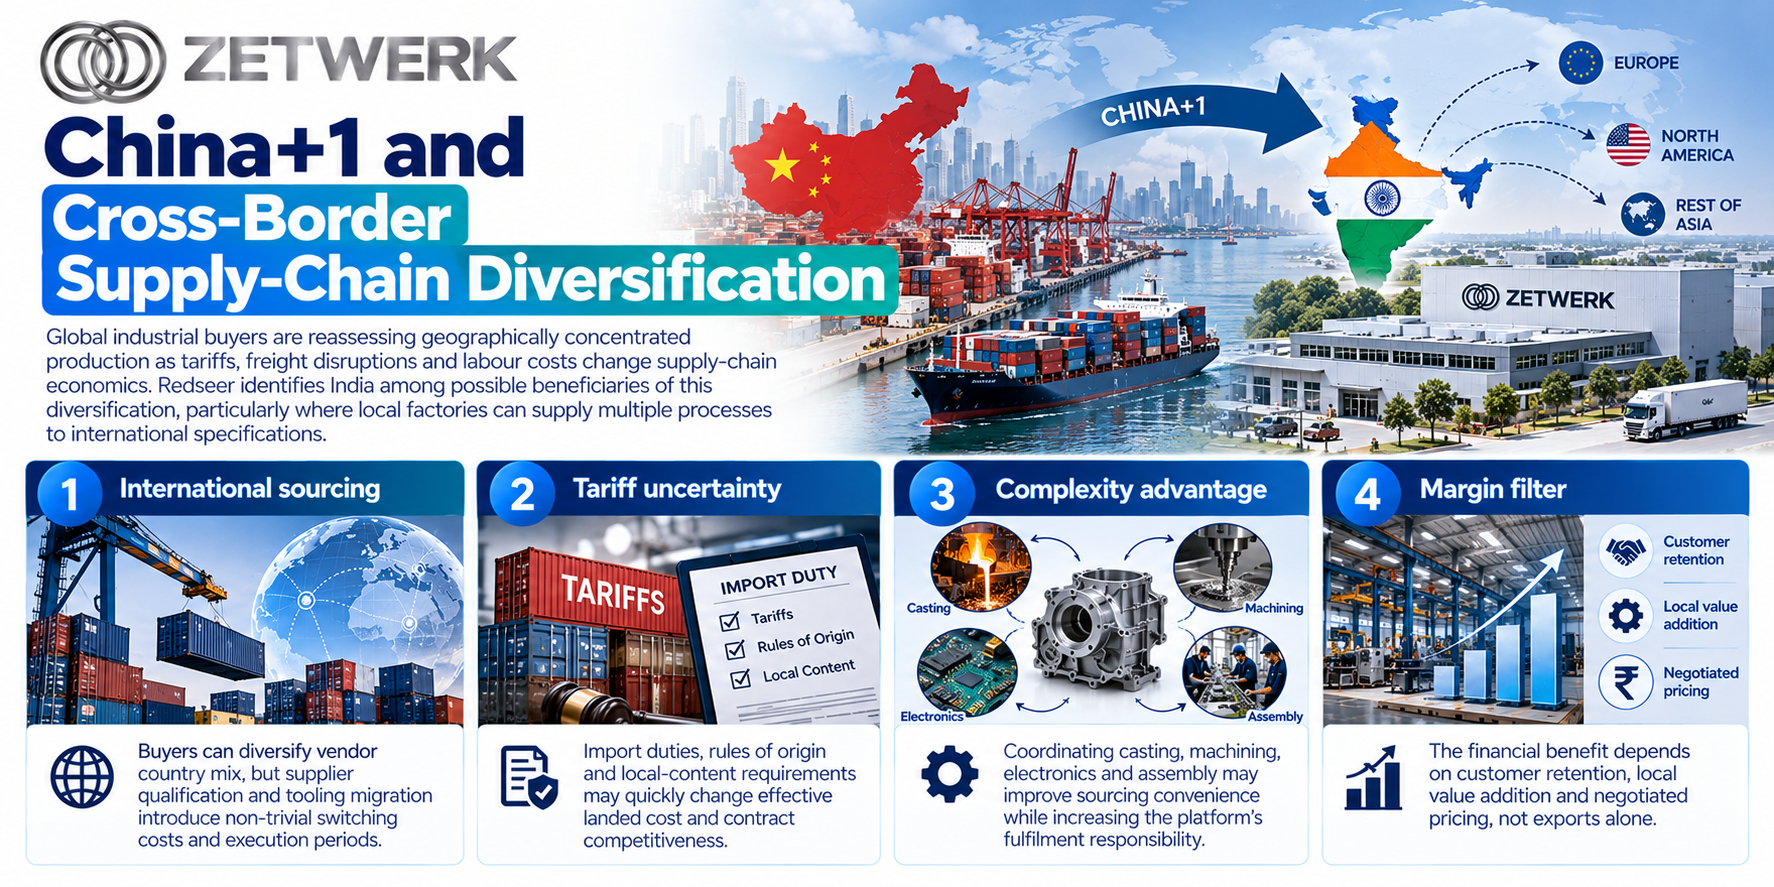
India's production base is growing as overseas buyers diversify sourcing and domestic manufacturers increase local value addition. Redseer reports Indian manufacturing GVA of INR 41,68,000.0 Cr. in CY24 versus INR 26,11,000.0 Cr. in CY14, or approximately 4.8% CAGR; it compares this with global manufacturing GVA growth of about 2.9% over the same period. Equally important, India had approximately 76.1 million registered MSMEs in CY25, about 21.0% of which operated in manufacturing, while manufacturing MSMEs accounted for approximately 35.0% of Indian manufacturing output in FY22. This fragmented supplier population can create a need for engineering coordination, inspection and cross-factory production planning. Nevertheless, neither India's historical GVA growth nor the broader China+1 narrative establishes a quantified transfer of overseas orders to Zetwerk. Supplier qualification, product tolerances, cost competitiveness and tariffs remain decisive.
The key drivers are:
Domestic industrial scale: The increase in manufacturing GVA from INR 26,11,000.0 Cr. to INR 41,68,000.0 Cr. over CY14-CY24 indicates growth in local production capacity; GVA is value added, not procurement expenditure or export orders
Fragmentation opportunity: Roughly 21.0% of 76.1 million registered Indian MSMEs were manufacturing entities in CY25. Coordinating small, specialist vendors can reduce buyer-interface complexity but demands rigorous process audits and supplier financing
US demand comparison: US durable-goods procurement is projected to grow from INR 53,12,000.0 Cr. in FY26 to INR 57,92,000.0-66,97,000.0 Cr. in FY31P. This denotes total US demand, not an assured export opportunity for Indian vendors
Trade and customer qualification: China+1 sourcing benefits require landed-cost competitiveness after tariffs, shipping, local-content obligations and quality testing. No market-share or export conversion percentage is assumed for Zetwerk
Power, Grid Modernisation and Renewable Equipment
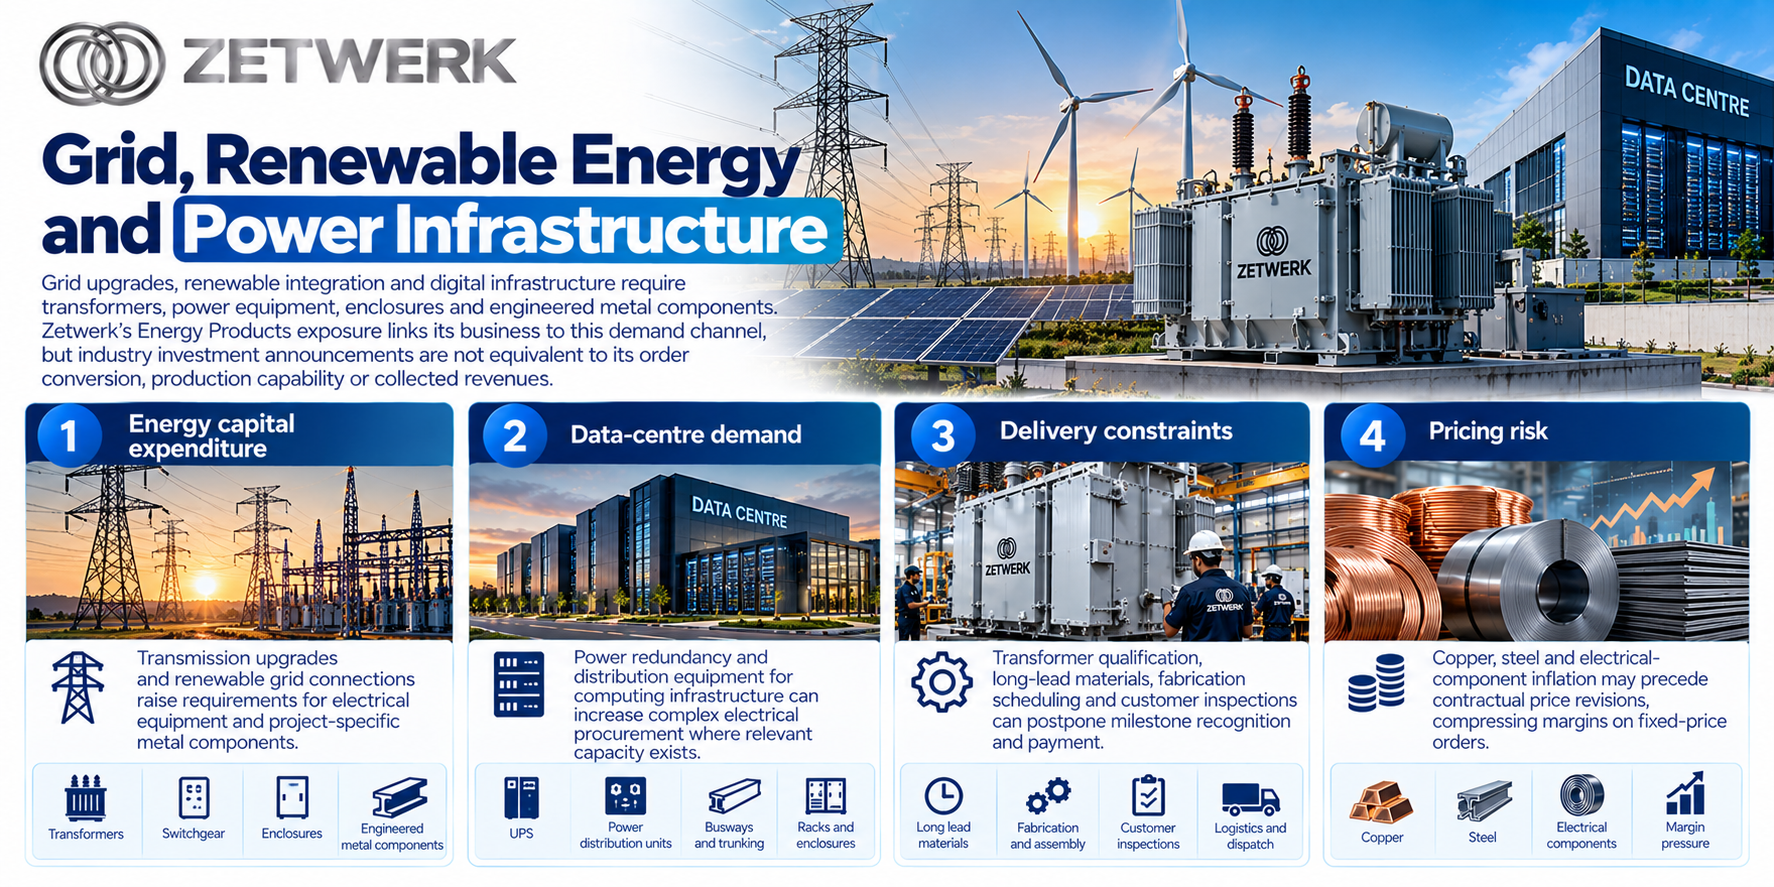
Grid expansion has a direct manufacturing linkage because renewable plants, substations and industrial electrification require transformers, conductors, switchgear, structural fabrication and control equipment. Redseer places total installed Indian power capacity at approximately 513.0 GW in CY25. Within this, renewable capacity expanded from approximately 78.0 GW in CY15 to 250.0 GW in CY25, including solar rising from roughly 6.0 GW to 135.0 GW. These capacity metrics show a substantial expansion of the operating power system but should not be translated one-for-one into Zetwerk equipment orders. Equipment availability can itself constrain growth: the study estimates industry-average manufacturing lead times for power transformers of 30-36 months in India, compared with 36-42 months in the US. Long procurement and inspection cycles increase order visibility for qualified suppliers but can also delay delivery acceptance and receipt of cash, particularly for fixed-price contracts involving electrical steel and copper.
The key drivers are:
Installed base: India reached approximately 513.0 GW of installed power capacity in CY25. Grid reinforcement, evacuation infrastructure and replacement equipment are potential procurement channels, subject to utility approvals and actual tender awards
Renewable build-out: Renewable capacity increased by roughly 172.0 GW between CY15 and CY25, with solar capacity increasing to approximately 135.0 GW. This is a system-wide capacity trend, not Zetwerk's contracted supply volume
Production bottlenecks: Industry transformer lead times of 30-36 months in India and 36-42 months in the US highlight capacity constraints; late material procurement, testing or grid commissioning can postpone financial recognition
Margin and cash-flow sensitivity: Larger equipment orders can require raw-material commitment before customer acceptance. Rising copper, electrical-steel or logistics costs may reduce project margin where escalation protections are limited
Risks in the Industry
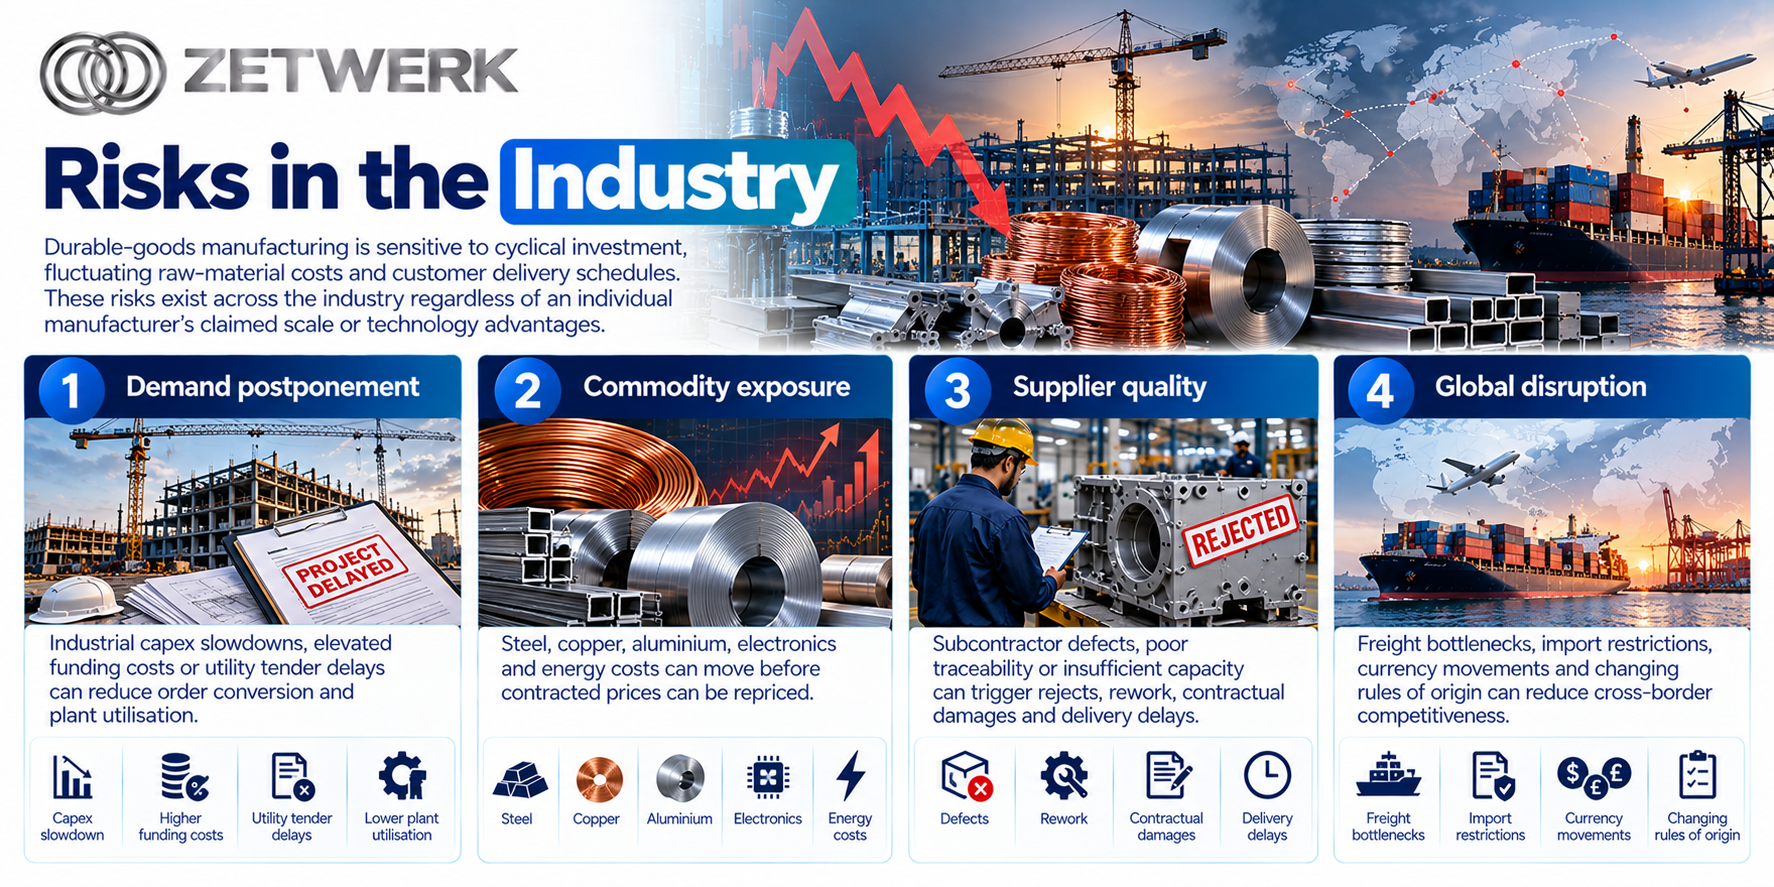
The principal risks are that forecast industry spend may not convert into profitable, cash-generative orders on schedule. The projected Indian durable-goods procurement pool spans INR 37,54,000.0-42,57,000.0 Cr. in FY31P, a range of INR 5,03,000.0 Cr. between its low and high cases; this illustrates sensitivity even within the commissioned industry forecast. Capital-goods demand depends on factory expansion and public-sector projects, whereas electronics and commodity inputs are exposed to pricing, technology and inventory cycles. Redseer identifies steel, aluminium, zinc and copper volatility, tariff and local-content changes, and dependence on a limited pool of qualified vendors as threats. Technical risk is amplified in energy, aerospace and defence, where product failure may entail rework, warranty claims and reputational damage. Extended payment cycles are especially consequential in a distributed-supplier model because supplier funding commonly precedes customer inspection and collection.
The key risks are:
Cyclical and forecast risk: FY31P Indian procurement forecasts differ by INR 5,03,000.0 Cr. between scenarios. Industrial capex postponements, slower financing or public tender delays can reduce volumes and utilisation relative to the high-growth case
Price and policy risk: Fixed-price engineering contracts can be squeezed by steel, copper, aluminium, energy and freight volatility. Changed import duties or mandatory local content may also render previously economic sourcing arrangements uncompetitive; the Redseer study provides no reliable universal margin impact percentage
Supplier-quality and timing risk: Around 21.0% of India's 76.1 million registered MSMEs operate in manufacturing. A fragmented tiered network raises audit costs; transformer lead times of 30-36 months in India demonstrate how delayed capacity or components can tie up working capital
Liquidity and adoption risk: Vendors can require advance payments before manufacturing, while customers pay after inspection. Established OEM sourcing relationships and limited digital readiness among smaller factories can slow platform adoption; addressable TAM is not contracted, profitable platform revenue
Government Policy Support
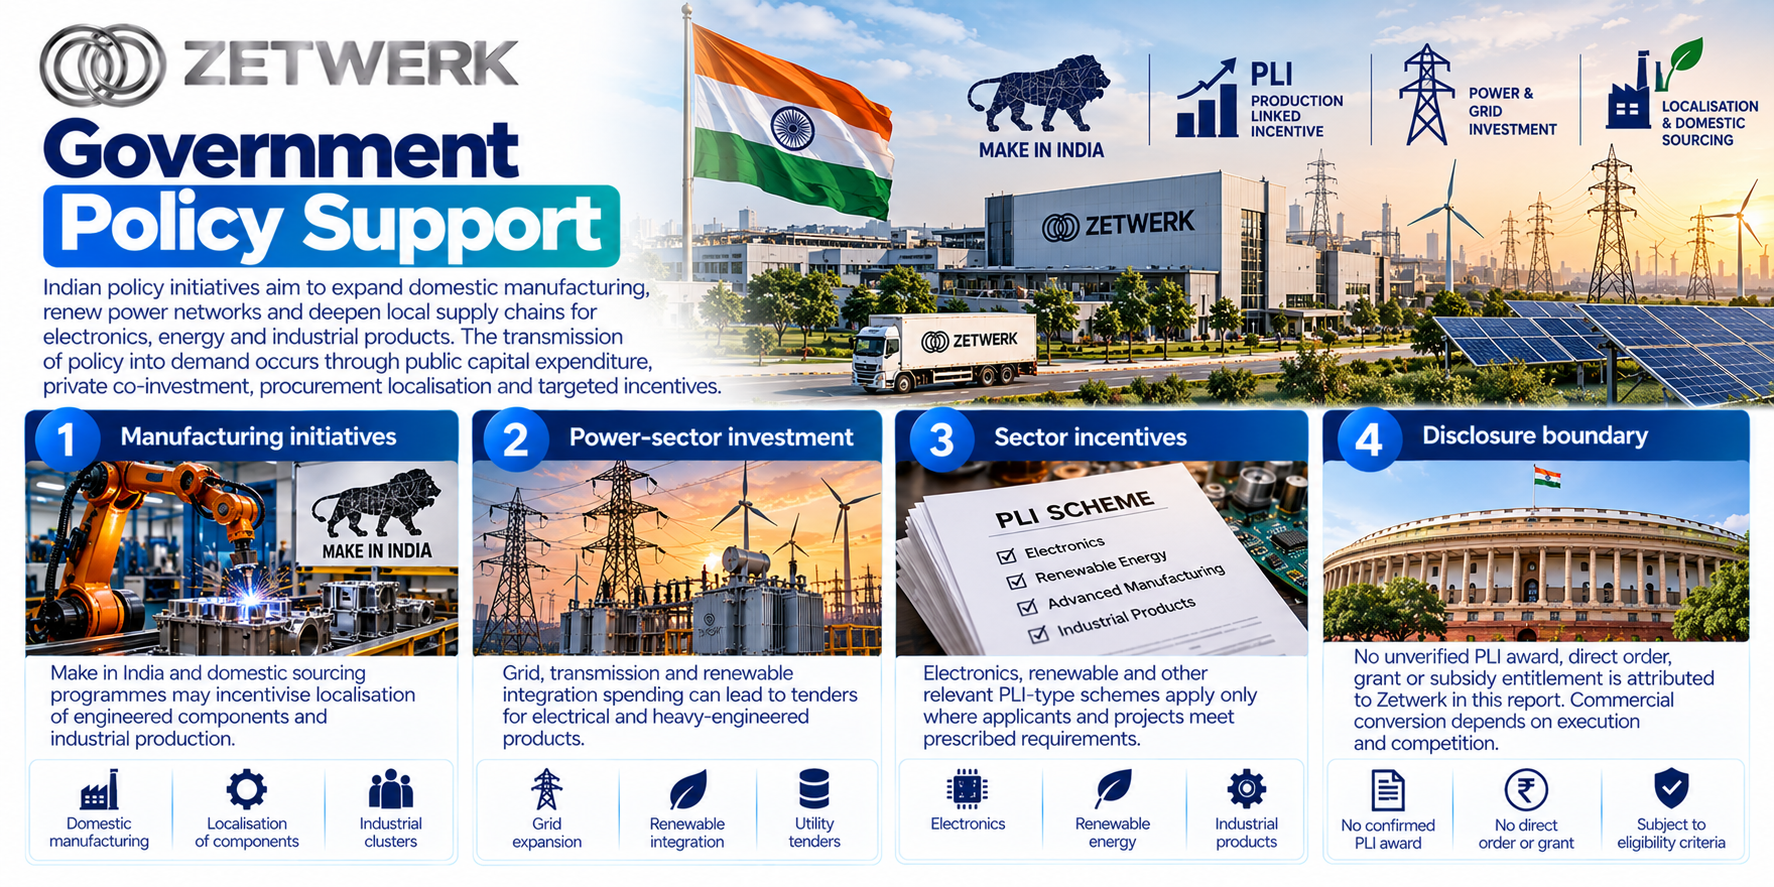
Government policy is a meaningful, but conditional, demand enabler rather than direct assurance of sales to Zetwerk. According to Redseer, India's PLI programmes span 14 industries; as of CY25 the report cites cumulative investment commitments above INR 1,97,000.0 Cr. and realised investment above INR 1,88,000.0 Cr. It also cites INR 31,10,000.0 Cr. of investment attracted under the National Infrastructure Pipeline during CY20-CY25. These are industry-wide reported commitments/investments, not fresh cash awarded to the issuer. Other mechanisms include the Phased Manufacturing Programme, Make in India, Atmanirbhar Bharat and PM Gati Shakti/National Logistics Policy, intended to foster component localisation and integrated infrastructure. Eligibility thresholds, project approval, supply qualification and local-content tests determine which participants benefit. A sector budget, incentive headline or announced capex plan should never be booked as Zetwerk revenue or represented as a company-specific subsidy.
The key policies are:
PLI and localisation: Redseer reports 14 PLI-covered industries and over INR 1,88,000.0 Cr. in realised investment as of CY25. This may stimulate demand for manufacturing equipment and supplier ecosystems, but recipients, disbursements and approved assets are scheme-specific
Infrastructure-linked procurement The reported INR 31,10,000.0 Cr. of NIP-attracted investment in CY20- CY25 underpins activity across energy, transport and industrial parks. Procurement emerges through individual tenders and execution, not automatically from headline investment
Electronics and white goods: Indian electronics production grew from INR 5,47,000.0 Cr. in FY20 to INR 11,30,000.0 Cr. in FY25. Redseer also cites more than INR 11,198.0 Cr. committed under the White Goods PLI; these are sector indicators, not a confirmed Zetwerk grant or offtake
Implementation safeguards: Make in India, phased manufacturing, PM Gati Shakti and logistics initiatives can improve localisation and connectivity. Benefits remain conditional on actual facility readiness, eligibility, tender wins, certification and competitive pricing; no unverified scheme entitlement is attributed to Zetwerk
Fundraise/Future Plans
Shareholding
Pre-issue shareholding
Promoter Holding 0.0%
Post-Issue Shareholding
Promoter Holding 0.0%
Category
Pre-Issue%Post-Issue%
Promoters
Amrit Pratik Acharya
7.7%6.0%
Srinath Ramakkrushnan
8.5%6.7%
Total Promoter Holding
16.2%12.7%
Additional Shareholders
Other Shareholders
83.8%87.3%
Total Additional Holding
83.8%87.3%
Total Shareholding
100.0%100.0%
- Overview
- Business
- Financial Highlights
- Industry Overview
- Fundraise/Future Plans
- Documentation
Get the Preqt App and keep in touch around the clock!
 Monitor your investments in real-time.
- Receive tailored deal suggestions.
- Get real-time updates and alerts.
